Ahmed Saud Mohammed![]() | Isam Kh. Alhadeethi
| Isam Kh. Alhadeethi![]() | Basheer Al-Hadeethi
| Basheer Al-Hadeethi![]() | Atheer Saleem Almawla*
| Atheer Saleem Almawla*![]()
© 2025 The authors. This article is published by IIETA and is licensed under the CC BY 4.0 license (http://creativecommons.org/licenses/by/4.0/).
OPEN ACCESS
Climate change is the most significant issue confronting the world. Rainfall and temperature are the most significant climate variables that can indicate climate change. The current study aims to investigate the effect of climate change on the distribution of rainfall and temperature in Iraq. This can be done by analyzing changes in temperature and rainfall, the general trends of these changes, and their impact on development in Anbar Governorate. The study was conducted in the northern desert in the western part of Iraq. Six weather stations, including Ramadi, Haditha, Anah, Qaim, Rutba, and Nakheb, were used to analyze the characteristics of temperature and rainfall for the period from 1980 to 2020. The average monthly data were divided into four decades to clarify the effect of climate change on the study area. ArcGIS version 10.8 was used to perform interpolation. GIS techniques were employed to draw contour line maps, which are a popular method for representing surfaces using lines that connect points with equal rainfall depth (mm) or temperature (℃). The Mann‑Kendall trend test and Sen’s slope estimator were utilized to analyze the trend direction. The results showed that the amount of change in temperature and rainfall during the 40-year study period was 0.86℃ and -47.97 mm, respectively. The results show that climate change has a strong effect on the distribution of rainfall and temperature. The spatial analysis using GIS for average temperature and rainfall data over the investigated time periods clarifies that there is a strong trend in temperature distribution and a declining trend in rainfall distribution during the four decades. According to the result, the temperature was higher in the fourth decade than it was in the first decade. In contrast, the rainfall was lower in the fourth decade than it was in the first decade.
climate change, rainfall decline, temperature, Iraq, GIS, Mann‑Kendall, Sen’s slope estimator
The variations in precipitation volume, type, intensity, and frequency have been recorded year to year and across decades. These variations have an impact on civilization and the environment. A short period of intense rainfall might result in local flooding and runoff. Meanwhile, steady and moderate rainfall helps plants by soaking into the soil [1]. Climate change is the alteration of weather patterns over a long period of time, such as decades or years, in a specific location or on a global scale. These changes may be evident, such as changes in average weather conditions or in the statistical distribution of weather events [2]. The understanding of climate events with extreme trends is more pressing in comparison with the changes in monitoring the average climate during global warming. This is attributed to changes in the intensity or frequency of such events, which may have a greater impact compared to changes in the average climate, which are more sensitive to climate change [3, 4]. Climate change is described by the Intergovernmental Panel on Climate Change (IPCC) as the state of change in climate that is recognized (for example, through statistical tests) as changes in the mean and/or variability of its properties and that lasts for a long time, usually decades or more. It describes how the climate has changed over time, whether due to human activities or natural fluctuations [5]. Globally, the mean annual air temperature rose by about 0.5℃ during the period from 1850 to 1990 [2]. It has been found that the main cause of climate change is carbon dioxide (CO2) released into the atmosphere by volcanic eruptions and respiration. It can dissolve upon contact with ocean surfaces or be absorbed through photosynthesis by plants. Currently, the records show that the concentration of CO2 in the atmosphere is about 359 parts per million by volume (ppmv), and it is expected to increase due to human activities [6]. Studying climate change and its impact on the hydrological cycle is a critical factor in water resource management [7].
The availability of fresh water is seriously threatened by the increasing demand for water and fears of pollution, especially in dryland areas around the world [8]. The quantity and quality of fresh water in dry areas, especially desert regions, are uncertain due to the effects of climate change on temperature intensity and distribution, as well as the amount and distribution of rainfall [9-11]. Water has been greatly affected by climate change, which is considered one of the most important elements in the urban, industrial, and economic progress of any country [12, 13]. Extreme weather and hydrological phenomena brought on by global warming have intensified conflict between water supply and demand as well as uncertainty around water supplies [14].
In their work, Gramz et al. [15] selected the Cherrat watershed in northwest Morocco as the study area. They used remote sensing and geographic information system (GIS) to quantify climate change and investigate the influence of this change on the water surface in the studied area. They concluded that the water surface area increased from about 0.6 ha to 6 ha during the period between 1999 and 2009. In contrast, a decrease of about 4 ha occurred in 2019. In 2023, a significant rise to about 55 ha was recorded.
Ahmad et al. [16] investigated the impact of climate change on sedimentation and hydrological dynamics using GIS and SWAT. The study highlights the impacts on water availability and sedimentation in the Shyok River basin in the Karakoram region. The study used the ERA5 reanalysis dataset to evaluate seasonal precipitation and temperature trends. The results showed that the temperature had increased by approximately 1.5℃. The seasonal precipitation analysis revealed an increasing trend in winter, while other seasons showed fluctuating trends. Moreover, the precipitation trends were found to be non-significant, with P > 0.05.
Tulu et al. [8] applied several climate change scenarios in drylands to determine the impact of water quality on production and health. The study emphasizes that the availability of fresh water is seriously threatened by increasing demand and fears of pollution, especially in dryland areas worldwide. In an earlier study by Ibrahim and Al-Dabbas [17], changes in maximum and minimum temperatures and rainfall were investigated at climate stations in Baghdad, Kut, and Diyala between 2000 and 2019. The study showed a rise in the average annual maximum and minimum temperatures and a decline in the annual average rainfall throughout the study area. Furthermore, the study classified the climate of the study area and found that it is semi-arid to arid. Chen et al. [14] assessed the impact of climate change on the ARNC's water resources, hydrological systems, agricultural systems, and desert ecosystems. Furthermore, between 1961 and 2017, the temperature increased by 0.31 degrees Celsius each decade. Changes in glaciers, snow cover, and precipitation type had a significant impact on hydrological processes, particularly in rivers that receive their primary recharge from meltwater. In addition, the extent of the desert-oasis transition zone decreased as a result of the recent sharp increase in irrigated land area and the warming trend. Agricultural security is being threatened by increases in drought and temperature. El-Beltagy and Madkour [18] noted that the degradation struck over 2,000 million hectares of land, leading to a decrease in the variety of crops grown, a rise in the shortage of water, and a greater degradation of natural resources. The effects of climate change are predicted to transcend all boundaries, including plant species and farming methods. Institutional adjustments, alternative policies, and new information are necessary to keep the system in balance. Anbar Governorate was chosen as a study area because it is one of the largest governorates in Iraq and contains large areas of agricultural land and potentially exploitable agricultural land. These lands are starting to be exposed to desertification, degradation, and a decline in vegetation cover due to climate change, represented by excessive increases in temperatures and low rainfall.
The current study addresses climate change and its effects on rainfall and temperatures in the western region of Iraq, which is classified as an arid climate zone, covering 33% of the area of Iraq. The study is important because it addresses two very important issues at the global level, which are climate change and the associated decrease in rainfall and extremes in temperature. The current study aims to investigate the temperature and rainfall variation in the northern desert of the Western Desert in Iraq for four decades, 1980-2020, as an indicator of local climate variation and its reflection on the general climate.
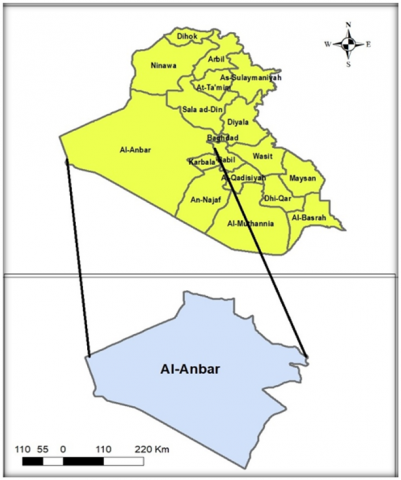
In this study, Anbar Governorate was chosen as a study area. It is located in the western part of Iraq, between latitudes (30° 11ʹ 21ʺ – 35° 9ʹ 46ʺ) and longitudes (38° 47ʹ 48ʺ - 44° 9ʹ 0ʺ), see Figure 1. Anbar governorate is considered one of the largest governorates in Iraq, with an area of 138,501 km2, 33% of the total area of Iraq. It is also characterized by low rainfall, as rainfall ranges between 50-200 mm annually.
Figure 1. Study area Ramadi City – Anbar Governorate - Iraq
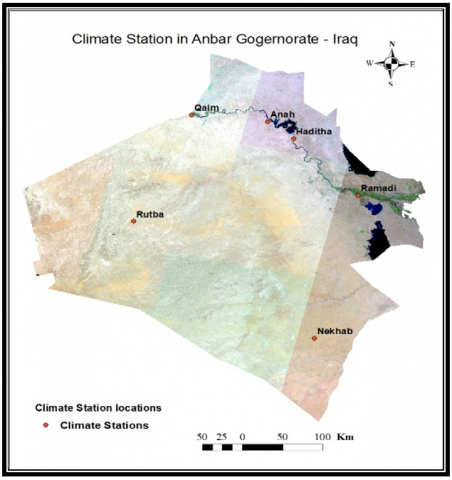
Climate change was studied for two climate parameters, namely temperature and rainfall, for the northern desert of Iraq, which represents the Anbar Governorate. In the present study, the climate data used are temperature and rainfall for the time periods from 1980 to 2020. The data was divided into four decades: 1990-1980, 1990 - 2000, 2010-2000, and 2020-2010 to study the variations over these four decades. Climatic data were collected from the General Authority for Meteorology and Seismic Monitoring for six weather stations: Al-Rutba, Al-Nukhayb, Al-Ramadi, Haditha, Anah, and Al-Qaim, as shown in Figure 2.
The climatic parameters (rainfall and temperature) were geo-statistically mapped using the ArcGIS 10.8 version by using interpolation techniques. Contour lines are a familiar way of representing surfaces on maps, representing a line through all contiguous points with equal quantity of rainfall depth (mm) or temperature degree (℃). A rainfall and temperature contour were carried out using ArcGIS for the four decades as mentioned abo.
During the data collection steps, a lack of available data was obvious. This is attributed to the very limited number of weather stations that were distributed in the study area. Therefore, spatial interpolation plays a key role in overcoming this issue, where the missed data can be estimated. Moreover, this method is used for predicting the variables that are indirectly measured at different locations [19]. Interpolation Spline is used for estimating the values by minimizing the surface curvature by utilizing a specific mathematical function [20]. The current study used a Spline interpolation tool in ArcGIS 10.8 for drawing thematic contour maps of temperature and rainfall across the entire study area. It is stated by ESRI [21] that, based on average data of a group of points, the spline interpolation can be used to estimate the values for each sample.
Figure 2. Anbar climate stations
GIS is a tool that is utilized to deal with spatial reference data. It has the capability of manipulating, analyzing, and displaying this data [22]. This type of data is defined or classified based on its geographic location features (coordinate system). This data type can be extruded from different sources, which may include existing satellite imagery, maps, and GPS [23]. GIS has become very important in handling spatial data [24]. ArcGIS is considered one of the most famous GIS software programs produced by the American company Esri to collect, retrieve, store, analyze, process, and display spatial and non-spatial data [25].
In recent years, GIS has been considered a very suitable technology for studying climate change in arid and semi-arid regions and drawing thematic maps to assess these changes in extreme temperatures and the significant decrease in rainfall, and determining the trends of changes. Furthermore, it has been used as an important analytical tool in studying climate change [26]. Climate change has also been studied for many decades through the effect of surface climate elements and enabling them to delineate climate maps and update them with the least cost and time [27]. The GIS techniques can investigate how the risk in arid and semi-arid regions, which resulted from drought, can be influenced by climate change. This can be done by analyzing the drought trends by utilizing a diverse dataset that includes geographical information, climate projections, and environmental parameters [28].
A trend is the direction of a phenomenon over a given time period. It may be identified using statistical tests, which are used to determine whether the trend in the data is upward or downward over time. In the present study, two nonparametric methods were utilized to analyze the trend, which are Sen’s slope estimator and the Mann‑Kendall trend test [29, 30].
5.1 Mann‑Kendall trend test (MK)
In hydrological and meteorological time series, the MK test is the most common method that was employed to evaluate the trend significance [31]. It is a nonparametric test that does not need a normal distribution of the data [32]. The MK statistics (S) can be calculated for a given (x) series by using Eq. (1).
$S=\sum_{i=1}^{n-1} \sum_{j=i+1}^n \operatorname{sgn}\left(x_j-x_i\right)$ (1)
where, sgn is a signum function, n is the data number, while xiand xj represent the data values in i and j time series.
The signum function, sgn(xj - xi), is provided as follows: The data values of every xi are utilized as a reference point for comparison with the data values of xj, that is introduced in Eq. (2). Eq. (3) is used for the determination of the variance association with S.
${sgn}\left(x_i-x_j\right)=\left\{\begin{array}{l}+1 \,\, { if } \,\,x_j-x_i>0 \\ 0 \,\, { if }\,\, x_j-x_i=0 \\ -1 \,\, { if } \,\,x_j-x_i<0\end{array}\right.$ (2)
${var}(s)=\frac{n(n-1)(2 n+5)-\sum_{i-1}^j t_i\left(t_i-1\right)\left(2 t_i+5\right)}{18}$ (3)
where, j represents the number of tied groups, and it denotes the number of data points in group j. The value of v, which is the standardized test statistic, is calculated by using Eq. (4). When the result of the Z value is positive, the trend of the data is upward. On the other hand, when the Z value is negative, the trend of the data will be downward, and no trend when the Z value is zero [33].
$Z=\left\{\begin{array}{l}\frac{s-1}{\sqrt{ { var }\, s}} \,\, { if } \,\,S>0 \\ 0 \,\, { if } \,\,S=0 \\ \frac{s+1}{\sqrt{ { var }\,\, s}} \,\, { if } \,\,S<0\end{array}\right.$ (4)
5.2 Sen’s slope estimator
Sen's slope estimator approach was employed to estimate the slope of identified significant trends, where the variance of the residuals must remain constant across time. Sen's approach can be calculated by using Eq. (5) [29, 31].
$Q_i=\frac{x_j-x_k}{j-k} \quad for \quad i=1,2, \ldots \ldots \ldots, n$ (5)
where, xj and xk represent the data values for time series j and k, and n represents time periods.
Table 1 illustrates the results of the Mann‑Kendall value and Sen's slope estimator for temperature and rainfall during 1980 - 2020. The result in the table indicates that there is an upward trend in temperature value for decades of data, and for average 40 years of temperature data, on the other hand, the downward trend can be clearly seen in the data of rainfall for both average rainfall of 40 years and average rainfall of four decades.
Table 1. Mann-Kendall’s statistic and Sen’s slope estimator for average rainfall and temperature parameters in 6 different meteorological stations in the northern desert in the west of Iraq during 1980-2020
|
No. |
Data |
n |
Statistics (S) |
Var (s) |
Mann-Kendall |
Sen’s Slope |
Test Results |
|
1 |
Ave. temperature of 40 years |
41 |
374 |
7916 |
4.19 |
0.03 |
Upward |
|
2 |
Ave. rainfall of 40 years |
41 |
-340 |
7926.67 |
- 3.8 |
-1.74 |
Downward |
|
3 |
Ave. temperature of four decades |
4 |
4 |
8.67 |
1.02 |
0.3 |
Upward |
|
4 |
Average rainfall of four decades |
4 |
-6 |
8.67 |
-1.69 |
-16.45 |
Downward |
The phenomenon of climate change has emerged recently as a result of global warming due to the increasing human activities by burning more fossil fuels, which has led to a greater concentration of gases, causing this phenomenon. This caused a negative impact on the climate of Iraq by increasing the temperature and low rainfall. As a result, the two most important elements of climate were emphasized: temperature and rainfall.
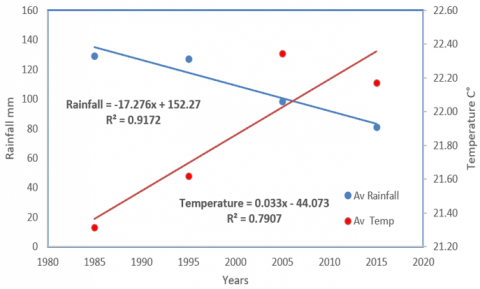
Any change in climate parameters, even in the slightest, may cause a wide change in the climate in distant areas and at different times. Therefore, climate changes at the global range or regional scale will have an effect on local climates and vice versa. In climate change studies, there is a wide range of influences on natural phenomena such as temperature, precipitation, humidity, wind speed, drought, etc. However, this study relied on monthly averages of rainfall and temperatures over four decades. Figure 3 shows the behavior of the monthly average rates of rainfall and temperatures for a time period of four decades. As is evident in this, there is a strong negative linear relationship between rainfall and time, where the general trend of this relationship is inversely proportional. The highest value of the average rainfall amounts was 129 mm in the first decade (1980-1990), while the lowest value was 81.21 mm in the fourth decade (2010-2020), as shown in Figure 3.
Figure 3. Rainfall and temperature linear regression relationships with time (4 decades)
The monthly temperature values showed a strong positive relationship with the progression of time, indicating that the general trend of this relationship is directly proportional. The highest temperature value reached 22.17 in the year 2015, while the lowest value was 21.13 in the year 1985. The coefficient of determination (R2) of rainfall regression equations between rainfall and time (years) shows a strong correlation between rainfall and years, where R2 was equal to 0.917. While the R2 of Temperature regression equations between temperature and time (years) shows a strong correlation, which was equal to 0.790, see Figure 3.
Globally, the mean annual air temperature increased by about 0.5℃ for the time period 1850 to 1990 [34].
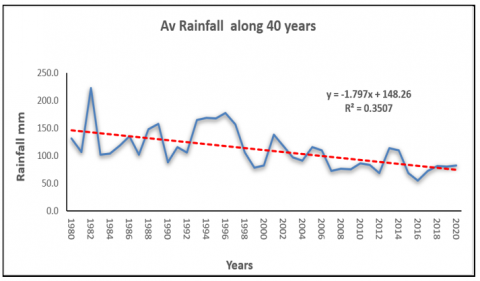
Figure 4. Rainfall relationships with time (4 decades)
Figure 4 shows the relationship between annual rainfall rates over 40 years, and shows that there is a weak negative relationship and that rainfall decreases over time. The figure shows that the year 1982 had the highest rainfall value of 222.1 mm, while the lowest rainfall was 55.3 mm in 2016. Figure 4 also indicates that the years preceding 1997 recorded a rainfall rate much higher than in 1997 and the years that followed. This confirms the validity of official data indicating that the beginning of climate change in Iraq began in 1997 and the years that followed. The trend line indicates that rainfall intensity in the study area decreased during the time periods of the current study.
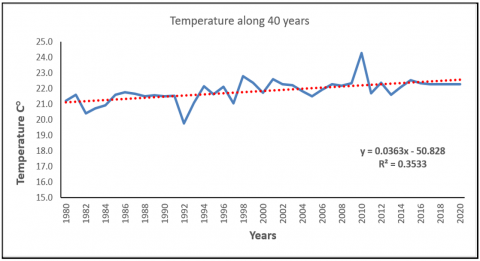
Figure 5 shows the relationship between annual temperature rates over 40 years. It shows that there is a positive relationship and that the temperature in general increases over time, despite the presence of years in which the temperature drops significantly from the general line, and in the following year, the temperature rises above the general line. Furthermore, Figure 4 indicates that the largest decrease in temperature from the regression line occurred in 1992 and was 19.8℃, and the largest increase in temperature from the general regression line was 24.3℃ in 2010. It can be seen that the temperature in the study area increased during the time periods, as indicated by the trend line.
Figure 5. Temperature relationships with time (4 decades)
The current study produced an important result, which is compatible with those of other previous studies in Iraq, such as studies [17, 35, 36]. These studies investigated the annual rainfall (mm) frequency curves and the average annual temperature (mean, maximum, and minimum) for historical data in Baghdad, Diyala, and Wasit. An inverse relationship was found between the annual relative humidity and annual rainfall with time, while it was the opposite for temperature. These studies concluded that Iraq is facing severe impacts of climate change.
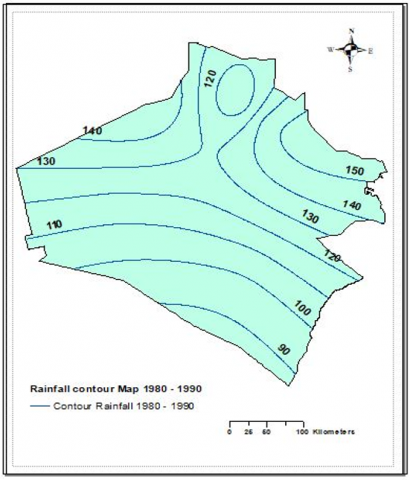
Figure 6. The spatial distribution of the rainfall contour lines for the entire Anbar Governorate for the period from 1980 – 1990
6.1 Climate contour lines
In recent years, geographic information systems have emerged as a powerful analytical tool for studying and monitoring climate change. The contour line method is used for representing the quantitative phenomena with spatial extension as lines that pass through the points that represent the phenomena, with equal quantitative values. Representing climate data with contour lines is very important in climate studies. The more climate stations monitor climate elements, the more accurate the contour map of the climate variable under study.
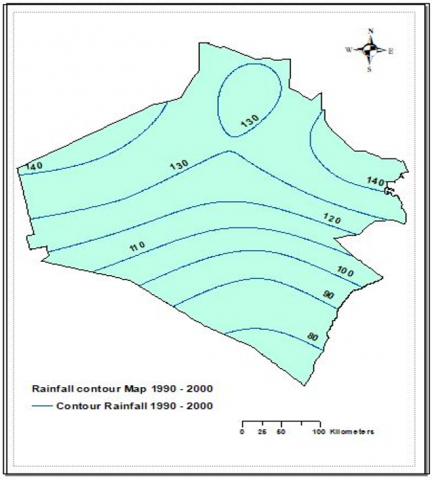
Figure 7. The spatial distribution of the rainfall contour lines for the entire Anbar Governorate for the period from 1990 - 2000
6.1.1 Rainfall contour line
The results from Figure 6 illustrates that there is a large spatial variation in the annual rainfall rate in the study area during 1980 - 1990, and this variation is generally from north to south, as the largest rainfall value was 150 mm in the northeastern region while the lowest rainfall value was 90 mm in the south region.
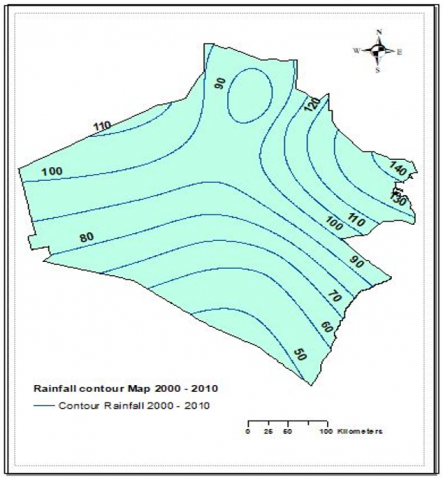
Figure 8. The spatial distribution of the rainfall contour lines for the entire Anbar Governorate for the time periods from 2000 - 2010
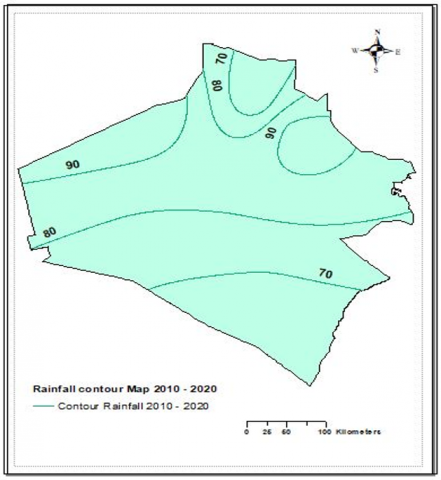
Figure 9. The spatial distribution of the rainfall contour lines for the entire Anbar Governorate for the time periods from 2010 - 2020
Figure 7 indicates a slight reduction in the annual rainfall rate in comparison with Figure 6, by about 10 mm. The results from Figure 7 illustrates that there is a large spatial variation in the annual rainfall rate in the study area during 1990 - 2000, and this variation is generally from north to south, as the largest rainfall value was 140 mm in the northeastern region while the lowest rainfall value was 80 mm in the south region.
In comparison with Figures 6 and 7, Figure 8 shows a moderate decrease in the annual rainfall rate of about 30-40 mm for the entire borders of the study area. It is obvious that a large spatial variation in the annual rainfall rate in the study area during 2000 - 2010 occurred. This variation changed from the northeast with the largest rainfall value, which is equal to 140 mm, to the south with the lowest rainfall value, which is equal to 50 mm.
A dramatic decrease in the annual rainfall rate for the last decade, which represents the time period from 2010 - 2020, has occurred as shown in Figure 9. It shows that there is a large spatial variation in the annual rainfall rate for the whole area. This variation is generally changed from the largest value of 90mm, which is recorded in the northeastern and northwestern regions, to the lowest rainfall value of 70 mm in the north and south regions.
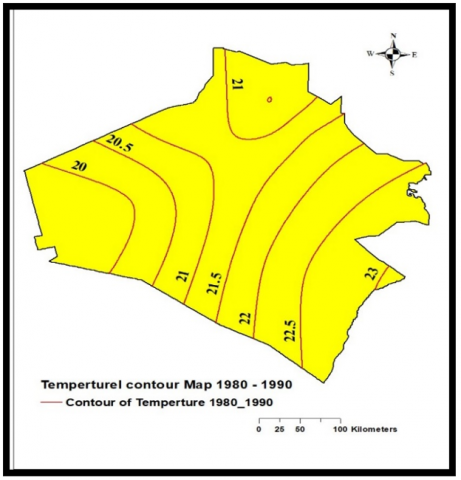
Figure 10. The spatial distribution of the temperature contour lines for the entire Anbar Governorate for the time periods from 1980 - 1990
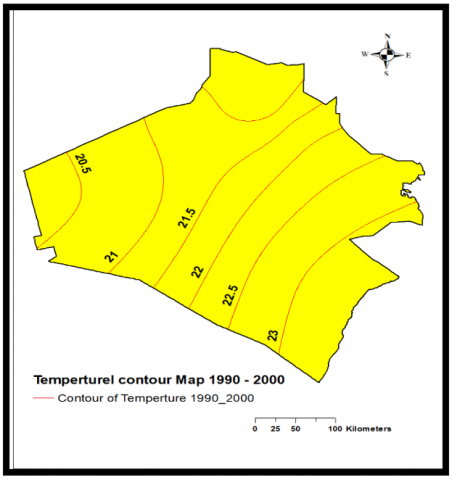
Figure 11. The spatial distribution of the temperature contour lines for the entire Anbar Governorate for the time periods from 1990 - 2000
6.1.2 Temperature contour line
The behavior of temperature for the study area can be shown as a contour line in Figures 10 to 13. In these figures, the temperature effect on the climate of Anbar governorate can be clearly noted. Figure 10 demonstrates that the annual temperature rate decreased from west to east was equal to 3℃ for the time periods from 1980 - 1990, and the lowest temperature value was about 20℃, while the largest temperature value was 23℃.
Figure 12. The spatial distribution of the temperature contour lines for the entire Anbar Governorate for the time periods from 2000 - 2010
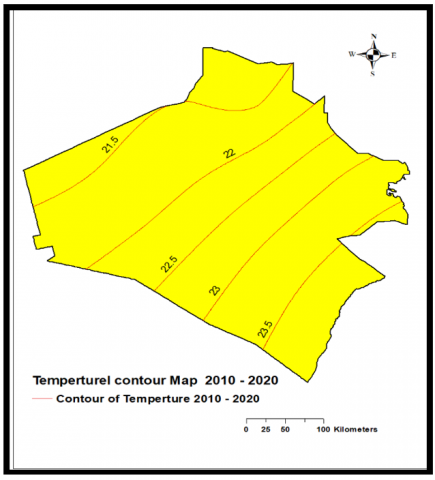
Figure 13. The spatial distribution of the temperature contour lines for the entire Anbar Governorate for the period from 2010 - 2020
Figure 11 shows that the annual temperature rate decreased from west to east with about 2.5℃ for the period from 1990 - 2000, the lowest temperature value was 20.5℃, while the largest temperature value was 23℃.
For the later time periods from 2000 to 2010, the annual temperature rate decreased from west to east by 3℃, as shown in Figure 12. It is clearly seen that the largest temperature value was 24℃, while the lowest temperature value was 21℃.
For the time periods from 2010 – 2020, which is introduced in Figure 13, the annual temperature rate decreased from west to east by 2℃. The temperature values varied from the lowest value, 21.5℃, to the largest value, which is equal to 23.5℃.
The findings of the current study indicate that the fluctuations of rainfall and temperature led to climate change, which can significantly impact water resources in the Anbar Governorate. Understanding these changes could contribute significantly to water resources management in the governorate. Based on the data shown in Figures 5-12, which represent data on annual rainfall average and annual temperature average during period, 40 years, in Anbar Governorate, the summary of the most important indicators of climate change are as follows:
The study showed that the annual rates of the elements of temperature and rainfall vary spatially in Anbar Governorate, but this variation is limited.
[1] Trenberth, K.E. (2011). Changes in precipitation with climate change. Climate Research, 47(1-2): 123-138.
[2] Udayashankara, T.H., Murthy, B.S., Madhukar, M. (2016). Impact of climate change on rainfall pattern and reservoir level. Journal of Water Resource Engineering and Management, 3(1): 10-14.
[3] Afan, H.A., Almawla, A.S., Al-Hadeethi, B., Khaleel, F., AbdUlameer, A.H., Khan, M.M.H., Ma’arof, M.I.N., Kamel, A.H. (2024). LSTM model integrated remote sensing data for drought prediction: A study on climate change impacts on water availability in the arid region. Water, 16(19): 2799. https://doi.org/10.3390/w16192799
[4] Alves, L.M., Fowler, H., de J. da Costa Barreto, N., Llopart, M. (2021). Climate change and climate variability. In Precipitation, pp. 5368. https://doi.org/10.1016/B978-0-12-822699-5.00003-3
[5] Bizikova, L., Habtezion, Z., Bellali, J., Diakhite, M., Pintér, L. (2009). Vulnerability and climate change impact assessments for adaptation. New York, USA: United Nations Environment Programme.
[6] Schimel, D., Enting, L.G., Heimann, M., et al. (1995). Co2 and the carbon cycle. Climate Change 1994: Radiative Forcing of Climate Change and an Evaluation of the IPCC IS92 Emission Scenarios.
[7] Mohammed, A.S., Almawla, A.S., Thameel, S.S. (2022). Prediction of monthly evaporation model using artificial intelligent techniques in the western desert of Iraq-Al-Ghadaf Valley. Mathematical Modelling of Engineering Problems, 9(5): 1261-1270. https://doi.org/10.18280/mmep.090513
[8] Tulu, D., Hundessa, F., Gadissa, S., Temesgen, T. (2024). Review on the influence of water quality on livestock production in the era of climate change: Perspectives from dryland regions. Cogent Food & Agriculture, 10(1): 2306726. https://doi.org/10.1080/23311932.2024.2306726
[9] Döll, P., Jiménez-Cisneros, B., Oki, T., Arnell, N.W., Benito, G., Cogley, J.G., Jiang, T., Kundzewicz, Z.W., Mwakalila, S., Nishijima, A. (2015). Integrating risks of climate change into water management. Hydrological Sciences Journal, 60(1): 4-13. https://doi.org/10.1080/02626667.2014.967250
[10] Konapala, G., Mishra, A.K., Wada, Y., Mann, M.E. (2020). Climate change will affect global water availability through compounding changes in seasonal precipitation and evaporation. Nature Communications, 11(1): 3044. https://doi.org/10.1038/s41467-020-16757-w
[11] Papa, F., Crétaux, J.F., Grippa, M., Robert, E., Trigg, M., Tshimanga, R.M., Kitambo, B., Paris, A., Carr, A., Fleischmann, A.S., de Fleury, M., Gbetkom, P.G., Calmettes, B., Calmant, S. (2023). Water resources in Africa under global change: Monitoring surface waters from space. Surveys in Geophysics, 44(1): 43-93. https://doi.org/10.1007/s10712-022-09700-9
[12] Hamed, Y., Hadji, R., Redhaounia, B., Zighmi, K., Bâali, F., El Gayar, A. (2018). Climate impact on surface and groundwater in North Africa: A global synthesis of findings and recommendations. Euro-Mediterranean Journal for Environmental Integration, 3(1): 25. https://doi.org/10.1007/s41207-018-0067-8
[13] Hirwa, H., Li, F., Qiao, Y., Measho, S., Muhirwa, F., Tian, C., Leng, P., Ingabire, R., Itangishaka, A.C., Chen, G., Turyasingura, B. (2022). Climate change–drylands–food security nexus in Africa: From the perspective of technical advances, challenges, and opportunities. Frontiers in Environmental Science, 10: 851249. https://doi.org/10.3389/fenvs.2022.851249
[14] Chen, Y., Zhang, X., Fang, G., Li, Z., Wang, F., Qin, J., Sun, F. (2020). Potential risks and challenges of climate change in the arid region of northwestern China. Regional Sustainability, 1(1): 20-30. https://doi.org/10.1016/j.regsus.2020.06.003
[15] Gramz, M., Batchi, M., Ouiaboub, L., Mettouchi, M., El Bouziani, J., Azagane, M.H., El Abbassi, M. (2025). Quantifying climate change and its impact on surface water in the Cherrat watershed in northwest Morocco using satellite imagery and GIS. E3S Web of Conferences, 607: 04012. https://doi.org/10.1051/e3sconf/202560704012
[16] Ahmad, S., Shazil, M.S., Mahmood, S.A., Abdullah-Al-Wadud, M., Tariq, A. (2025). Quantifying climate change impacts on hydrological dynamics and sedimentation using GIS and SWAT+ modelling. Hydrological Processes, 39(2): e70082. https://doi.org/10.1002/hyp.70082
[17] Ibrahim, I.A., Al-Dabbas, M. (2021). Analysis of climate parameters as indicators of climate changes in central and eastern Iraq: Khanaqin climate conditions as a case study. Iraqi Journal of Science, 4747-4757.
[18] El-Beltagy, A., Madkour, M. (2012). Impact of climate change on arid lands agriculture. Agriculture & Food Security, 1: 1-12. https://doi.org/10.1186/2048-7010-1-3
[19] Darmawan, Y., Munawar, M., Atmojo, D.A., Wahyujati, H., Nainggolan, L. (2023). Accuracy assessment of spatial interpolations methods using ArcGIS. E3S Web of Conferences, 464: 09005. https://doi.org/10.1051/e3sconf/202346409005
[20] Tran, Q.B., Nguyen, T.T. (2008). Assessment of the influence of interpolation techniques on the accuracy of digital elevation model. VNU Journal of Science: Earth and Environmental Sciences, 24(4): 176-183.
[21] Environmental Systems Research Institute (Redlands). (1996). ArcView Spatial Analyst: Advanced Spatial Analysis Using Raster and Vector Data. ESRI.
[22] Elfick, M. (1994). Elementary Surveying: SI Adaptation (8th ed.). New York: HarperCollins Publishers. ISBN 9780004990019
[23] Mahmood, M.M. (2006). Digital geotechnical map of Baghdad city Al-Rasafah side using GIS and remote sensing techniques. Doctoral dissertation, Ph. D. thesis, University of Technology, Baghdad, Iraq.
[24] Gao, J. (2009). Digital Analysis of Remotely Sensed Imagery. McGraw-Hill Professional. ISBN 9780071622472.
[25] Moussa, Y.K., Alwehab, A.A. (2024). Measuring changes in temperature rates due to urban expansion in selected municipalities of Baghdad using GIS technology. Iraqi Journal of Physics, 22(3): 126-138.
[26] Al Saady, M.T.M., AL-Janabi, R.S.H. (2024). GIS applications and satellite visuals to study climate changes. Midad Al-Adab Refereed Journal, 1(geography Department Conference).
[27] Al, A.F.U.K. (2024). The impact of climate change on the drainage of valleys in southeastern Iraq using statistical methods, remote sensing (RS) and geographic information systems (GIS). Journal of Basic Sciences, 15(23).
[28] Patel, R., Patel, A. (2024). Evaluating the impact of climate change on drought risk in semi-arid region using GIS technique. Results in Engineering, 21: 101957. https://doi.org/10.1016/j.rineng.2024.101957
[29] Bougara, H., Hamed, K.B., Borgemeister, C., Tischbein, B., Kumar, N. (2020). Analyzing trend and variability of rainfall in the Tafna basin (Northwestern Algeria). Atmosphere, 11(4): 347. https://doi.org/10.3390/atmos11040347
[30] Da Silva, R.M., Santos, C.A., Moreira, M., Corte-Real, J., Silva, V.C., Medeiros, I.C. (2015). Rainfall and river flow trends using Mann–Kendall and Sen’s slope estimator statistical tests in the Cobres River basin. Natural Hazards, 77: 1205-1221. https://doi.org/10.1007/s11069-015-1644-7
[31] Gocic, M., Trajkovic, S. (2013). Analysis of changes in meteorological variables using Mann-Kendall and Sen's slope estimator statistical tests in Serbia. Global and Planetary Change, 100: 172-182. https://doi.org/10.1016/j.gloplacha.2012.10.014
[32] Hashim, B.M., Al Maliki, A., Alraheem, E.A., Al-Janabi, A.M.S., Halder, B., Yaseen, Z.M. (2022). Temperature and precipitation trend analysis of the Iraq Region under SRES scenarios during the twenty-first century. Theoretical and Applied Climatology, 148(3): 881-898. https://doi.org/10.1007/s00704-022-03976-y
[33] Hamlaoui-Moulai, L., Mesbah, M., Souag-Gamane, D., Medjerab, A. (2013). Detecting hydro-climatic change using spatiotemporal analysis of rainfall time series in Western Algeria. Natural Hazards, 65: 1293-1311. https://doi.org/10.1007/s11069-012-0411-2
[34] Lean, J., Rind, D. (1996). The sun and climate. Consequences, 2(1): 27-36.
[35] Adamo, N., Al-Ansari, N., Sissakian, V.K. (2020). Global climate change impacts on Tigris-Euphrates Rivers basins. Journal of Earth Sciences and Geotechnical Engineering, 10(1): 49-98.
[36] Majeed, H.M.S., Ahmed, R.K., Suhad, S.K., Amin, R.A.M., Tanzeeh, M.H. (2020). Spectral indices analysis in detection of the thermal variability for Baquba city and its environmental effects with the support of GIS & RS technique. Journal of University of Shanghai for Science and Technology, 22(11): 702-711.