Rishanthiny Bala Krishnan | Kamilia Sharir![]() | Mohd Fadlee Baba | Baba Mok | Dwa Desa Warnana
| Mohd Fadlee Baba | Baba Mok | Dwa Desa Warnana![]() | Wien Lestari
| Wien Lestari![]() | Ramzah Dambul
| Ramzah Dambul![]() | Woon Zhan Wen | Arina Ismail | Rodeano Roslee*
| Woon Zhan Wen | Arina Ismail | Rodeano Roslee*![]()
© 2025 The authors. This article is published by IIETA and is licensed under the CC BY 4.0 license (http://creativecommons.org/licenses/by/4.0/).
OPEN ACCESS
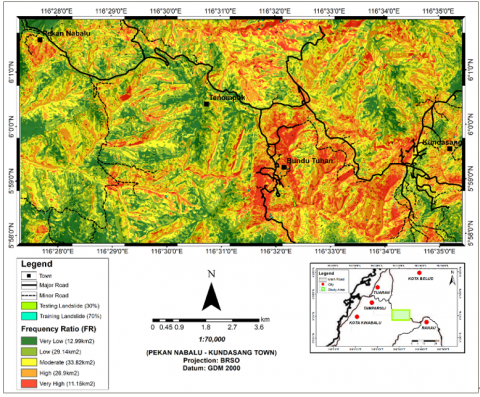
Landslides have increasingly threatened infrastructure and safety along the highland corridor between Pekan Nabalu and Kundasang, Sabah, with several incidents causing significant road closures and economic losses in recent years. This study assesses landslide susceptibility in the area using the Weights of Evidence (WoE) model, a bivariate statistical approach well-suited for handling nonlinear spatial relationships and conditional independence among causative factors. The model integrates geological formations—including the Trusmadi Formation, Crocker Formation, and Pinosouk Gravel deposit—with factors such as slope angle, land use, drainage, and lineament proximity, lithology, slope curvature, and soil series. A total of 564 landslides covering 0.27 km² were digitized to develop the susceptibility model. The resulting Landslide Susceptibility Analysis (LSA) map classifies the region into five categories: Very Low (11.39%), Low (25.56%), Moderate (29.67%), High (23.6%), and Very High (9.78%). Notably, the Very High susceptibility zones are clustered near Bundu Tuhan and constitute 14.1% of the area. Validation using the Area Under Curve (AUC) method yielded a success rate of 78.15% and a prediction rate of 77.9%. The results provide practical support for slope risk zoning, infrastructure planning, and mitigation strategies in this geohazard-prone region.
Landslide Susceptibility Analysis (LSA), Weights of Evidence (WoE), AUC curve
The region stretching from Pekan Nabalu to Kundasang in northwest Sabah, Malaysia, is highly prone to landslides due to its complex geological structure, rugged geomorphology, active tectonics, and intense climatic conditions [1-4]. This natural susceptibility has been further aggravated by rapid development and construction activities driven by growing tourism and agriculture [4-6]. As a result, the area frequently experiences landslide events that have, since the 1980s, caused significant damage to lives, infrastructure, property, the local economy, and the environment [3, 6, 7].
To assess the region's landslide susceptibility, this study applies a bivariate statistical approach using the Weights of Evidence (WoE) model. This method quantitatively integrates a dependent variable (landslide occurrence) with multiple independent causative factors to generate a spatially reliable susceptibility map [6]. The analysis is conducted using Geographic Information System (GIS) technology to assess landslide risk at a regional scale [8-10]. The WoE model is used to evaluate the relationship between landslide distribution and key contributing factors, allowing the prediction of potential future hazard zones. The resulting Landslide Susceptibility Analysis (LSA) map is validated using the Area Under Curve (AUC) method to ensure model accuracy and predictive reliability.
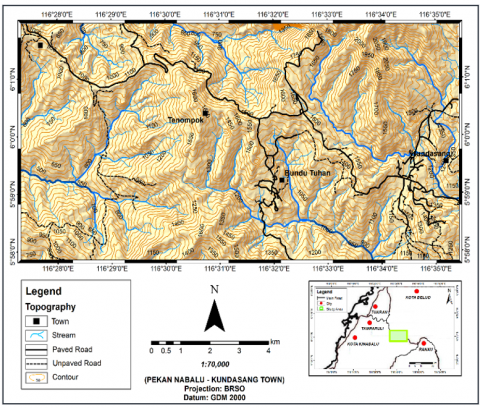
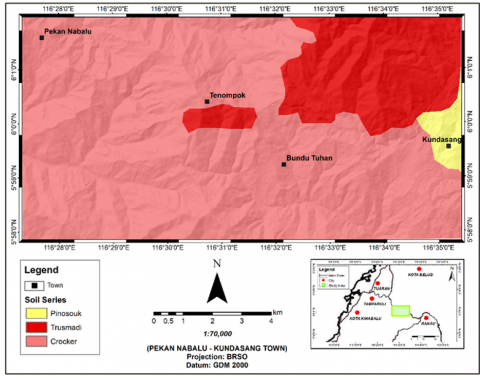
The study was conducted along the highland corridor between Pekan Nabalu and Kundasang, Sabah, Malaysia, covering approximately 114 km², bounded by latitudes 5°57’50.02” N to 6°1’57.57” N and longitudes 116°27’19.45” E to 116°35’25.97” E (Figure 1). This region is characterized by rugged topography, steep slopes, and high elevations shaped by historical tectonic uplift, active geomorphological processes, and weathering cycles [11, 12]. Many recent landslides and slope failures in the area are attributed to rapid infrastructure development and poor slope management practices [13]. One of the most devastating events occurred in Kundasang, causing infrastructure damage and economic losses estimated at nearly a trillion Ringgit Malaysia [14].
Figure 1. Location of the study area from Pekan Nabalu to Kundasang Town, Sabah, Malaysia
The climate in this region is equatorial and influenced by both northeast and southwest monsoons. According to the Malaysian Meteorological Department (2023), the average annual rainfall ranges between 3,000 to 4,500 mm, with peak precipitation occurring from October to January. This high rainfall intensity significantly contributes to slope saturation and instability.
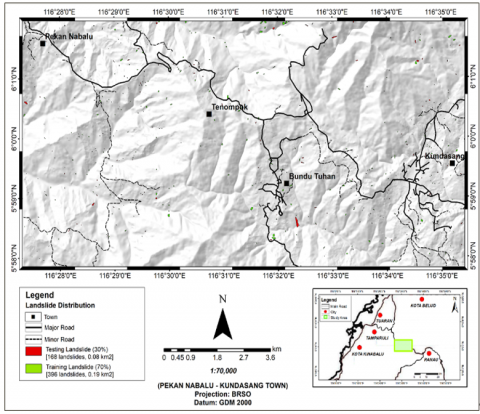
Geologically, the study area comprises three major lithological units: the Pinosouk Gravel deposits (Pleistocene to Holocene), the Crocker Formation (Late Eocene to Early Miocene), and the Trusmadi Formation (Paleocene to Middle Eocene) [15]. These formations are composed of interbedded sandstones, siltstones, shales, and loose colluvium, many of which are intensely faulted, sheared, and jointed, making the terrain prone to landslides. A schematic map illustrating the distribution of faults and geological structures across the study area is shown in Figure 2.
Figure 2. Landslide distribution map of the study area
Geographic Information System (GIS) was the primary tool used for executing the spatial analysis in this landslide susceptibility study. The process was divided into three main stages to generate a detailed landslide susceptibility map. The first stage focused on mapping the spatial distribution of observed landslides. The second stage involved selecting eight contributing factors considered relevant to landslide occurrence—namely, drainage proximity, land use, slope steepness, distance to lineaments, slope aspect, geological formation, slope curvature, and soil classification. In the final stage, the Weights of Evidence (WoE) model was employed to derive the susceptibility zones, and its accuracy was evaluated using the Area Under the Curve (AUC) technique. All spatial data were processed as raster layers with a consistent resolution of one meter, allowing for high-precision spatial analysis.
3.1 Landslide distribution map
A total of 564 landslides, encompassing both soil and rock slope failures, were digitized to develop a comprehensive landslide distribution map spanning the corridor from Pekan Nabalu to Kundasang Town (Figure 2). These landslides were delineated in polygon format using high-resolution SPOT 6 satellite imagery (2020–2022) and orthophotos provided by the Department of Survey and Mapping Malaysia (JUPEM). The inventory was compiled through visual interpretation, identifying scars based on typical morphological features such as arcuate crowns, exposed bare surfaces, and vegetation disturbance. Digitization was performed manually using ArcGIS Pro, with each landslide polygon assigned attributes including landslide type, estimated area, and source of verification.
To ensure accuracy, the landslide locations were further validated using historical data from the Sabah Department of Minerals and Geoscience (JMG) and field surveys conducted during August and October 2023. The integration of remote sensing, secondary sources, and field validation enhanced the reliability of the inventory, which served as the foundational input for the landslide susceptibility modeling using the Weights of Evidence (WoE) approach.
From the total inventory, 396 landslides (70%) were randomly selected to form the training dataset, while the remaining 168 landslides (30%) were designated as the testing dataset for model validation. This random sampling technique was applied to minimize selection bias within the GIS-based statistical analysis, in accordance with established practices [10].
The training dataset was used to construct a success rate curve, assessing the model’s ability to classify known landslides within susceptibility classes. Meanwhile, the testing dataset supported the generation of a prediction rate curve, which evaluated the model’s predictive performance. The landslide inventory used in this study was developed through a combination of desk-based image analysis, field verification, and interpretation of Google Earth imagery and IFSAR-derived datasets.
3.2 Landslide causative factor maps
This assessment incorporated eight key parameters that contribute to landslide occurrence. These include drainage proximity, land use patterns, slope gradient, distance to structural lineaments, slope orientation, underlying geology, slope profile curvature, and soil classification. The factors were chosen based on their relevance to slope instability as observed in the study area. The selection was guided by the area's geomorphological context, the diversity of landslide mechanisms identified, and documented past landslide occurrences [16, 17].
Several thematic factor maps, including lithology, soil series, and land use, were obtained from the Department of Agriculture (DOA) (2018) and the Department of Mineral and Geoscience Malaysia (JMG) (2018). In contrast, slope angle, slope aspect, slope curvature, drainage proximity, and lineament proximity were derived from a Digital Elevation Model (DEM) generated using Interferometric Synthetic Aperture Radar (IFSAR) data. All raster layers were produced with a consistent spatial resolution of 1 meter × 1 meter, referenced to the GDM 2000 BRSO (meters) coordinate system.
Slope angle, aspect, and curvature layers were extracted directly from the DEM, whereas the lithology, soil series, and land use layers were digitized from polygon-based vector data. Proximity maps for drainage and lineament features were developed from DEM-derived linear elements and analyzed using the Multiple Buffer tool in ArcGIS 10.4. All thematic layers were ultimately converted to raster format for use in the Weights of Evidence (WoE) statistical model.
The use of a 1 m × 1 m cell size across all raster layers provided a high-resolution spatial representation of terrain variability, which is particularly important in steep, rugged topography such as that between Pekan Nabalu and Kundasang. This resolution enabled the detection of micro-topographic features that influence slope instability, such as minor drainage channels and terrain breaks. However, it also increased computational demands and could introduce noise if not supported by equally detailed input data.
To assess the appropriateness of this resolution, a sensitivity check was conducted by comparing the susceptibility outputs against a coarser 10 m × 10 m resolution model. While both models displayed consistent spatial patterns, the 1 m resolution output offered greater zoning detail, especially along slope transitions and infrastructure corridors. Furthermore, the AUC values confirmed its suitability, with the 1 m resolution model yielding slightly higher success (78.15%) and prediction (77.9%) rates. These results justify the use of high-resolution raster layers for precise landslide susceptibility mapping at a local scale.
3.3 Landslide Susceptibility Analysis (LSA) map using Weights of Evidence (WoE) model
The Weights of Evidence (WoE) method, a bivariate statistical approach introduced by Bonham-Carter [18], was used to evaluate landslide susceptibility in the study area. Rooted in Bayesian probability, WoE applies natural logarithms and assumes conditional independence among the landslide causative factors (Eq. (1)). The model calculates positive weights (W⁺) to indicate a positive correlation between a factor and landslide presence (Eq. (2)), and negative weights (W⁻) to reflect its absence in landslide-prone areas (Eq. (3)). The contrast value (C), obtained by subtracting W⁻ from W⁺ (Eq. (4)), determines the relative influence of each factor in contributing to landslide occurrence [18].
$\mathrm{P}(\mathrm{A} \mid \mathrm{B})=\mathrm{P}(\mathrm{B} \mid \mathrm{A}) \times \mathrm{P}(\mathrm{A}) / \mathrm{P}(\mathrm{B})$ (1)
$\mathrm{W}_{\mathrm{i}}^{+}=\ln [\mathrm{P}(\mathrm{B} \mid \mathrm{A}) / \mathrm{P}(\mathrm{B} \mid \overline{\mathrm{A}})]$ (2)
$\mathrm{W}_{\mathrm{i}}^{-}=\ln [\mathrm{P}(\overline{\mathrm{B}} \mid \mathrm{A}) / \mathrm{P}(\overline{\mathrm{B}} \mid \overline{\mathrm{A}})]$ (3)
$\mathrm{C}=\mathrm{W}^{+}-\mathrm{W}^{-}$ (4)
where,
In generating the landslide susceptibility map, the Landslide Susceptibility Index (LSI) was derived by integrating the weighted raster layers of each landslide causative factor using ArcGIS 10.4. The weight assigned to each factor was calculated based on the spatial relationship between the presence or absence of landslides and the corresponding factor class, represented through pixel-based analysis. This relationship is summarized in the combination Table 1, which reflects how landslide occurrences intersect with factor distributions.
Table 1. Combining the presence of landslides and causative factors in the study area
|
|
Factor Present |
Factor Absent |
|
Landslide Present |
Npix1 |
Npix2 |
|
Landslide Absent |
Npix3 |
Npix4 |
In this table, pixel counts were extracted from the GIS environment to quantify the overlap between landslide events and factor classes. These pixel values were then used to compute the relative influence (weights) of each factor. The required input values include the total number of pixels in the study area, the number of pixels affected by landslides, and the distribution of these pixels across different factor classes.
Once the weights were determined, each factor layer was multiplied by its corresponding weight, and the resulting weighted layers were combined to form the final LSI map. The map values were then classified into five categories: Very Low, Low, Moderate, High, and Very High. This classification facilitates the identification of high-risk zones and supports informed decision-making for slope hazard mitigation and land-use planning.
3.4 Model validation
The Area Under the Curve (AUC) method was applied to validate the performance of the landslide susceptibility model [19]. To assess the model’s accuracy in predicting landslide-prone areas, the AUC analysis was conducted by integrating the landslide inventory map with the landslide susceptibility map (LSM). The inventory data were randomly split, with 70% of the landslides used as the training dataset to calculate the success rate, while the remaining 30% served as the testing dataset to evaluate the model’s prediction rate.
Using the Weights of Evidence (WoE) model, landslide susceptibility in the study area was assessed by integrating the landslide distribution map with eight causative factors. The most influential subclasses within each factor, along with their maximum Contrast (C) values, are summarized in Table 2, highlighting the strength of their association with landslide occurrences.
Table 2. Summary of landslide causative factors with the highest Contrast (C) values and their associated subclasses
|
Factor |
Subclass with Highest C |
Max C Value |
Interpretation |
|
Slope Angle |
36–60° |
0.562 |
Steep slopes increase gravitational stress |
|
Slope Curvature |
Convex |
0.648 |
Convex surfaces retain water |
|
Drainage Proximity |
< 200 m |
0.393 |
Proximity increases saturation |
|
Slope Aspect |
South-facing |
0.355 |
Greater exposure to rain and sunlight |
|
Soil Series |
Pinosouk |
0.438 |
Clay-rich and highly weathered |
|
Lithology |
Trusmadi Formation |
0.371 |
Fractured, argillaceous, faulted rocks |
|
Land Use |
Built-up |
0.372 |
Reduced vegetation, slope disturbance |
|
Lineament Proximity |
< 100 m |
0.158 |
Close to faults increases instability |
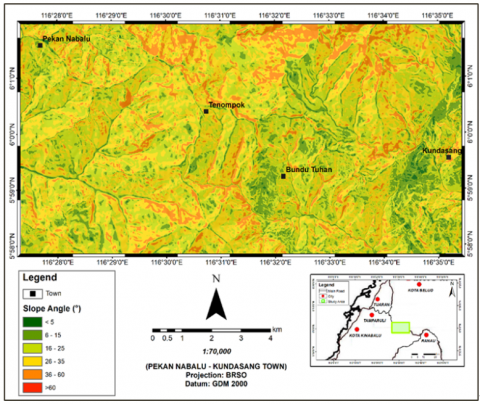
As illustrated in Figure 3, slope angle significantly influences landslide occurrence. Based on JMG guidelines [20], slope angle is classified into six categories: flat (<5°), gentle (6°–15°), moderate (16°–25°), steep (26°–35°), very steep (35°–60°), and extremely steep (>60°). Notably, slopes between 36° and 60° (WoE = 0.532) and 16° to 25° (WoE = 0.091) show a strong correlation with landslide occurrences, highlighting the role of gravitational stress in destabilizing steeper and moderately inclined terrain [21].
Figure 3. Slope angle map
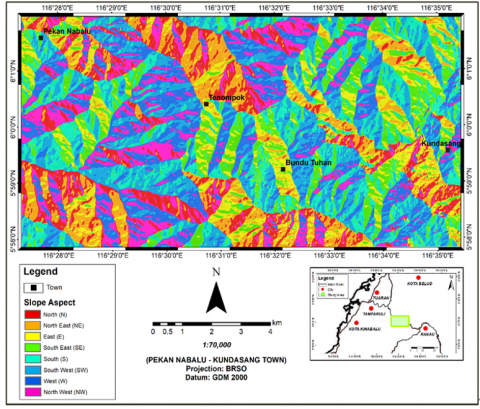
The slope aspect map (Figure 4) shows the orientation of slope surfaces in relation to environmental factors such as wind, rainfall, and solar exposure [22]. This factor is categorized into eight classes: North, Northeast, East, Southeast, South, Southwest, West, and Northwest. Aspects facing South (0.355), Southeast (0.161), Southwest (0.147), North (0.032), and East (0.027) exhibit higher WoE values, indicating greater landslide susceptibility. In particular, south-facing slopes are more prone to failure due to increased solar radiation and moisture during monsoon seasons, which reduce vegetation cover and intensify surface erosion [23].
Figure 4. Slope aspect map
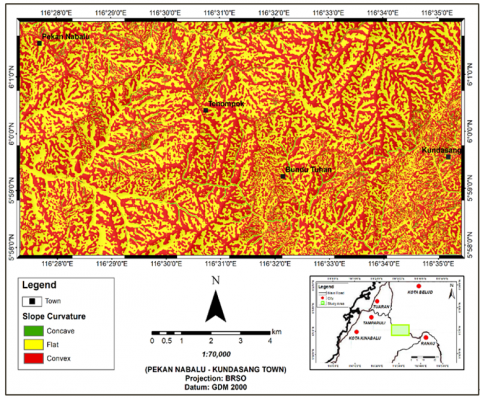
Slope curvature affects both the velocity of landslide movement and the runout distance. As shown in Figure 5, curvature is classified into convex (negative), concave (positive), and flat (zero) surfaces [24]. Landslides are more frequently associated with convex (WoE = 0.648) and flat (WoE = 0.239) surfaces. Among these, convex slopes are more prone to failure due to their upward curvature, which can retain water and become saturated over time, ultimately reducing slope stability [25].
Figure 5. Slope curvature map
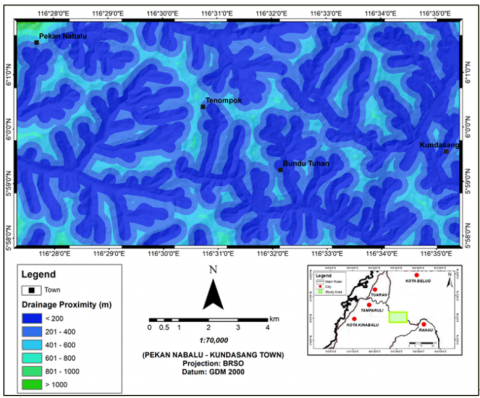
Areas close to drainage networks are more prone to landslides due to increased moisture and erosion. The drainage proximity map (Figure 6) was classified into six buffer zones at 200-meter intervals: <200 m, 200–400 m, 400–600 m, 600–800 m, 800–1000 m, and >1000 m. The highest WoE value (0.393) was observed within 200 meters, indicating strong landslide susceptibility. This is attributed to higher groundwater levels and enhanced seepage, which weaken slope stability, particularly in steep terrains affected by rapid runoff or debris flow during intense rainfall [26].
Figure 6. Drainage proximity map
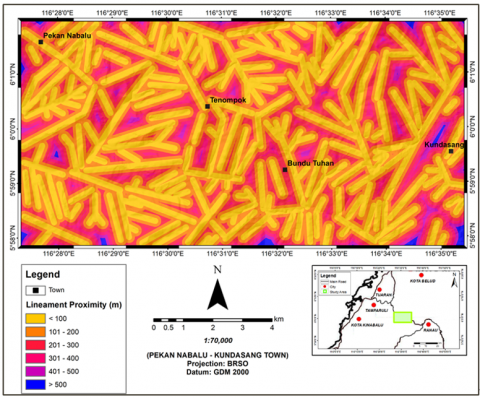
Lineament features, such as faults, play a critical role in slope stability by indicating zones of structural weakness [27, 28]. The lineament proximity map (Figure 7) was classified into six buffer zones at 100-meter intervals: <100 m, 101–200 m, 201–300 m, 301–400 m, 401–500 m, and >500 m. The highest landslide concentration occurs within 100 meters of lineaments, with a WoE value of 0.158. These features, formed by past tectonic activity and weathering, increase landslide likelihood, especially when triggered by earthquakes or intense rainfall [29].
Figure 7. Lineament proximity map
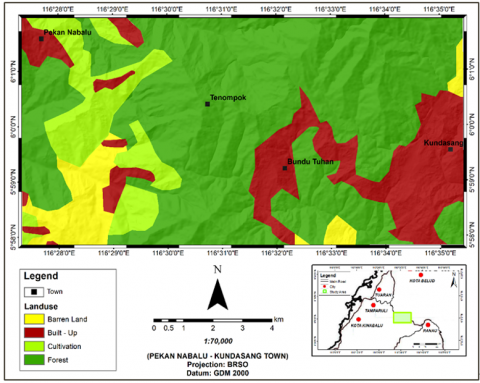
The land use map shown in Figure 8, adapted from the Department of Agriculture in 2018, highlights areas that have experienced significant development and land conversion [30]. Such activities contribute to soil quality degradation, which in turn lowers slope stability and increases the risk of landslides. Land use was classified into four categories: barren land, built-up areas, cultivated land, and forest. Among these, built-up areas recorded the highest Weight of Evidence value at 0.372, indicating a strong correlation with landslide occurrences. Continuous expansion for tourism and agricultural activities without adequate structural controls has led to frequent slope failures in critical zones, particularly around Bundu Tuhan and Kundasang.
Figure 8. Land use map
The lithological composition of an area, comprising various rock types with differing strength, texture, composition, and grain size, plays a crucial role in determining slope susceptibility to landslides. As shown in the lithology map obtained from the Department of Mineral and Geoscience (JMG) [31] categorizes the study area into three main units: the Crocker Formation, Trusmadi Formation, and Pinosouk Gravel Deposits (Figure 9). Among these, the Trusmadi Formation exhibits the highest Weight of Evidence Contrast value (C = 0.371), indicating a strong association with landslide occurrences.
Figure 9. Lithology map
This formation consists of highly weathered and argillaceous rocks, including phyllite, mudstone, and slate, which have undergone regional metamorphism [32]. Its fractured structure, extensive faulting, and the presence of numerous shear zones significantly reduce slope stability and increase water infiltration, making it particularly prone to landslides.
The soil series factor, shown in Figure 10, represents the characteristics of soils formed from weathered rock materials of various parent sources and landform origins, which directly affect the strength of slope-forming materials. The soil series map was divided into three categories—Crocker, Trusmadi, and Pinosouk soils—based on the classification developed by the Land Resources Division under the British Government’s Overseas Development Administration [33]. A higher concentration of landslides is observed in areas underlain by Pinosouk and Crocker soils, which recorded Weight of Evidence values of 0.438 and 0.234, respectively. These soils consist mainly of clay-rich mudstone, weathered sandstone, and colluvial deposits. In saturated conditions, the expansion and contraction of fine clay minerals reduce slope stability, thereby increasing landslide susceptibility [34].
Figure 10. Soil series map
To evaluate the influence of each causative factor on landslide occurrence, the contrast values (C) derived from the Weights of Evidence (WoE) model were analyzed. The results revealed that slope curvature exhibited the highest contrast value, indicating it as the most significant factor controlling landslide distribution in the study area. This was followed closely by slope angle, particularly slopes ranging from 36˚ to 60˚, which showed a strong spatial association with landslide locations due to increased gravitational stress on steep terrain. In addition, soil series and drainage proximity were found to be highly influential. Areas dominated by Pinosouk soils and those located within 200 meters of drainage networks showed elevated susceptibility, attributed to fine-grained, moisture-retentive soils and increased pore water pressure near water channels. Conversely, factors such as lineament proximity and land use had relatively lower contrast values, suggesting a weaker direct role in triggering landslides but still contributing as secondary controls.
To further support the spatial model results, field observations were conducted at several critical locations, including Bundu Tuhan and Kundasang town. These areas exhibited numerous landslide features, such as shallow translational slides, rotational failures, and debris flows, particularly on steep road cuttings and deforested slopes. The Trusmadi Formation, which dominates many of these areas, consists of fractured, argillaceous rock units such as phyllite, mudstone, and slate. These lithologies are highly susceptible to weathering and deformation, particularly under intense rainfall. Field photographs were captured and included to visually document these typical landslide manifestations and validate the model outcomes.
In terms of classification, the landslide susceptibility index (LSI) was divided into five classes—Very Low, Low, Moderate, High, and Very High—using the equal interval method. This approach was selected to maintain consistency and clarity in hazard communication, as it produces uniform class ranges that are easier to interpret and apply in local-scale planning and zoning. Unlike the quantile method, which can distort the spatial representation of susceptibility when data distributions are uneven, the equal interval method ensures that the full spectrum of susceptibility values is evenly represented, which is especially useful in mountainous regions with high data variability.
Figure 11. Landslide Susceptibility Analysis (LSA)
The generated landslide susceptibility map (Figure 11) is divided into five distinct classes of susceptibility: Very Low, Low, Moderate, High, and Very High. The equal interval classification method was used to categorize susceptibility classes instead of the quantile method. This approach provides more intuitive and visually consistent breakpoints across susceptibility levels, which is beneficial for local decision-makers and planners. In contrast, quantile classification may misrepresent hazard zones in areas with clustered data distributions, especially in mountainous terrain like this study area. The landslide susceptibility map classifies the study area into five categories: very low, low, moderate, high, and very high. The distribution by area is as follows: very low susceptibility covers 6.616 percent or 7.543 square kilometers, low at 20.954 percent or 23.888 square kilometers, moderate at 30.261 percent or 34.497 square kilometers, high at 28.056 percent or 31.984 square kilometers, and very high at 14.113 percent or 16.067 square kilometers. Overlaying the landslide inventory with the susceptibility map reveals that 29 landslides are located in the very low zone, 78 in the low, 172 in the moderate, 177 in the high, and 108 in the very high zone. A greater concentration of landslide occurrences, especially within the moderate to very high susceptibility zones, is observed along developed corridors such as the main route connecting Pekan Nabalu to Bundu Tuhan, as well as in the vicinity of Kundasang town. Areas with higher population density, including Kampung Kiau, Kampung Tiong Lokos, Bundu Tuhan, Kundasang, and Kampung Dumpiring, are largely situated within regions classified as high to very high susceptibility, reflecting elevated exposure to landslide hazards.
The highest concentration of high to very high landslide susceptibility is observed around the Bundu Tuhan area, primarily due to its complex geological framework and past geomorphic processes. These conditions have resulted in steep slopes at high elevations, making the area inherently prone to landslides. The Crocker Formation is highly jointed, the Trusmadi Formation consists of argillaceous slopes altered by regional metamorphism, and the Pinosouk Gravel comprises loosely packed colluvial and residual soils. These geological characteristics, combined with uncontrolled land use activities, further increase the region's vulnerability.
In contrast, areas with very low to low susceptibility, where only 107 landslides were recorded, are typically characterized by gentler slopes and more stable terrain, requiring minimal intervention. On the other hand, moderate to very high susceptibility zones show significantly higher landslide frequencies, especially in steep, elevated areas. The moderate class recorded 172 landslides, while the high and very high categories accounted for 285 landslides combined, indicating a critical need for continuous monitoring and slope risk mitigation.
To safeguard local communities, particularly those in Bundu Tuhan and its surroundings, development and land use activities should be restricted, and immediate slope stabilization measures must be implemented to minimize the risk and impact of future landslides.
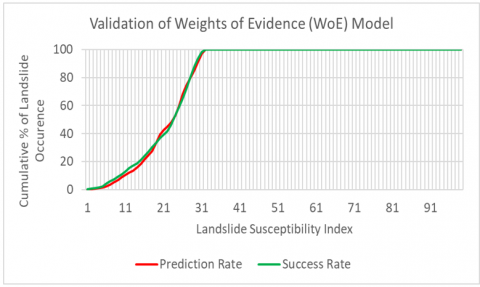
For model validation (Figure 12), the landslide susceptibility map was evaluated against the landslide inventory using the Area Under the Curve (AUC) approach. The calculated AUC values indicate a success rate of 78.15 percent and a prediction rate of 77.9 percent. Since both values fall within the acceptable reliability range of 0.7 to 0.8, the model demonstrates fair predictive capability and is deemed suitable for application in the study area.
Figure 12. Model validation using AUC curve
This study developed a detailed landslide susceptibility map for the Pekan Nabalu to Kundasang corridor using the Weights of Evidence (WoE) model, incorporating eight key causative factors. Slope curvature, slope angle, soil series, and proximity to drainage were identified as the most influential variables affecting landslide distribution, supported by both statistical results and field validation.
The resulting susceptibility map, classified into five categories from Very Low to Very High, provides an essential spatial tool for local slope hazard assessment. High and very high susceptibility zones, particularly in Bundu Tuhan and Kundasang, should be prioritized for immediate slope stabilization, reforestation, and stricter construction control. The map is suitable for guiding development restrictions, infrastructure planning, and disaster preparedness initiatives by agencies such as PLANMalaysia, JKR, JPBBD, and local district councils.
Furthermore, the findings support the integration of this susceptibility model into early warning systems, Environmental Impact Assessments (EIA), and site-specific risk assessments for future development proposals. The study demonstrates how GIS-based WoE analysis, when combined with high-resolution spatial data and ground verification, can serve as a cost-effective decision-support tool for landslide hazard management in other similar mountainous regions of Sabah and Southeast Asia.
The authors would like to express their sincere appreciation to Universiti Malaysia Sabah (UMS) for the opportunity to carry out this study through laboratory analysis and fieldwork support. Financial support from UMS research grants SDK0130-2020, GUG0587-1/2023, GUG0586-1/2023, and GUG06701-2/2024 is gratefully acknowledged.
[1] Sharir, K., Simon, N., Roslee, R. (2018). The influence of landslides parameters contributing to runout zones using GIS-based empirical model in Kundasang, Sabah. ASM Science Journal, 11(3): 254-266.
[2] Simon, N., Azlan, N.N.N., Roslee, R., Hussein, A., Ern, L.K., Sharir, K. (2017). Physical soil characterization on stable and failed slopes of the Ranau-Tambunan Road, Sabah, Malaysia. Nature Environment and Pollution Technology, 16(2): 659-665.
[3] Taharin, M.R., Roslee, R., Amaludin, A.E. (2018). Geotechnical characterization in hilly area of Kundasang, Sabah, Malaysia. ASM Science Journal, 11(Special Issue 2 for SANREM – Natural Resources): 124-131.
[4] Simon, N., Crozier, M., de Roiste, M., Rafek, A.G., Roslee, R. (2015). Time series assessment on landslide occurrences in an area undergoing development. Singapore Journal of Tropical Geography, 36(1): 98-111.
[5] Roslee, R., Jamaluddin, T.A., Talip, M.A. (2012). Landslide susceptibility mapping (LSM) at Kota Kinabalu, Sabah, Malaysia using factor analysis model (FAM). Journal of Advanced Science and Engineering Research, 2: 80-103.
[6] Sharir, K., Lai, G.T., Simon, N., Ern, L.K., Madran, E., Roslee, R. (2022). Debris flow susceptibility analysis using a bivariate statistical analysis in the Panataran River, Kg Melangkap, Sabah, Malaysia. IOP Conference Series: Earth and Environmental Science, 1103(1): 012038. https://doi.org/10.1088/1755-1315/1103/1/012038
[7] Roslee, R., Sharir, K., Lai, G.T., Simon, N., Ern, L.K., Madran, E., Saidin, A.S. (2022). Application of Analytical Hierarchy Process (AHP) for landslide hazard analysis (LHA) in Kota Kinabalu area, Sabah, Malaysia. IOP Conference Series: Earth and Environmental Science, 1103(1): 012031. https://doi.org/10.1088/1755-1315/1103/1/012031
[8] Roslee, R., Jamaluddin, T.A., Talip, M.A. (2011). Application of GIS in landslide risk assessment (LRA): A case study of the Kota Kinabalu area, Sabah, Malaysia. Bulletin of the Geological Society of Malaysia, 57: 69-83.
[9] Roslee, R., Tongkul, F., Daud, A.K.T., Simon, N. (2019). Application of Analytical Hierarchy Process (AHP) and Factor Analysis Model (FAM) for landslide susceptibility analysis (LSA) at Kota Kinabalu area, Sabah, Malaysia. ASM Science Journal, 11(3): 18-30.
[10] Roslee, R. (2019). Landslide risk management (LRM): Towards a better disaster risk reduction (DRR) programme in Malaysia. ASM Science Journal, 12(Special Issue 3): 70-81.
[11] Joe, E., Tongkul, F., Roslee, R., Sharir, K. (2019). Behaviour of channelised debris flow in the Crocker Range of Sabah, Malaysia: A case study at Ulu Moyog, Penampang. ASM Science Journal, 12(Special Issue 3): 53-59.
[12] Tating, F.F., Hack, R., Jetten, V. (2015). Landslide susceptibility assessment using information value statistical method: A case study on Northern Kota Kinabalu, Sabah. Malaysian Journal of Remote Sensing & GIS, 4(2): 92-109.
[13] Azlan, N.N.N., Simon, N., Hussin, A., Roslee, R., Ern, L.K. (2017). Chemical properties characterization of failed slopes along the Ranau-Tambunan Road, Sabah, Malaysia. Sains Malaysiana, 46(6): 867-877. https://doi.org/10.17576/jsm-2017-4606-05
[14] Rahim, I.A., You, K.L., Salleh, N.M. (2017). Kampung Mesilou landslide: The controlling factors. Geological Behaviour, 1(1): 19-21. https://doi.org/10.26480/gbr.01.2017.19.21
[15] Collenette, P. (1958). The geology and mineral resources of Jesselton – Kinabalu area, North Borneo. British Borneo Geological Survey Memoir, 6.
[16] Guzzetti, F., Carrara, A., Cardinali, M., Reichenbach, P. (1999). Landslide hazard evaluation: A review of current techniques and their application in a multi-scale study, Central Italy. Geomorphology, 31(1-4): 181-216. https://doi.org/10.1016/S0169-555X(99)00078-1
[17] Glade, T., Crozier, M.J. (2005). The nature of landslide hazard impact. In Glade, T., Anderson, M., & Crozier, M. (Eds.), Landslide Hazard and Risk, pp. 3-74.
[18] Bonham-Carter, G.F. (1994). Geographic information system for geoscientists: Modelling with GIS. Computer Methods in the Geosciences, 13: 398.
[19] Chung, C.J.F., Fabbri, A. (1999). Probabilistic prediction models for landslide hazard mapping. Photogrammetric Engineering and Remote Sensing, 65(12): 1389-1399.
[20] Mohamad, Z., Chow, W.S. (2003). Geological terrain mapping in Cameron Highlands District, Pahang. Bulletin of the Geological Society of Malaysia, 46: 69-73.
[21] Highland, L., Bobrowsky, P. (2008). The Landslide Handbook – A Guide to Understanding Landslides: A Landmark Publication for Landslide Education and Preparedness. U.S. Geological Survey Circular, 1325.
[22] Cellek, S. (2021). The effect of aspect on landslide and its relationship with other parameters. In Landslides, pp. 13-30.
[23] Sharir, K., Roslee, R., Ern, L.K., Simon, N. (2017). Landslide factors and susceptibility mapping on natural and artificial slopes in Kundasang, Sabah. Sains Malaysiana, 46(9): 1531-1540. http://doi.org/10.17576/jsm-2017-4609-23
[24] Mandal, B., Mandal, S. (2016). Assessment of mountain slope instability in the Lish River basin of Eastern Darjeeling Himalaya using Frequency Ratio Model (FRM). Modeling Earth Systems and Environment, 2(3): 121. https://doi.org/10.1007/s40808-016-0169-8
[25] Lee, S., Talib, J.A. (2005). Probabilistic landslide susceptibility and factor effect analysis. Environmental Geology, 47: 982-990. https://doi.org/10.1007/s00254-005-1228-z
[26] Akgun, A., Turk, N. (2011). Mapping erosion susceptibility by multivariate statistical method: A case study from the Ayvalik region. Environmental Earth Sciences, 37(9): 1515-1524. https://doi.org/10.1016/j.cageo.2010.09.006
[27] Roslee, R., Jamaluddin, T.A. (2012). Landslide hazard vulnerability (LHV): Review of literature and a proposed new approach in landslide risk management for Malaysia. Bulletin of the Geological Society of Malaysia, 58: 75-88.
[28] Prabu, P., Rajagopalan, B. (2013). Mapping of lineaments for groundwater targeting and sustainable water resource management in hard rock hydrogeological environment using RS-GIS. In Climate Change and Regional/Local Responses, 235-247. https://doi.org/10.5772/55702
[29] Kanungo, D.P., Arora, M.K., Sarkar, S., Gupta, R.P. (2009). Landslide susceptibility zonation (LSZ) mapping—A review. Journal of South Asia Disaster Study, 2(1): 81-105.
[30] Department of Agriculture Malaysia. (2015). Land use Map of Sabah.
[31] Department of Mineral and Geoscience Malaysia. (2015). Geological Map of Sabah.
[32] Roslee, R., Tahir, S., Musta, B., Omang, S.A.K. (2010). Geological inputs for landslide hazard identification (LHI) in the Trusmadi Formation slopes, Sabah, Malaysia. Borneo Science, 26: 37-51.
[33] British Government’s Overseas Development Administration (Land Resources Division). (1974). National Soil Maps. Tuaran. The Soils of Sabah. Sheet NB 50-6. D.O.S. 3180B.
[34] Jiang, H., Wang, B., Inyang, H.I., Liu, J., Gu, K., Shi, B. (2013). Role of expansive soil and topography on slope failure and its countermeasures, Yun County, China. Engineering Geology, 152(1): 155-161. https://doi.org/10.1016/j.enggeo.2012.10.020