Sahar Mundher Resen*![]() | Abdulhussain A. Abbas
| Abdulhussain A. Abbas![]() | Zuhal A. Hamza
| Zuhal A. Hamza![]()
© 2025 The authors. This article is published by IIETA and is licensed under the CC BY 4.0 license (http://creativecommons.org/licenses/by/4.0/).
OPEN ACCESS
In response to escalating water demand and the depletion of natural freshwater resources, the strategic identification of suitable sites for rainwater harvesting (RWH) has emerged as a sustainable approach to mitigate water scarcity and flood risks in arid and semi-arid regions. In this study, a geospatially integrated multi-criteria decision analysis (MCDA) was conducted to delineate optimal RWH zones within the Wadi Sarkhar watershed, located in Wasit, Iraq. A total of eleven critical factors—encompassing hydrological, topographical, climatic, land use, and infrastructural parameters—were selected based on their relevance to runoff generation and storage potential. This included Stream of seventh order, Runoff, slope, Stream of sixth order, rainfall, land cover, soil type, Stream of fifth order, Evaporation, Population places, and roads. Weights were assigned to each criterion using the analytic hierarchy process (AHP), and the pairwise comparison matrix yielded a consistency ratio (CR) of 0.012, which is significantly below the accepted threshold of 0.1, indicating strong internal consistency. Spatial analysis and overlay operations were performed using ArcGIS 10.8, with the Raster Calculator employed to synthesize a final suitability map categorized into five classes: very high, high, moderate, low, and very low suitability. Results indicated that approximately 34.33% of the watershed area (435.14 km²) was classified as having very high, high, and medium suitability for RWH interventions, while the remaining 65.67% (834.41 km²) was deemed less favourable. A sensitivity analysis was also carried out to assess the robustness of the model by adjusting the weights of dominant criteria, confirming the model’s resilience and reliability. The findings offer a robust spatial planning framework to inform policymakers, environmental engineers, and water resource managers in the development of region-specific RWH strategies that enhance water availability, reduce flood risk, and contribute to long-term ecological resilience.
Wadi Sarkhar watershed, rainwater harvesting (RWH), geographic information systems (GIS), multi-criteria decision analysis (MCDA), analytic hierarchy process (AHP), remote sensing (RS), suitability modelling
Water is vital for human welfare, societal development, agricultural productivity, and environmental sustainability. Other fundamental human rights, such as the rights to food, health, and life, are also closely linked to the right to obtain clean water. Worldwide, the amount of available water is diminishing along with the absence of precipitation and its irregular distribution and temporal distribution [1]. Water shortages and climate change are significant worldwide issues [2]. The shortage of fresh water is a major issue in many areas, especially developing countries [3]. Aside from continuous surface and groundwater contamination, other factors that will worsen future freshwater scarcity and shortages include accelerated climate change, population growth, intensified agricultural practices, and industrial expansion [4]. RWH could be a viable, sustainable, and appropriate substitute water source for various activities [5]. Surface runoff could be efficiently captured by harvesting. Additionally, it is a mechanism that collects precipitation around the catchment’s perimeter instead of releasing it as runoff [6]. Data from Geographic Information Systems (GIS) with remote sensing (RS) combined might be useful for identifying prospective water harvesting locations. Multi-criteria decision problems often involve several potential alternatives that are assessed according to particular criteria. MCDA based on GIS is a method that combines spatial data to provide a comprehensive evaluation of the decision alternatives [7]. The multi-criteria evaluation (MCE) method based on GIS is the most effective site suitability assessment method. The site appropriateness model is created using the GIS technique by creating various criteria maps [8, 9]. GIS has demonstrated effectiveness and is regarded as a reliable scientific instrument for handling massive amounts of multi-spatial data [10, 11]. One method of multi-criteria analysis is the AHP. To choose the best areas for collecting water, many researchers now rely on GIS and AHP when applying location considerations and multiple environmental criteria [12]. Choosing sites using a mix of GIS and AHP methodologies has produced highly accurate results [13]. AHP and multi-criteria decision-making (MCDM) are valuable techniques for determining suitable locations for RWH facilities, particularly in arid or semi-dry places. A subset of operations research known as MCDM evaluates decision-making scenarios with several conflicting criteria. It has attracted global interest due to technological developments allowing quick computation and handling [14]. The strategies for MCDM vary depending on the complexity of the criteria and the degree of ambiguity in the process of making decisions. Although AHP is a popular method for comparing criteria pairwise and aiding in prioritization, it is prone to prejudice and changes when inputs are altered in ranking [15]. The AHP, developed by Saaty and Thomas, is often utilized to allocate exact weights to the criteria that influence RWH location selection. It is a simple, effective, reliable, and cost-effective method widely used in various fields, including resource distribution, urban redevelopment plans, water supply management, and site suitability assessment [16, 17]. Iraq has erratic precipitation patterns, primarily in dry to semi-arid zones [5]. Owing to the Tigris and Euphrates rivers that pass through it, Iraq was considered to have abundant water supplies until 1970 [18]. Water scarcity became a serious issue in Iraq due to years of war, water regulations, and administrative shortages. Furthermore, much of its water flows straight into the Gulf [19]. As a result, water harvesting is a potential method that is capable of efficiently capturing surface runoff, meeting various water demands, and reducing the effects of drought [20]. The present study aims to ascertain the best sites for rainwater collection in the Wadi Sarkhar watershed, Wasit province, Iraq, so that RWH systems can be implemented to alleviate water scarcity issues. This study included eleven layers: stream of seventh order, runoff, slope, stream of sixth order, rainfall, land cover, soil type, stream of fifth order, evaporation, population places, and roads. In addition, expert opinions, physical and socioeconomic factors were considered, and the best places for the study region were determined using GIS with AHP. This study is significant because identifying water-harvesting areas in Wadi Sarkhar would aid in improving water management, which will ultimately benefit the ecosystem. Therefore, the approach suggested employing available data is anticipated to provide direction for those making decisions on the management of the water resources in the area.
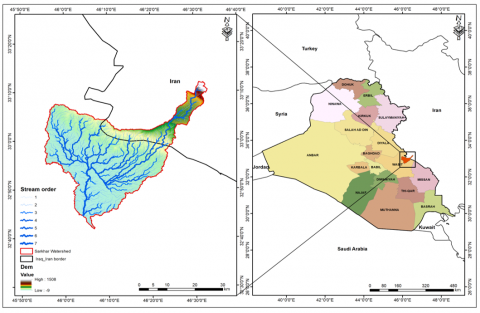
The region is located between longitudes (45° 55' 00" – 46° 34' 00”) and latitudes (32° 42' 00" - 33° 12' 00"), in the Wasit Governorate, notably near its eastern border, limited between the watersheds of the Galal Badra River in the northern region and the Al-Chabbab River in the south. With an estimated extent of 1269.55 km2, the Wadi Sarkhar watershed is a transboundary watershed between Iraq and Iran, with an elevation varying from 1501 meters in Iran's mountainous region to 14 meters in the drainage areas of the Hor Ash Shwaicha. Wadi Sarkhar's headwaters are in the Pashtakuh mountain ranges, and it describes a seasonal valley where water flows through periods of intense rainstorms, but in other seasons the weather is dry [21], see Figure 1.
Figure 1. The study area’s location
Choosing the right location for RWH regions can be broken into four phases as described below:
• Data collection.
•Selecting a group of criteria.
• Determining the appropriateness and corresponding weight of every criterion.
• Opting to utilize an MCA approach to theme maps by GIS model building analysis to create a suitability map for selecting the best RWH locations.
3.1 Dataset collection
Collecting a spatial information set is a crucial stage in constructing a GIS model [19]. This study employed a variety of datasets, which were analyzed using ArcGIS version 10.8. The Universal Transverse Mercator (UTM) system was used to georeference all thematic layers in zone 38 N, WGS 84. The study employed maps made from diverse datasets, as demonstrated in Table 1.
Table 1. Description of data sources
|
Criteria |
Source |
|
Stream order |
Digital elevation models (DEM) from Alaska Satellite, 12.5 m resolution (https://asf.alaska.edu/) |
|
Slope |
|
|
Annual rainfall |
Satellite-based climate data depending on NASA POWER (https://power.larc.nasa.gov/data-access-viewer/) and (https://ldas.gsfc.nasa.gov/gldas) |
|
Evaporation |
|
|
Soil type |
The Digital Soil Map of the World, FAO/UNESCO (https://data.apps.fao.org/map/catalog/srv/search?keyword=DSMW) |
|
Land use |
European Space Agency GlobCover Portal (https://due.esrin.esa.int/page_globcover.php) |
|
Runoff |
Rainfall data, a soil type map, and land cover were utilized to calculate the runoff depth |
|
Population centers and roads |
Open Street Map, available at (https://www.openstreetmap.org/) |
3.2 Criteria selection
The Food and Agriculture Organization (FAO) has determined six critical factors for selecting water harvesting sites: topography, climate, soils, agronomy, hydrology, and socioeconomics [22, 23]. All criteria were chosen after a thorough examination of the literature and in accordance with FAO recommendations and expert opinions for optimal RWH regions. This study employed eleven layers: "Stream of seventh order, Runoff, slope, Stream of sixth order, rainfall, land cover, soil type, Stream of fifth order, Evaporation, Population places, and roads". The spatial data layers were subsequently analyzed using the ArcGIS 10.8 Spatial Analysis Tool for the research region. These layers were combined to discover eligible RWH sites based on the selection criteria.
3.2.1 Digital Elevation Model (DEM)
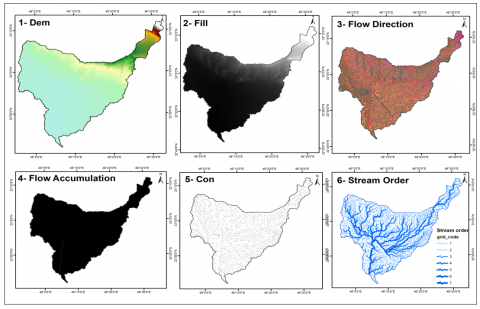
NASA’s Alaska Satellite Facility (ASF) provided the ALOSPALSAR DEM, which has a spatial resolution of 12.5 meters (https://search.asf.alaska.edu). The DEM is used to extract the hydrological features of the research region and examine the Earth’s surface topography, which is one of the most significant spatial analyses [24]. Stream order analysis is vital for determining acceptable study locations for RWH [25]. Higher-order streams have lesser permeability and capability for infiltration, while lower-order streams have greater [26]. The basic hydrological analysis processes involve filling sinks in the DEM, identifying the flow direction, producing the flow accumulation raster, con, and then calculating the stream order within Arc Map 10.8 software. The map of stream order was created according to the DEM; the research region has the seventh drainage order, as seen in Figure 2.
Figure 2. Processing stages of the DEM for stream order determination
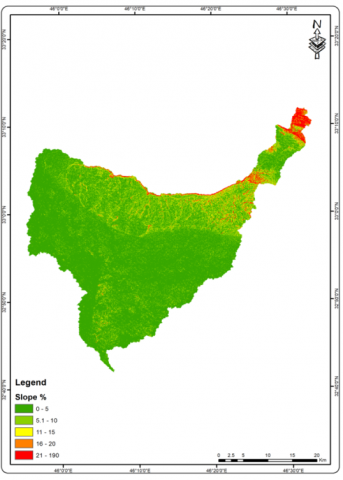
Additionally, the slope map is made using DEM data. Average slope is a separate variable that provides information on topography. The mean slope significantly impacts the time of concentration and, consequently, the runoff created by rainfall [19]. RWH is not advisable for slopes exceeding 5% because of uneven runoff distribution and susceptibility to severe erosion [27, 28]. Figure 3 displays the slope map, which has been divided into five groups.
Figure 3. Slope map
3.2.2 Climate data from satellites
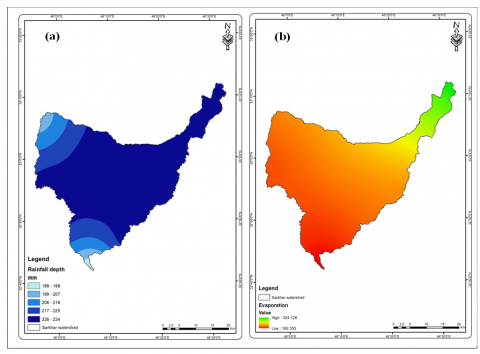
Climate data (Rainfall and Evaporation) from 2000 to 2022, derived from satellite data, were obtained from NASA and processed in ArcGIS 10.8. Rainfall is the most essential determinant of suitable water harvesting. It is necessary for an extensive harvesting infrastructure [29]. In addition to being the most crucial factor in water harvesting mapping, precipitation constitutes the foundation of the catchment and recharging source [18]. It directly and indirectly affects most other planning criteria for water harvesting in dry and semi-arid regions. The annual rainfall depth minimum and maximum in the study region are 189mm and 234mm, respectively. The map in Figure 4(a) shows the five zones of rainfall. Moreover, a major contributor to water loss impacting the RWH process is evaporation from the Earth’s surface. A low rate of evaporation indicates a suitable site for harvesting water [30]. The maximum value was 324.128, whereas the minimum value was 162.355, as seen in Figure 4(b).
Figure 4. (a) Annual rainfall depth map, (b) Evaporation map
3.2.3 Soil type
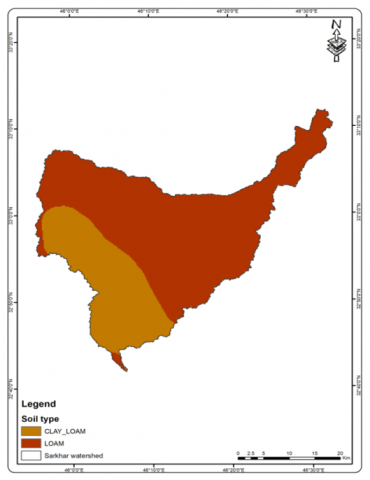
Runoff potential, soil water storage capacity, and percolation and infiltration rates are all impacted by the type and depth of the soil [31]. It is an essential factor in the planning and assessment of the reliability of water harvesting technologies [29]. Soil suitability is important for selecting water-harvesting sites and regulates the normal hydrological response [18]. Because of their higher water-holding capacity, medium and fine soil textures that are soil textures are usually preferred for water harvesting [32]. The general soil properties were determined utilizing the Digital Soil Map of the World (DSMW), FAO/UNESCO [33]. This data is adopted by the United Nations FAO. Figure 5 shows the soil type.
Figure 5. Soil types map
3.2.4 Land cover
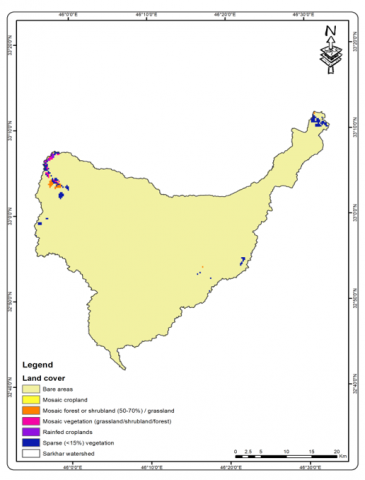
A critical criterion for water-harvesting procedures is the usage of land cover. It may impact a catchment’s streams’ hydrological response, which will sensitively influence runoff [5]. Low runoff and a high percentage of infiltration are closely related and cover [29]. Land use is a significant factor in selecting and executing water-harvesting methods [34]. Figure 6 illustrates the land cover map.
Figure 6. Map of land cover /use
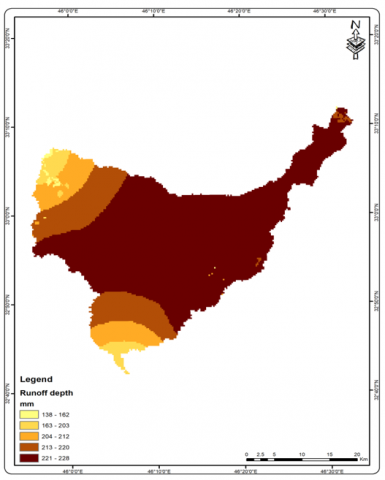
3.2.5 Runoff depth
Runoff depth is a critical hydrological component in identifying the optimal location for RWH and is given one of the highest weights in the RWH criteria [35]. Spatial data on runoff depth is utilized to determine the minimal volume of water from surface runoff during the rainy season. Higher runoff depth locations are preferred over lower runoff depth regions for installing RWH systems [36]. Typical methods for calculating runoff depth include the rational method and the soil conservation service curve number (SCS-CN) [37]. This study used the SCS approach to ascertain the runoff depth in the study area based on rainfall data, soil type, and land cover/land use. It is based on empirical data, making it accurate and dependable for catchments of moderate to large sizes. The SCS-CN approach is frequently utilized because it produces consistent results in various contexts, is backed by easily accessible data, and has adaptable parameters that increase its usefulness. Established by the USDA in 1972, the SCS-CN technique is often utilized as an accurate and efficient method for predicting surface runoff. The SCS approach may then be used to determine runoff depth using Eq. (1) [38]:
$Q=\frac{\left(P-I_a\right)^2}{\left(P-I_a\right)+S}$ (1)
where, $Q$ represents runoff depth $(\mathrm{mm})$, $P$ denotes rainfall $(\mathrm{mm}), S$ signifies potential maximum retention after the start of runoff $(\mathrm{mm})$, and $I_a$ represents the initial abstraction in millimeters, where it is equivalent to $0.2 S$. $S$ indicates maximum possible retention $(\mathrm{mm})$ after runoff begins:
$S=\frac{25400}{C N}-254$ (2)
CN is a numerical value derived from the runoff curve, ranging from 0 to 100, and depicts the degree of the runoff reaction from a particular precipitation event; an elevated CN value implies a lot of runoff in the area. The possible runoff depth of the research region was separated into five zones, as indicated in Figure 7.
Figure 7. Runoff depth map
3.2.6 Population centers and roads
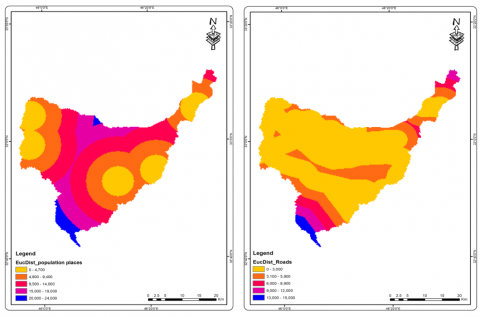
The traditional FAO technique has been refined by involving additional spatial criteria such as distance to roadways and population centers, which are crucial in assessing the accessibility and sustainability of rainwater collection systems. These additions increase site appropriateness accuracy by considering critical logistical and social elements influencing project success. The locations of proposed water harvesting must be readily available for maintenance, use, and construction. But they ought to be a fair distance from the major thoroughfares. The likelihood of surface water contamination may rise in areas near major roadways [13]. The population centers and road maps were created using OpenStreetMap data. The Euclidean distance function calculates the distance between population centers and roads. The direct distance between two locations on a plane is known as Euclidean distance [19], as seen in Figure 8.
Figure 8. Euclidean distance to Population centers and roads
3.3 AHP
The AHP is a flexible and easy-to-use method for evaluating the suitability of RWH by considering literature reviews and expert opinions. It provides a rational basis for critical decision-making by quantifying impossible-to-assess possibilities and intangibles numerically [39]. Saaty created the AHP approach, which uses a reciprocal decision matrix to assign criteria to different levels and determine the proportionate significance of every criterion. This approach simplifies the decision-making process by offering a methodical structure for group discussions and helping decision-makers identify points of agreement and disagreement when assessing the relative relevance of different criteria. The AHP establishes the typical weights of variables through comparing pairs, allowing decision-makers to make good use of subjective knowledge and experience [40]. The AHP uses these procedures to calculate each criterion’s weight [26]:
The pairwise comparison strategy was utilized in the current study as a first step to establishing the weight of the criteria, considering their respective importance. The present technique entails comparing pairs to generate the ratio matrix that ranks every criterion according to its relative significance to the others. Saaty’s basic scale provides each variable a value ranging from 1-9. A score of 9 indicates great importance, whereas a score of 1 indicates equal significance. As shown in Table 2, the elements under comparison were separated into five groups, with odd numbers denoting equally to highly significant factors and even numbers denoting values that fell in between [41].
Table 2. Saaty’s intensity scale of importance for paired comparisons and the AHP method [41]
|
No. |
Definition of Intensity of Importance |
|
1 |
Equal importance |
|
3 |
Moderate importance of one over another |
|
5 |
Strong or essential importance |
|
7 |
Very strong or demonstrated importance |
|
9 |
Extreme importance |
|
2, 4, 6, 8 |
Intermediate values |
|
1.1-1.9 |
When activities are very close, a decimal is added to 1 to show their difference as appropriate |
To verify weights generated in the prior phase based on the RWH standards, the CR was established, as recommended by Saaty [41, 42]. The CR was utilized to measure the accuracy of the pairwise comparison. The CR was utilized to determine the relative significance of every criterion. Consistency ratios are calculated by dividing the consistency index (CI) by the random index (RI) [43]. A CR of less than 10% implies that comparing the factors was deemed appropriate [44].
$C R=\frac{C I}{R I}$ (3)
The consistency vector (ʎ) and number criteria (n) are employed to compute the CI.
$C I=\frac{ʎ-n}{n-1}$ (4)
RI represents the RI value that changes according to the number of criteria applied. The RI used in Table 3 depends on the categorization of Saaty [41, 42].
Table 3. Random index for varying numbers of criteria [41, 42]
|
n |
1 |
2 |
3 |
4 |
5 |
6 |
7 |
8 |
9 |
10 |
11 |
12 |
13 |
14 |
15 |
|
RI |
0.00 |
0.00 |
0.52 |
0.89 |
1.11 |
1.25 |
1.35 |
1.40 |
1.45 |
1.49 |
1.52 |
1.54 |
1.56 |
1.58 |
1.59 |
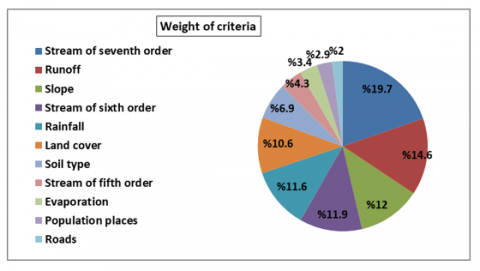
Eleven criteria were used in this study; therefore, the RI value is 1.52. Our AHP matrix’s CR is 0.0120. The study’s criterion weight is acceptable, since the CR is below 0.1. Table 4 shows the (11×11) pairwise comparison matrix of AHP, where the criteria selected for model input were based on the degree of effect and relative relevance. Figure 9 displays the weight percentages for each criterion, with the 7th-stream order receiving a larger weight than rainfall due to its critical role in the basin’s hydrological response. Higher-order streams have larger flow accumulation and play a substantial role in runoff concentration, making them ideal locations for RWH structures. This explains their comparatively greater weighting in the analysis.
Table 4. Pairwise comparisons
|
Factor |
"Stream of Seventh Order" |
Runoff |
Slope |
"Stream of Sixth Order" |
Rainfall |
Land Cover |
Soil Type |
"Stream of Fifth Order" |
Evaporation |
Population Places |
Roads |
|
"Stream of Seventh Order" |
1 |
1 |
2 |
2 |
2 |
2 |
4 |
4 |
5 |
6 |
7 |
|
Runoff |
1 |
1 |
2 |
1 |
1 |
1 |
3 |
3 |
4 |
4 |
6 |
|
Slope |
0.5 |
0.5 |
1 |
1 |
1 |
1 |
2 |
3 |
5 |
5 |
6 |
|
"Stream of Sixth Order" |
0.5 |
1 |
1 |
1 |
1 |
1 |
2 |
3 |
4 |
4 |
5 |
|
Rainfall |
0.5 |
1 |
1 |
1 |
1 |
1 |
2 |
3 |
3 |
4 |
5 |
|
Land Cover |
0.5 |
1 |
1 |
1 |
1 |
1 |
2 |
2 |
3 |
4 |
5 |
|
Soil Type |
0.25 |
0.333 |
0.5 |
0.5 |
0.5 |
0.5 |
1 |
2 |
2 |
3 |
4 |
|
"Stream of Fifth Order" |
0.25 |
0.333 |
0.33 |
0.333 |
0.333 |
0.5 |
0.5 |
1 |
1 |
2 |
2 |
|
Evaporation |
0.2 |
0.25 |
0.20 |
0.25 |
0.333 |
0.333 |
0.5 |
1 |
1 |
1 |
2 |
|
Population Places |
0.167 |
0.25 |
0.20 |
0.25 |
0.25 |
0.25 |
0.333 |
0.5 |
1 |
1 |
2 |
|
Roads |
0.14 |
0.167 |
0.167 |
0.2 |
0.2 |
0.2 |
0.25 |
0.5 |
0.5 |
0.5 |
1 |
Figure 9. Weights of the criteria layers
3.4 GIS model building
A weighted linear combination procedure may be used to create a map of permitted zones for RWH, once the criteria are specified, classified, and given weights according to the various layers. The first step is to use the reclass function in the spatial analysis tools of ArcMap 10.8 to convert the criteria layers from vector format to raster. In the second step, the eleven thematic raster layers are merged with the Map Algebra and Raster Calculator tools found in ArcMap 10.8 spatial analysis features. The model uses the average weighted technique to extract the Suitability Degree map, which is calculated by multiplying each cell's values layer by the variable weight from AHP, then adding up the weighted values of cells, as shown in Eq. (5) [29]:
$S=\sum w_i * x_i$ (5)
where, S represents a suitable region, $w_i$ denotes the weight of criterion i, and $x_i$ is the membership and value of criteria i.
4.1 Possible RWH map based on AHP and WLC
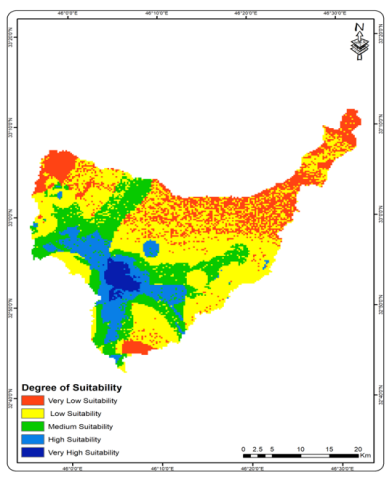
Depending on the features of the watershed, choosing viable sites for RWH is crucial to optimizing water supply and recharge. The WLC approach was created by combining multi-criteria assessment using GIS based on an AHP statistical method, accounting for 11 layers, to provide a map displaying the best water harvesting suitability. Five categories of themed maps were identified based on their suitability for water harvesting: very low, low, moderate, high, and very high, as seen in Figure 10.
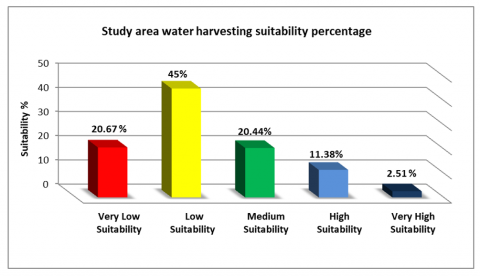
The results indicate that low suitability has the largest percentage at 45% (571.93 km2), followed by Very Low Suitability at 20.67% (262.48 km²), and Medium Suitability at 20.44% (259.47 km²), which is slightly less than the Very Low Suitability, however, High Suitability and Very High Suitability covers 11.38% (144.51 km2), 2.51% (31.16 km2), as seen in Figure 11.
Figure 10. The degree of appropriateness and potential areas for harvesting water
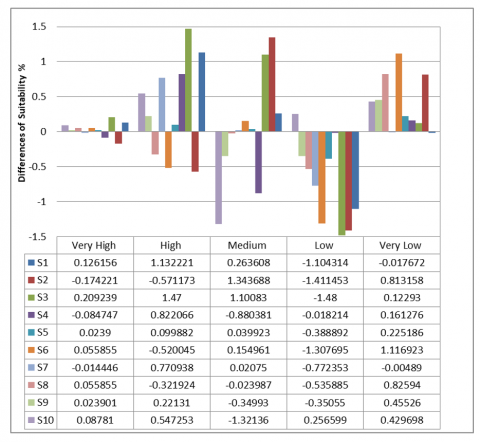
4.2 Sensitivity analysis
Sensitivity analysis evaluates the efficacy of a decision model in identifying appropriate rainwater collecting sites. Furthermore, this aims to determine how responsive the alternatives’ ranking is to alterations in the significance of the criterion [45]. A sensitivity analysis was carried out by adjusting the weights of the five most influential criteria (stream of seventh order, Runoff, Slope, Stream of sixth order, and Rainfall) by ±10%. This procedure created ten scenarios (S1 to S10) in which the impact of increasing or reducing the weight of each selected criterion was assessed separately while the other criteria remained constant, as illustrated in Figure 12. This analysis evaluated how these variations affect every criterion within the distribution of the five appropriateness classifications: Very Low, Low, Medium, High, and Very High. The results of these scenarios revealed a high level of model stability. The variations in suitability percentage distribution were minor across all 10 scenarios. The “Very High” category was the least sensitive to weight changes, with a range of -0.17% (S2) to +0.21% (S3). The “High” category had minor changes, such as +1.13% in S1 and +1.47% in S3, but stayed within acceptable boundaries. Similarly, the “Medium” group witnessed most fluctuations within ±1.5%, with the most noticeable being +1.34% in S2 and -1.32 % in S10. These findings illustrate the model’s ability to maintain consistent classifications in reasonably appropriate environments. The “Low” and “Very Low” categories showed slightly larger variations in some scenarios (e.g., “Low”: -1.48% in S3, “Very Low”: +1.11% in S6). Still, these changes did not substantially alter the overall suitability pattern or affect the model’s decision-support capability. The sensitivity analysis study shows that the model is not unduly sensitive to ±10% changes in the weights of the most significant criterion. The slight variance across scenarios S1-S10 increases confidence in the model’s resilience. It supports its deployment as a dependable spatial decision-support tool for the identification of rainwater collecting sites within the Sarkhar watershed.
Figure 11. The proportion of water harvesting suitability in the study area
Figure 12. Sensitivity analysis test results and indications
The study is carried out on a sizable, significant watershed in Iraq, and given its land, topography, and annual rainfall rates, the Wadi Sarkhar Watershed seems to be one of the most promising and appropriate locations for the installation of different RWH systems. The study used the suitability model obtained from ArcGIS 10, utilizing RS- and GIS-based multi-criteria, and the AHP tool to identify possible water harvesting locations. The spatial distribution of ideal RWH locations for the research region was determined using eleven weighted criteria, and this study also attempts to include biophysical and socioeconomic factors in selecting appropriate water harvesting locations. According to the study, a multi-criteria GIS-based approach may provide an integrated model that effectively accomplishes the study’s aims. A suitability map was produced for five groups: very high, high, moderate, low, and very low. The findings of this study indicated that the Sarkhar Wadi basin area has substantial potential for RWH, with the most appropriate locations in the middle and southwestern regions. The suitability map created for this study helps hydrologists, planners, and decision-makers find the best places to build RWH structures quickly. Additionally, it facilitates the creation of efficient strategies for the distribution of resources and sustainable water management. By identifying these appropriate places, the study promotes harvesting rainwater as a dependable alternate source of water in the study area and other water-scarce regions. The research findings may be utilized in practical projects to improve water resource management, such as supporting sustainable agriculture, increasing groundwater recharge, and lowering dependency on conventional water sources, thereby improving water security in the region. Furthermore, these results might feed into government and community development strategies focused on tackling water shortage issues in arid and semi-arid locations. Future studies are recommended to confirm the quality and reliability of drone-based aerial images to ensure credible spatial data for water resource assessments. Furthermore, combining the Soil and Water Assessment Tool (SWAT), a model with present results, is crucial to improve hydrological evaluation and create more sustainable and efficient water management techniques in the Sarkhar Wadi basin. Through this integration, complicated hydrological processes will be better understood, and informed decision-making toward sustainable water security will be supported.
[1] World Water Assessment Programme (United Nations). (2009). The United Nations World Water Development Report (No. 3). UNESCO Pub.
[2] Kumar, T., Jhariya, D.C. (2017). Identification of rainwater harvesting sites using SCS-CN methodology, remote sensing and Geographical Information System techniques. Geocarto International, 32(12): 1367-1388. https://doi.org/10.1080/10106049.2016.1213772
[3] Haile, G., Suryabhagavan, K.V. (2019). GIS-based approach for identification of potential rainwater harvesting sites in Arsi Zone, Central Ethiopia. Modeling Earth Systems and Environment, 5: 353-367. https://doi.org/10.1007/s40808-018-0537-7
[4] Alipour, M.H., Kibler, K.M., Alizadeh, B. (2020). Flow alteration by diversion hydropower in tributaries to the Salween river: A comparative analysis of two streamflow prediction methodologies. International Journal of River Basin Management, 20(1): 33-43. https://doi.org/10.1080/15715124.2020.1760289
[5] Ibrahim, G.R.F., Rasul, A., Ali Hamid, A., Ali, Z.F., Dewana, A.A. (2019). Suitable site selection for rainwater harvesting and storage case study using Dohuk Governorate. Water, 11(4): 864. https://doi.org/10.3390/w11040864
[6] Hari, D., Reddy, K.R., Vikas, K., Srinivas, N., Vikas, G. (2018). Assessment of rainwater harvesting potential using GIS. IOP Conference Series: Materials Science and Engineering, 330: 012119. https://doi.org/10.1088/1757-899X/330/1/012119
[7] Malczewski, J. (2006). GIS-based multicriteria decision analysis: A survey of the literature. International Journal of Geographical Information Science, 20(7): 703-726. https://doi.org/10.1080/13658810600661508
[8] Xu, Y., Sun, J., Zhang, J., Xu, Y., Zhang, M., Liao, X. (2012). Combining AHP with GIS in synthetic evaluation of environmental suitability for living in China's 35 major cities. International Journal of Geographical Information Science, 26(9): 1603-1623. https://doi.org/10.1080/13658816.2011.642800
[9] Abdulkareem, I., Karim, H.H., Aziz, N.A. (2019). Selecting the potential water harvesting sites using fuzzy GIS-based spatial multi-criteria evaluation in Salah Al-Din Governorate, Iraq. Engineering and Technology Journal, 37(2C): 219-226. https://doi.org/10.30684/etj.37.2C.4
[10] Al-Ahmady, K.K., Al-Jarjees, S.D. (2020). The usage of GIS for the devastated urban centers management and preservation of monuments/study case: Nabi-Jarjis district in Mosul City in Iraq. The Iraqi Geological Journal, 53(1): 57-69. https://doi.org/10.46717/igj.53.1b.4rz-2020-3-2
[11] Parkinson, S.C., Makowski, M., Krey, V., Sedraoui, K., Almasoud, A.H., Djilali, N. (2018). A multi-criteria model analysis framework for assessing integrated water-energy system transformation pathways. Applied Energy, 210: 477-486. https://doi.org/10.1016/j.apenergy.2016.12.142
[12] Alkhatib, J., Engelhardt, I., Ribbe, L., Sauter, M. (2019). An integrated approach for choosing suitable pumping strategies for a semi-arid region in Jordan using a groundwater model coupled with analytical hierarchy techniques. Hydrogeology Journal, 27(4): 1143-1157. https://doi.org/10.1007/s10040-019-01925-0
[13] Wu, R.S., Molina, G.L.L., Hussain, F. (2018). Optimal sites identification for rainwater harvesting in northeastern Guatemala by analytical hierarchy process. Water Resources Management, 32: 4139-4153. https://doi.org/10.1007/s11269-018-2050-1
[14] Bekiryazici, F. (2024). Assessing the positioning of rainwater harvesting systems in Recep Tayyip Erdoğan University campuses using multi-criteria decision-making methods. Advances in Research, 25: 48-53. https://doi.org/10.9734/air/2024/v25i11017
[15] Sabastian, R., Arun, P., Krishna, N., Faris, R. (2021). International research journal of modernization in engineering technology and science. International Research Journal of Modernization in Engineering Technology and Science, 3.
[16] Maity, D.K., Mandal, S. (2019). Identification of groundwater potential zones of the Kumari River Basin, India: An RS & GIS based semi-quantitative approach. Environment, Development and Sustainability, 21: 1013-1034. https://doi.org/10.1007/s10668-017-0072-0
[17] Noori, S., Ghasemlounia, R. (2019). A review of criteria I n rain water harvesting management. International Journal of Engineering and Natural Sciences, 2(3): 9-16.
[18] Adham, A., Sayl, K.N., Abed, R., Abdeladhim, M.A., Wesseling, J.G., Riksen, M., Fleskens, L., Karim, U., Ritsema, C.J. (2018). A GIS-based approach for identifying potential sites for harvesting rainwater in the Western Desert of Iraq. International Soil and Water Conservation Research, 6(4): 297-304. https://doi.org/10.1016/j.iswcr.2018.07.003
[19] Alwan, I.A., Aziz, N.A., Hamoodi, M.N. (2020). Potential water harvesting sites identification using spatial multi-criteria evaluation in Maysan Province, Iraq. ISPRS International Journal of Geo-Information, 9(4): 235. https://doi.org/10.3390/ijgi9040235
[20] Faisal, R.M., Abdaki, M. (2021). Multi-criteria analysis for selecting suitable sites of water harvesting in northern al tharthar watershed. Journal of Sustainability Science and Management, 16(7): 218-236. http://doi.org/10.46754/jssm.2021.10.017
[21] Manhi, H.K., Al-Kubaisi, Q.Y.S. (2021). An assessment of the suitability of Wadi Sarkhar watershed for the implementation of water harvesting projects, Wasit-Iraq. Iraqi Journal of Science and Technology, 12(2).
[22] Othman, A.A., Al-Maamar, A.F., Al-Manmi, D.A.M.A., Liesenberg, V., Hasan, S.E., Obaid, A.K., Al-Quraishi, A.M.F. (2020). GIS-based modeling for selection of dam sites in the Kurdistan Region, Iraq. ISPRS International Journal of Geo-Information, 9(4): 244. https://doi.org/10.3390/ijgi9040244
[23] Alkaradaghi, K., Hamamin, D., Karim, H., Al-Ansari, N., Ali, S.S., Laue, J., Ali, T. (2022). Geospatial technique integrated with MCDM models for selecting potential sites for harvesting rainwater in the semi-arid region. Water, Air, & Soil Pollution, 233(8): 313. https://doi.org/10.1007/s11270-022-05796-2
[24] Nabit, B.I., Al-Anbari, R.H., Alwan, I.A. (2023). Identifying suitability rainwater harvesting zones in Diyala watershed, Iraq, using multi-criteria analysis and GIS modelling. IOP Conference Series: Earth and Environmental Science, 1158(2): 022036. https://doi.org/10.1088/1755-1315/1158/2/022036
[25] Hashim, H.Q., Sayl, K.N. (2021). Detection of suitable sites for rainwater harvesting planning in an arid region using geographic information system. Applied Geomatics, 13: 235-248. https://doi.org/10.1007/s12518-020-00342-3
[26] Hassan, W.H., Mahdi, K., Kadhim, Z.K. (2025). GIS-based multi-criteria decision making for identifying rainwater harvesting sites. Applied Water Science, 15(3): 45. https://doi.org/10.1007/s13201-025-02378-5
[27] Critchley, W., Siegert, K., Chapman, C., Finket, M. (2021). Water Harvesting: A Manual for the Design and Construction of Water Harvesting Schemes for Plant Production. Scientific Publishers. https://www.scientificpubonline.com/bookdetail/water-harvesting-manual-design-construction-water harvesting-schemes-plant-production/9788172338015/0.
[28] Hatibu, N., Mahoo, H.F. (2000). Rainwater harvesting for natural resources management: A planning guide for Tanzania. Nairobi Regional Land Management Unit Kenya.
[29] Toosi, A.S., Tousi, E.G., Ghassemi, S.A., Cheshomi, A., Alaghmand, S. (2020). A multi-criteria decision analysis approach towards efficient rainwater harvesting. Journal of Hydrology, 582: 124501. https://doi.org/10.1016/j.jhydrol.2019.124501
[30] Oweis, T.Y., Prinz, D., Hachum, A.Y. (2012). Rainwater Harvesting for Agriculture in the Dry Areas. CRC Press.
[31] Prinz, D., Singh, A. (2000). Technological potential for improvements of water harvesting. Gutachten für die World Commission on Dams, technical papers, 126.
[32] Lee, K.E., Mokhtar, M., Mohd, M., Abdul, A., Badusah, J. (2016). Rainwater harvesting as an alternative water resource in Malaysia: Potential, policies and development. Journal of Cleaner Production, 126: 218- 222. https://doi.org/10.1016/j.jclepro.2016.03.060
[33] Hartemink, A.E., Krasilnikov, P., Bockheim, J.G. (2013). Soil maps of the world. Geoderma, 207: 256-267. https://doi.org/10.1016/j.geoderma.2013.05.003
[34] Shanableh, A., Al-Ruzouq, R., Yilmaz, A.G., Siddique, M., Merabtene, T., Imteaz, M.A. (2018). Effects of land cover change on urban floods and rainwater harvesting: A case study in Sharjah, UAE. Water, 10(5): 631. https://doi.org/10.3390/w10050631
[35] Ammar, A., Riksen, M., Ouessar, M., Ritsema, C. (2016). Identification of suitable sites for rainwater harvesting structures in arid and semi-arid regions: A review. International Soil and Water Conservation Research, 4(2): 108-120. https://doi.org/10.1016/j.iswcr.2016.03.001
[36] Wondimu, G.H., Jote, D.S. (2020). Selection of rainwater harvesting sites by using remote sensing and GIS techniques: A case study of Dawa Sub Basin Southern Ethiopia. Journal of Environment and Earth Science, 10(9): 24-35.
[37] Ahmed, S.O., Bilgili, A.V., Cullu, M.A., Ernst, F., Abdullah, H., Hamad, T.A., Aziz, B.S. (2023). Using geographic information systems and multi-criteria decision analysis to determine appropriate locations for rainwater harvesting in Erbil Province, Iraq. Water, 15(23): 4093. https://doi.org/10.3390/w15234093
[38] AL-Shammari, M.M.A., AL-Shamma’a, A.M., Al Maliki, A., Hussain, H.M., Yaseen, Z.M., Armanuos, A.M. (2021). Integrated water harvesting and aquifer recharge evaluation methodology based on remote sensing and geographical information system: Case study in Iraq. Natural Resources Research, 30(3): 2119-2143. https://doi.org/10.1007/s11053-021-09835-3
[39] Faisal, A.A., Taha, D.S., Hassan, W.H., Lakhera, S.K., Ansar, S., Pradhan, S. (2023). Subsurface flow constructed wetlands for treating of simulated cadmium ions-wastewater with presence of Canna indica and Typha domingensis. Chemosphere, 338: 139469. https://doi.org/10.1016/j.chemosphere.2023.139469
[40] Al-Kakey, O., Othman, A.A., Al-Mukhtar, M., Dunger, V. (2023). Proposing optimal locations for runoff harvesting and water management structures in the Hami Qeshan Watershed, Iraq. ISPRS International Journal of Geo-Information, 12(8): 312. https://doi.org/10.3390/ijgi12080312
[41] Saaty, T.L. (2013). The modern science of multicriteria decision making and its practical applications: The AHP/ANP approach. Operations Research, 61(5): 1101-1118. https://doi.org/10.1287/opre.2013.1197
[42] Saaty, T.L. (2004). Decision making—the analytic hierarchy and network processes (AHP/ANP). Journal of Systems Science and Systems Engineering, 13: 1-35. https://doi.org/10.1007/s11518-006-0151-5
[43] Al-shabeeb, A.R. (2016). The use of AHP within GIS in selecting potential sites for water harvesting sites in the Azraq Basin—Jordan. Journal of Geographic Information System, 8(1): 73-88. https://doi.org/10.4236/jgis.2016.81008
[44] Hameed, H.M. (2013). Water harvesting in Erbil Governorate, Kurdistan region, Iraq: Detection of suitable sites using geographic information system and remote sensing. Lund University.
[45] Sayl, K., Adham, A., Ritsema, C.J. (2020). A GIS-based multicriteria analysis in modeling optimum sites for rainwater harvesting. Hydrology, 7(3): 51. https://doi.org/10.3390/hydrology7030051