Ahmed Abdulhakeem Tawfeeq![]() | Omar N. Al-Samarrai
| Omar N. Al-Samarrai![]() | Ghassan F. Al-Samarrai*
| Ghassan F. Al-Samarrai*![]()
© 2024 The authors. This article is published by IIETA and is licensed under the CC BY 4.0 license (http://creativecommons.org/licenses/by/4.0/).
OPEN ACCESS
Study carried out in Department of Biology Faculty of Education, University of Samarra to evaluation response of Lepidium sativum different light stress. Objective of this study is to demonstrate the direct effect of light stress on the levels of total chlorophyll pigment, and free radical, that effects on the physiological processes in plants. Cress plant Lepidium sativum was exposed to different levels of light intensity 10, 100, 370µE during the growth process in order to measure the change in the concentrations of the total chlorophyll pigment represented by chlorophyll a and b and measurement of H2O2. The result showed that the control group was grown at a light intensity of 54µE, the cress plant was exposed to Each light intensity mentioned above is divided into four time periods (2, 6, 12, 24 hours), we also showed a significant increase in total chlorophyll concentrations at 370µE with a 2-hour exposure duration, where the pigment concentration reached 0.65 mg total/g tw. Also indicated that reducing light intensity generally leads to a decrease in pigment concentration, except for a light intensity of 10µE for the durations of 24 and 12 hours, which showed an increase in total chlorophyll concentration, reaching 0.51mg total/g tw and 0.44mg total/g tw, respectively. While the values of free radicals recorded a significant increase with the increase in the period and duration of exposure compared to the control treatment. From the study it was concluded Light intensity stress experienced by plants directly affects the concentration of plant pigments, particularly chlorophyll, which is a product of secondary metabolism.
light intensity stress, chlorophyll concentration, free radicals, Lepidium sativum, plant metabolism
The intricate process of photosynthesis transforms solar energy into chemical energy in plant. The productivity of crops relies heavily on their photosynthetic rates, which are influenced by photosynthetically active radiation (PAR) in higher plants [1]. At the level of chloroplasts, immediate responses include state transitions, non-photochemical quenching, and chlorophyll fluorescence, while long-term responses alter gene expression mediated by signal cascades and networks, these approaches enhance the plant's ability to capture light, enhance photosynthetic efficiency, shield the plant from the harmful effects of excessive light, and facilitate flexible adaptation to enhance plant fitness in changing natural environments [2]. It is noteworthy that based on the intensity of light they received during growth, radish seedlings underwent changes not only in the composition of pigments and quinones in the thylakoid membrane but also in the chloroplast's ultrastructure. Under strong light, radish sun chloroplasts bore a striking resemblance to those found in the sun leaves of beech trees, while those developed in dim light exhibited a typical shade chloroplast structure [3]. The findings indicated that the most intense light stress led to a reduction in maximum fluorescence, variable fluorescence, quantum yield of PSII photochemistry, chlorophyll (Chl), and photochemical quenching, while increasing non-photochemical quenching, minimum fluorescence (F0), and anthocyanin levels [4]. Many studies have indicated that light intensity significantly impacts chlorophyll biosynthesis, leading to higher pigment levels under limited illumination. Conversely, cellular growth thrives best under higher light intensities. Hence, this study explores a two-step cultivation process for S. platensis, using urea and KNO3 as nitrogen sources. The process involves initially exposing the culture to high light intensity to promote cellular growth, followed by reducing light intensity to enhance chlorophyll biomass production [5]. Throughout the day, plants are exposed to varying levels of light intensity, sometimes reaching very high levels, causing an imbalance in the photosynthesis process. This triggers reactions and stress responses in plants, prompting them to employ protective mechanisms against excessive energy from intense light. One such mechanism is non-photochemical energy quenching (NPQ), which rapidly dissipates excess light energy by converting it into heat and releasing it through plant tissues, primarily leaves [6]. Different types and intensities of abiotic stress and duration of exposure to abiotic stress have been studied in order to modify the plant's internal homeostasis. Reactive oxygen species (ROS), especially H2O2, signal molecules that initiate intracellular and systemic signaling, promote oxidative stress, and induce signaling associated with cell death [7-9]. Garden cress (Lepidium sativum) is a small, one-year-old herbaceous plant from the cruciferous family, with height of 50cm. It is rich in minerals and vitamins such as C and A, which are very useful in food, health and treating some diseases. This plant has exceptional properties as an edible and medicinal plant given the effects of Light Intensity on plants, particularly their positive impacts on leaf vegetables, the main purpose of this study is to examine and compare different combinations of light intensity on levels of total chlorophyll pigment, and free radical in cress plant as an important leaf vegetable and medicinal plant relative to the control treatment. This is done in order to introduce the most ideal growing condition of cress in terms of lighting ratios of Light Intensity compare which natural sunlight is used.
The experiment applied inside green hose, in Department of biology, University of Samarra, Samarra-Iraq, to study the effect of Light stresses on bioactivity indicters of cress Lepidium sativum. Plant stresses include four treatments (10, 100, 370µE and 54 µE as control) with four period of time (2, 6, 12 and 24 h) to be 13 treatments is listed in Table 1 bellow depended on initial experiences and previous studies [10].
Table 1. Treatments in experiments of study
|
No. |
Treatment Code |
Light Level |
Period Time |
|
1 |
T0 |
54 µE |
Normal |
|
2 |
T1 |
10 µE |
2h |
|
3 |
T2 |
10 µE |
6h |
|
4 |
T3 |
10 µE |
12h |
|
5 |
T4 |
10 µE |
24h |
|
6 |
T5 |
100 µE |
2h |
|
7 |
T6 |
100 µE |
6h |
|
8 |
T7 |
100 µE |
12h |
|
9 |
T8 |
100 µE |
24h |
|
10 |
T9 |
370 µE |
2h |
|
11 |
T10 |
370 µE |
6h |
|
12 |
T11 |
370 µE |
12h |
|
13 |
T12 |
370 µE |
24h |
The replicates and their combinations resulted in 12 treatments for each replicate, including the control treatment. Experimental units were distributed randomly to reduce experimental error, each treatment was coded with a symbol for ease of handling and distinction from T0 to T12.
2.1 Measurement of chlorophyll
To get the most accurate calculation for chlorophyll measurement, 20mg tissue samples were ground in liquid nitrogen and homogenized in 1ml of 80% acetone. By using vortex for almost 5 mints, samples suspension was mixed and followed by incubation for 1h in darkness.
The samples centrifuged at 13000 rpm for 15 min and the supernatants were collected in new tubes to use for measurement. Chlorophyll content in aqueous acetone was quantified spectrophotometrically by measuring the absorbance of the extract at 646.6 nm and 663.6 nm. The total chlorophyll content (chlorophyll a and b) in each sample was calculated according to Hazrati et al. [7].
Cold methnol /HCl/ water (90:1:1, vol) was used as buffer to extract Anthocyanins with the same procedure as that for the chlorophyll measurements as described by Huang et al. [11].
Anthocyanins concentration was estimated as the following:
While the total carotenoids in the tissues, founded using the following equation:
Carotenoids (µmol ml-1)=(A470-(17.1×(Chl a+Chl b)-9.479xanthocyanin))/119
2.2 Measurement of H2O2
The hydrogen peroxide content in the leaf samples from both treated and control groups was determined using the method described by Porra [12]. Approximately 0.1g of frozen leaf material was homogenized on ice with 0.1% (w/v) trichloroacetic acid (TCA). The homogenate was then centrifuged at 15,000g for 15 minutes at 4℃. The resulting supernatant was transferred to a new tube, and 0.5 ml of this supernatant was mixed with 0.5 ml of 10 mM potassium phosphate buffer (pH 7.0) and 1 ml of 1 M KI. The mixture was gently mixed, and its absorbance was measured at 390 nm.
2.3 Statistical analysis
The data were analysed statistically using the SAS program, and the arithmetic means of the coefficients were compared based on the Duncuns multiple range test at a probability level of 5%.
3.1 Total chlorophyll
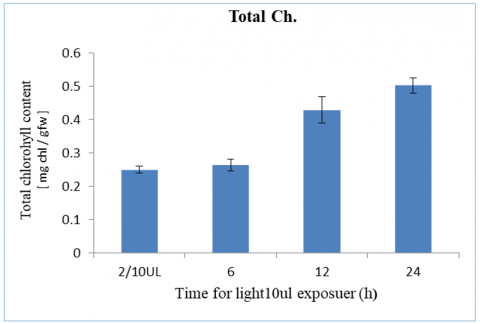
The results showed a clear increase in total Ch. concentrations of plants exposed to a light intensity level of 10 µE for 24 hours of exposure which was 0.51mg total/g tw. However, we found that this level of light intensity does not sufficiently support the plant during short periods of exposure (2 hours) where it reached 0.25mg total/g tw compared to the control group, which was 54 µE, this is as shown in the Figure 1.
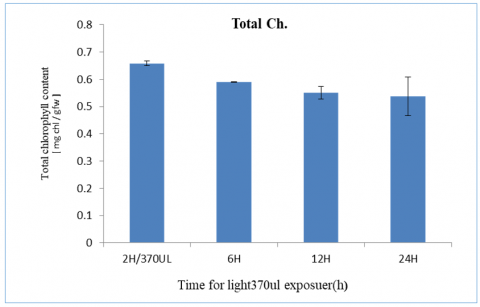
However, the results found that this level of light intensity does not sufficiently support the plant during long periods of exposure 24 hours where its reached 0.35mg total/g tw, this is as shown in Figure 2. Sims and Gamon [13] found similar results, demonstrating that variations in chlorophyll levels are an early sign of light stress experienced by plants during their growth, which significantly impacts overall productivity and biological activity.
The results we obtained showed a high affinity in total Ch. concentrations of plants exposed to a light intensity level of 370 µE for the applicable light levels, which were 2, 6, 12 and 24 hours of exposure which was 0.65, 0.6, 0.58 and 0.57 respectively as shown in Figure 3.
Figure 1. Total chlorophyll content with light intensity at 10 µE and different period time from 2-24h
Figure 2. Total chlorophyll content with light intensity at 100 µE and different period time from 2-24h
In case of 100 µE exposure the results showed a clear increase in total Ch. concentrations of plants exposed 2 hours of exposure which was 0.48mg total/g tw. However, we found that this level of light intensity does not sufficiently support the plant during long periods of exposure 24 hours where its reached 0.35mg total/g tw, this is as shown in Figure 3. Faseela et al. [14] found similar results, demonstrating that variations in chlorophyll levels are an early sign of light stress experienced by plants during their growth, which significantly impacts overall productivity and biological activity. These results indicate that at this level of light intensity, significant changes in the levels of total chlorophyll do not occur in the plant. In Figure 4, it can be clearly observed that the results obtained with a light intensity of 370 are the highest when compared to the control group and the other groups of light intensity levels, these results were consistent with what reached by Wu et al. [15].
Much research has confirmed the effect of light stress on various photosynthesis processes. This is perhaps due to damage to the enzymatic systems at high levels of photo-oxidation or severe lack of light, which directly affects the photosystem, which leads to a reduction in the leaf content of green pigments and other auxiliary pigments, which leads to a decrease in the efficiency rate of photosynthesis. Through the lack of preparation of the necessary elements for this, along with the weak fixation of carbon dioxide gas in the photosynthesis pathways through the stomata, the number, size, and frequency of which are affected by the weakness of the leaf and the lack of the number of green pigments. Also under different stress, the plant may upregulate antioxidant enzyme activities such as superoxide dismutase and catalase to mitigate oxidative damage. Additionally, increased levels of secondary metabolites like phenolic and flavonoids may be observed, which act as photo protective agents against excess light. The results of the current study were in agreement with the results of studies [16, 17]. The light intensity and exposure period directly affected the chlorophyll content, as the content and effectiveness increased by increasing the light intensity and effectiveness, and thus the construction efficiency and dry matter accumulation.
Figure 3. Total chlorophyll content with light intensity at 370 µE and different period time from 2-24h
3.2 Effects of light quantity on H2O2 content
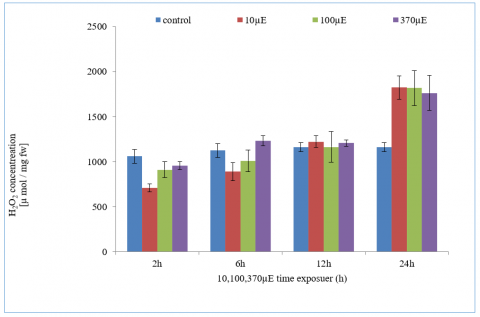
Result in Table 2 and Figure 4 showed diferent vulae of frre redical at treatmentes under study that recorded an increase in free radical rates with increasing exposure time and intensity of light compared with control treatment that gave owest rates reached 75.53, 76.67, 49.47 and 49.47 µ mol / mg fw at 2h, 6h, 12h and 24h respectively. While low light intensit values of free radicals recorded with lowest duration of exposure at different period time. The mean values recorded at 2 hours were 709.56, 910.33, and 955.64 µmol/mg FW at light intensities of 10 µE, 100 µE, and 370 µE, respectively. As noted, there was an increase in free radical values with prolonged exposure to light intensity over a period of 24 hours, yielding values of 1824.24 µmol/mg FW, 1818.18 µmol/mg FW, and 1763.63 µmol/mg FW at 10 µE, 100 µE, and 370 µE, respectively.
Light intensity plays an important role in its effects on free radical content in plants. Free radicals are highly oxidative efficient molecules that form in plant cells as a result of normal metabolic processes or as a result of environmental stresses such as light stress. High light intensity increases the process of photosynthesis in plants, which increases energy production and thus may increase the generation of free radicals as a by-product of metabolic processes [18].
Table 2. Total content of H2O2 µ mol / mg fw in leave with diffrent light intensity from 100-370 µE and different period time from 2-24h
|
Light Intensity |
Time of Duration |
|||
|
2h |
6h |
12h |
24 |
|
|
Control µE54 |
75.53612 |
76.67625 |
49.47806 |
49.4780 |
|
10µE |
709.5605 |
889.393 |
1222.727 |
1824.242 |
|
100µE |
910.3306 |
1009.366 |
1163.131 |
1818.182 |
|
370µE |
955.6474 |
1233.333 |
1206.061 |
1763.636 |
Many studies have shown that plants exposed to high light intensity may increase the production of free radicals. Free radicals are heterogeneous molecules containing unbound atoms that can react with plant cells and cause oxidative damage [19]. It is thought that increased light intensity may increase the production of active oxygen and free radicals in plants as a result of harmful light processes such as photo oxidation in chloroplasts. This may sometimes exacerbate oxidative damage within plant cells. Free radicals are part of the plant response to environmental stresses and can contribute to the regulation of plant growth and development including the plant's response to light and other environmental conditions. Many Researchers has shown that plants exposed to high light intensities often exhibit increased oxidative stress markers. For example, studies have documented higher levels of hydrogen peroxide and malondialdehyde (a marker for lipid peroxidation) in plants under excessive light conditions. Plants have evolved mechanisms to cope with varying light conditions. Studies have highlighted the upregulation of antioxidant enzymes under high light conditions, which help mitigate the damage caused by increased free radicals. For instance, the activity of SOD and CAT typically increases in response to high light intensity to neutralize excess ROS. Also, some studies have focused on plant adaptation to different light conditions. For example, certain plant species have developed specific light-harvesting complexes and protective pigments like carotenoids to mitigate the effects of high light intensity and reduce oxidative damage [20, 21]. Many researcher found quantity of light can significantly affect hydrogen peroxide (H₂O₂) levels in plants and photosynthetic organisms. Photosynthesis and ROS Production. The results are also indicative higher light levels can enhance the production of reactive oxygen species (ROS), including H₂O₂, due to increased electron transport in chloroplasts. In addition, excess light can lead to photo inhibition, where the photosynthetic machinery becomes damaged. This stress can result in increased H₂O₂ accumulation as a byproduct of impaired photosynthesis. Plants often respond to increased light intensity and H₂O₂ accumulation by activating antioxidant systems, such as catalase and peroxidase, to mitigate oxidative stress. Different wavelengths of light can also affect H₂O₂ levels [22-24].
Figure 4. Concentration of H2O2 with three light intensity (100 to 370 µE) and different period time from 2-24h
Light intensity stress experienced by plants directly affects on the concentration of plant pigments, and product of secondary metabolism. increased light intensity levels resulted in higher total concentration of chlorophyll. Furthermore, treating plants with varying light intensity levels produced different free radicals (H2O2) concentration outcomes, reinforcing our assumption of the direct impact of light intensity on overall plant metabolism.
Thanks to the College of Education, University of Samarra, Samarra, Iraq for providing grant and facilities to complete the research.
[1] Wimalasekera, R. (2019). Effect of light intensity on photosynthesis. In: Photosynthesis, Productivity and Environmental Stress, pp. 65-73. https://doi.org/10.1002/9781119501800.ch4
[2] Anderson, J.M., Chow, W.S., Park, Y.I. (1995). The grand design of photosynthesis: acclimation of the photosynthetic apparatus to environmental cues. Photosynthesis Research, 46(1-2): 129-139. https://doi.org/10.1007/BF00020423
[3] Grumbach, K.H., Lichtenthaler, H.K. (1982). Chloroplast pigments and their biosynthesis in relation to light intensity. Photochemistry and Photobiology, 35(2): 209-212. https://doi.org/10.1111/j.1751-1097.1982.tb03833.x
[4] Pellinen, R.I., Korhonen, M.S., Tauriainen, A.A., Palva, E.T. Kangasjärvi, J. (2002). Hydrogen peroxide activates cell death and defense gene expression in birch. Plant Physiol, 130(2): 549-560. https://doi.org/10.1104/pp.003954
[5] Vranová, E., Inzé, D., Van Breusegem, F. (2002). Signal transduction during oxidative stress. Journal of Experimental Botany, 53(372): 1227-1236. https://doi.org/10.1093/jexbot/53.372.1227
[6] Alkhsabah, I.A., Alsharafa, K.Y., Kalaji, H.M. (2018). Effects of abiotic factors on internal homeostasis of Mentha spicata leaves. Applied Ecology & Environmental Research, 16(3): 2537-2564. https://doi.org/10.15666/aeer/1603_25372564
[7] Hazrati, S., Tahmasebi-Sarvestani, Z., Modarres-Sanavy, S.A.M., Mokhtassi-Bidgoli, A., Nicola, S. (2016). Effects of water stress and light intensity on chlorophyll fluorescence parameters and pigments of Aloe vera L. Plant Physiology and Biochemistry, 106: 141-148. https://doi.org/10.1016/j.plaphy.2016.04.046
[8] DeVito, L.M. (1996). A versatile clock recovery architecture and monolithic implementation. In: Monolithic Phase-Locked Loops and Clock Recovery Circuits: Theory and Design, New York, NY: IEEE Press, pp. 405-442.
[9] Danesi, E.D.G., Rangel-Yagui, C.D.O., Carvalho, J.C.M.D., Sato, S. (2004). Effect of reducing the light intensity on the growth and production of chlorophyll by Spirulina platensis. Biomass and Bioenergy, 26(4): 329-335. https://doi.org/10.1016/S0961-9534(03)00127-2
[10] Al-Sammarraie, O.N., Alsharafa, K.Y., Al-Limoun, M.O., Khleifat, K.M., Al-Sarayreh, S.A., Al-Shuneigat, J.M., Kalaji, H.M. (2020). Effect of various abiotic stressors on some biochemical indices of Lepidium sativum plants. Scientific Reports, 10(1): 21131. https://doi.org/10.1038/s41598-020-78330-1
[11] Huang, J., Zhao, X., Chory, J. (2019). The Arabidopsis transcriptome responds specifically and dynamically to high light stress. Cell Reports, 29(12): 4186-4199. https://doi.org/10.1016/j.celrep.2019.11.051
[12] Porra, R.J. (2002). The chequered history of the development and use of simultaneous equations for the accurate determination of chlorophylls a and b. PhotosynthesisResearch, 73: 149-156. https://doi.org/10.1023/A:1020470224740
[13] Sims, D.A., Gamon, J.A. (2002). Relationships between leaf pigment content and spectral reflectance across a wide range of species, leaf structures and developmental stages. Remote Sensing of Environment, 81(2-3): 337-354. https://doi.org/10.1016/S0034-4257(02)00010-X
[14] Faseela, P., Sinisha, A.K., Brestič, M., Puthur, J.T. (2020). Chlorophyll a fluorescence parameters as indicators of a particular abiotic stress in rice. Photosynthetica, 58(SI): 293-300. https://doi.org/10.32615/ps.2019.147
[15] Wu, X., Khan, R., Gao, H., Liu, H., Zhang, J., Ma, X. (2021). Low light alters the photosynthesis process in cigar tobacco via modulation of the chlorophyll content, chlorophyll fluorescence, and gene expression. Agriculture, 11(8): 755. https://doi.org/10.3390/agriculture11080755
[16] Christou, A., Manganaris, G.A., Papadopoulos, I., Fotopoulos, V. (2013). Hydrogen sulfide induces systemic tolerance to salinity and non-ionic osmotic stress in strawberry plants through modification of reactive species biosynthesis and transcriptional regulation of multiple defence pathways. Journal of Experimental Botany, 64(7): 1953-1966. https://doi.org/10.1093/jxb/ert055
[17] Müller, M., Munné-Bosch, S. (2021). Hormonal impact on photosynthesis and photoprotection in plants. Plant Physiology, 185(4): 1500-1522. https://doi.org/10.1093/plphys/kiaa119
[18] Kasote, D.M., Katyare, S.S., Hegde, M.V., Bae, H. (2015). Significance of antioxidant potential of plants and its relevance to therapeutic applications. International Journal of Biological Sciences, 11(8): 982. https://doi.org/10.7150%2Fijbs.12096
[19] Borbély, P., Gasperl, A., Pálmai, T., Ahres, M., Asghar, M.A., Galiba, G., Müller M, Kocsy, G. (2022). Light intensity-and spectrum-dependent redox regulation of plant metabolism. Antioxidants, 11(7): 1311. https://doi.org/10.3390/antiox11071311
[20] Sharma, P., Jha, A.B., Dubey, R.S., Pessarakli, M. (2012). Reactive oxygen species, oxidative damage, and antioxidative defense mechanism in plants under stressful conditions. Journal of Botany, 2012(1): 217037. https://doi.org/10.1155/2012/217037
[21] Tawfeeq, A.A.H., Al Samarrai, G.F. (2022). Effect of salinity stress on some biochemical indicators of Lepidium sativum L. plant. International Journal of Agricultural Statistics Sciences, 18(1): 71-78.
[22] Apel, K., Hirt, H. (2004). Reactive oxygen species: Metabolism, oxidative stress, and signal transduction. Annual Review of Plant Biology, 55(1): 373-399. https://doi.org/10.1146/annurev.arplant.55.031903.141701
[23] Foyer, C.H., Noctor, G. (2013). Redox signaling in plants. Antioxidants & Redox Signaling, 18(16): 2087-2090. https://doi.org/10.1089/ars.2013.5278
[24] Miller, G., Suzuki, N., Ciftci-Yilmaz, S., Mittler, R. (2010). Reactive oxygen species homeostasis and signalling during drought and salinity stresses. Plant, Cell & Environment, 33(4): 453-467. https://doi.org/10.1111/j.1365-3040.2009.02041.x