Ali A. Abdul-Sahib*![]() | Thair J. Alfatlawi
| Thair J. Alfatlawi![]() | Mohammed S. Shamkhi
| Mohammed S. Shamkhi![]()
© 2024 The authors. This article is published by IIETA and is licensed under the CC BY 4.0 license (http://creativecommons.org/licenses/by/4.0/).
OPEN ACCESS
The terrain of the surrounding boundaries, as well as the dimensions of the inlet and outlet tunnels, have an impact on the behavior and performance of the MGS. The scale effect, which arises from the inability to reduce surface tension and viscosity forces and hence increases their impact in the model, is one of the issues with using physical models. The purpose of this study is to determine how the scale effect affects this kind of spillway's discharge coefficient. There are two physical models of the Morning Glory Spillway of the Dokhan Dam, one at a scale of 1:45.65 and the other at 1:27.63. A dimensional analysis is performed before the model is built in the lab. The dimensionless parameters that were produced revealed that the Cd depended on Fr, Re, We, and H/D. A discharge and head above the crest weir were measured to calculate these parameters for models and prototype. The examination of the experimental data revealed that the discharge coefficient leveled off at a value of roughly 0.4 for Reynolds numbers higher than 300,000. The prototype's discharge coefficient can be calculated without taking into account the Reynolds number because it has reached a certain level of independence. Although the discharge coefficient is unaffected by surface tension, it does fluctuate when Weber values fall below 60 and 80. Weber number independence can be disregarded when calculating the prototype's discharge coefficient because it has been achieved. Furthermore, for all discharge values, the discharge coefficients computed from measurements yield a result that is dependent on the Froude number. It is evident for two models that the relationship between the two parameters is linear, independent of the weir head and scale ratio. The prototype's relationship between the discharge coefficient and the Froude number completely matches that of the models, suggesting that the Froude number was unaffected by the length ratio. When H/D values are below 0.0451, the discharge coefficient is only little affected by H/D. This relationship between the discharge coefficient and the relative head-to-diameter can be complicated and is influenced by the form and construction of the weir. When the values are above 0.0451, H/D does not affect the discharge coefficient, and the discharge coefficient depends directly on the Froude number and the H /D. Consequently, these conclusions enabled the computation of the discharge coefficient of the Morning Glory Spillway of the Dokan Dam based only on depth above the crest.
discharge coefficient, Morning Glory Spillway, scale effect, physical model, dimensional analysis, hydraulic modeling
An essential facility for emergency water transportation is the Morning Glory Spillway (MGS). The dam's spillway is intended to remove extra water during floods, keeping the water from overflowing the dam crest and protecting the dam's structural integrity. Since ancient times, vertical drop shafts have been built [1]. They are currently used in cities to direct rainfall from surface areas into subterranean tunnels [2].
The Morning Glory Spillway (MGS) is a particular hydraulic structure that functions separately from the main dam body. It is distinguished by a horizontal tunnel, a vertical shaft, and an entrance in the shape of a funnel. Particularly when other spillway types are impractical or not viable, the MGS is used. Numerous variables, including the diameters of the inlet and outlet tunnels and the terrain of the surrounding boundaries, influence the behavior and performance of the MGS [3].
The water height over the crest causes a proportionate fluctuation in the discharge rating curve. The discharge increases dramatically at low heads with tiny head increments, concentrating the water in the lateral shaft wall and creating an air-entrainment core. The flow thickens and can fill the entire cross-section when the head is increased over the crest. The weir crest will become submerged if the water level rises further, which will cause the spillway to submerge and change the discharge rating curve control. In these circumstances, there is a significant increase in water level for a negligible increase in flow output. The vertical shaft will eventually become a pressure flow as the flow grows, filling the horizontal tunnel's whole cross-section [4]. Hydraulic structure design, analysis, and optimization are significantly aided by physical modeling. Frequently produced at smaller scales, these models mimic how hydraulic systems and structures behave in various scenarios and offer insightful information that can guide engineering choices.
To guarantee that hydraulic structures are designed correctly, studies involving physical modeling are carried out to simulate the flow in these structures. The scale effect, which results from the inability to decrease surface tension and viscosity forces and thereby amplifies their effects in the model, is one of the issues with employing physical models [4]. Measurements of the up-scaled model deviate from prototype data due to scale effects. the model and its prototype have different force ratios as a result of the prototype characteristics not being appropriately scaled to the smaller universe [5]. The construction of spillway models is based on the Froude laws of similitude. By excluding the effects of surface tension and viscosity, the scale effect may be avoided and the validity of the results can be guaranteed. The Reynolds number for spillway channels should be greater than 105 [6], which is the same conclusion as Chanson and Chachereau's [7] results for vertical shafts. According to Pinto and Neidert [8], the Weber number should also be more than 500. One can compute free flow in a Morning Glory Spillway (MGS) using the following expression:
$Q=C d *(2 \pi R) * \sqrt{2 g} * H^{3 / 2}$ (1)
where,
Cd = discharge coefficient for G.M.S.;
R = morning glory crest radium;
g = gravity acceleration;
H = water level over the crest.
As to Sarginson's [9] findings, surface tension increases in circular inflows as the radius of free surface curvature decreases. In a spillway with a sharp crest, the discharge coefficient rises in proportion to the water level until the surface tension's effect is negligible. A crest with a large radius on a circular crested spillway has a higher coefficient of discharge under the same head than a crest with a small radius. Several writers developed equations for calculating the discharge in the sharp-crested spillway. Using statistical analysis, Musavi-Jahromi et al. [10] and Sayadzadeh et al. [11] derived numerical equations to compute the MGS coefficient of discharge for various VB types.
The following equations were derived for the crest control [11]:
$\begin{gathered}C d=1390.6 *\left(e^{\frac{H}{D}}\right)^{-0.01}+131.3 \frac{b}{D}-156.9 \frac{h}{D}+0.241(n)^{0.757} \\ +477.5(F r)^{0.001}+0.6 *\left(e^a\right)^{-0.476}\end{gathered}$ (2)
For orifice control:
$\begin{gathered}C d=0.662 *\left(e^{\frac{H}{D}}\right)^{-2.725}+49.223 \frac{b}{D}-60.289 \frac{h}{D}+1.442(n)^{0.014} \\ +1.239(F r)^{-0.866}-1.103(a)^{0.062}-0.34\end{gathered}$ (3)
The influence of flow velocity at low crest heights, which can lead to a scale effect, is also addressed by Kolkman [12]. The minimum head-over crest height required for physical modeling research is between 0.010 and 0.012 m, so the prototype values can be appropriately decreased.
After looking at how well various computational approaches could estimate Cd, Haghbin et al. [13] concluded that SVR-IWO, or Support Vector Regression with Invasive Weed Optimization, was the most effective model.
Alfatlawi and Alshaikhli [14], Camargo et al. [15], Kamanbedast [16], and Kashkaki et al. [17] are only a few of the numerous studies that have investigated the MGS discharge coefficient using Artificial Neural Networks (ANN).
The researcher in a study by Othman and Abdulrahman [18] looked at the discharge coefficient values for various vortex numbers. The results demonstrated that the model's evaluation accuracy was high, with 55.93% of the projected outputs closely matching the actual values.
Additionally, nonlinear relation curves were interpolated and extrapolated by Camargo et al. [15] using Artificial Neural Networks (ANN), the findings demonstrated that ANN is a good tool for MGS analysis and design, especially for predicting Cd and rating curves. Alfatlawi and Alshaikhli [14] also used ANN and MNLR methods to estimate the Cd of circular and quadrate-stepped MGS for comparison purposes. In contrast to the Max RMSE for MNLR formulas of 1.74% for four-stepped circular MGS, the maximum reported RMSE for the ANN method prediction was 1.4%, according to the results. The discharge coefficient of the spillway under consideration is precisely anticipated by both the ANN and MNLR methods. Eq. (4) (R2 = 0.955) and Eq. (5) (R2 = 0.952) are two equations that were derived from the MNLR results that predict the Cd for circular and quadrate geometries, respectively:
$\mathrm{Cd}=0.784 * N^{0.132} *\left(\frac{H}{R}\right)^{0.118} * F r^{1.068}$ (4)
$\mathrm{Cd}=0.846 * N^{0.101} *\left(\frac{H}{l}\right)^{0.102} * F r^{1.068}$ (5)
In this context, the head above the spillway crest (H), the number of steps (N), the length of the quadrant side (l), and the MGS crest radius (R) are all variables.
The Cd of a CPK spillway was predicted by Kashkaki et al. [17] using an ANN model. The outcomes of an experimental investigation served as the basis for training and testing the ANN models. To evaluate the effectiveness of the ANN, researchers utilized R2, MAE, RMSE, and MPE, which stand for mean absolute percentage error and root mean square error, respectively.
According to the study authors, the CPK spillway's Cd levels were better estimated using the ANN model. Nevertheless, Fais and Genovez [4] investigated the flow rating curve in the Morning Glory Spillway's funnel to reduce scale's impact at low water levels.
To achieve this goal, they conducted an experimental analysis using a 1:51.02 scale model of the Paraitinga Dam spillway. As a result, the following formulae were developed to account for low water levels and correct the Cd:
$C=0.17+0.242 \sqrt{33-\left[5.5-\frac{H}{R}\right]^2+\left[1+1.2 \frac{H}{R}\right]^{-4 / 9}}$ (6)
$C=2.967\left[\frac{H}{R}\right]^{0.178}$ (7)
The height of water above the crest of the spillway is denoted by H, while the crest radius is represented by R. For the same spillway, the corrected flow rating curves were compared to those calculated by Genovez [19] at model scales of 1:63.17 and 1:83.29, the findings show that for discharges less than 2*10-3 m3/s (at a scale of 1:83.29), 4*10-3 m3/s (at a scale of 1:63.17), and 7*10-3 m3/s (at a scale of 1:51.02), there is a clear disagreement between the flow rating curves of the models and the prototype. The findings from the prototype and the model were in good agreement according to the suggested equations, with a maximum deviation of 2.5%. However, as demonstrated by Gouryev et al. [20], the discharge coefficient for a shaft spillway that operates with a small head can take values between 0.270 and 0.272.
Nohani [21] used regression analysis to demonstrate a connection between (H/D) and the discharge coefficient. The discharge coefficient (Cd) values of a shaft spillway have an inversely proportional relationship with the H/D at that spillway.
To calculate the Cd for both stepped and smooth MGS, Aghamajidi et al. [22] created two empirical equations:
For a smooth spillway:
$\mathrm{Cd}=1.725 *\left[\frac{H}{R}\right]^{-0.133} * 0.147(F r)^{-1.38}$ (8)
For a stepped spillway:
$\mathrm{Cd}=0.016 *\left[\frac{H}{R}\right]^{-1.629} * 1.949(F r)^{0.364}$ (9)
Furthermore, for H/P ratios higher than 0.2, Aydin and Ulu [23] used regression analysis to create a novel formula for predicting the labyrinth-shaft spillway's discharge coefficients.
$\mathrm{Cd}=0.91 *\left[\frac{L}{L_S}\right]^{-4.06 \frac{H}{P}}+0.59 * e^{\left(-0.62 \frac{H}{P}\right)}$ (10)
LS stands for the Morning Glory shape's crest length, while L represents the labyrinth weir's crest length. The results show several correlations discovered in earlier research, including the coefficient of discharge for MGS as a function of relative submergence (H/D) and the coefficient of discharge (Cd) values drop proportionally with increasing H/D ratio. Notably, most of the existing Cd estimation algorithms apply to lower H/D levels in the crest control situation. The great degree of variability in Cd readings under this flow condition is thought to be the cause of this predilection.
Concerning physical hydraulic engineering models, Pfister and Chanson [24] investigated the implications of size. To take surface tension effects into account, they mention a minimum Reynolds number ranging from 2×10⁵ to 3×10⁵, or a minimum Weber number of 140. The features of a skimming flow regime for a two-phase stepped spillway were investigated by Boes and Hager [25]. The results in physical modeling of two-phase air-water flow demonstrated the minimal Reynolds number that necessitates the minimum scale impact.
Several studies have examined the impact of viscosity and surface tension on spillway flow. Consequently, the Morning Glory Spillway's physical models can accurately replicate it. This research aims to study the impact of the viscosity and surface tension on the discharge coefficient for models of the Morning Glory Spillway of the Dokhan dam and determine the parameters that influence the discharge coefficient.
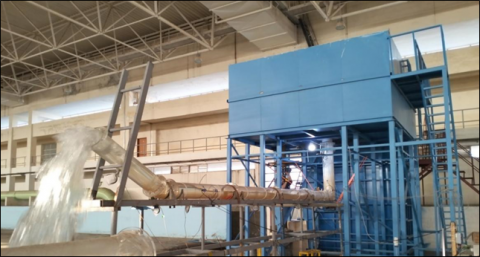
The models were produced in the hydraulics laboratory of the Ministry of Water Resources to investigate the impact of scale effect on the discharge coefficient in the Morning Glory Spillway of Dokhan Dam. The construction of the models was based on the as-built drawings of the Dokhan spillway. The main elements of the models were the Funnel inlet, the vertical drop shaft, the horizontal pipe with a small slope (-0.3%), and the inclined pipe outlet (see Figure 1).
The physical models of the Morning Glory Spillway of Dokhan Dam were made at scales of 1:45.65 and 1:27.63. The odd scale of the model was determined by the inside diameter of the acrylic pipe used to model the tunnel conduit (see Figure 2).
Figure 1. Line sketch of physical model layout
Figure 2. Photograph of physical model
Because of the model's massive size, all forces except gravity (Froude values) are rendered negligible, allowing for a clear view of the flow's finer details.
The laboratory has a water supply system with sump pumps, each with a discharge (1) m3/s and two tanks. The initial tank is a vertical tank with dimensions of (2×3×6) m designed to decrease velocities and disturbances and convey the discharge to the elevator tank with low velocity and minimal disruption. The second tank is a (4×4×2) m elevator tank with a Morning Glory Spillway in its center. A flow meter measured the flow rate at the main pipe.
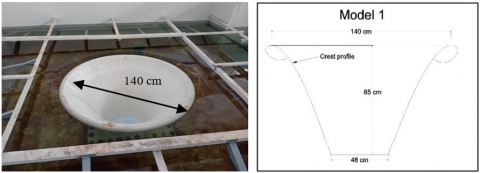
Figure 3 shows the funnel inlet, also known as Morning Glory, constructed of steel. Its crest profile resembles the lower surface of a nappe flowing over an aerated sharp crested circular weir. Atmospheric pressures will then act upon the crest.
Figure 3. Crest profile of a Morning Glory Spillway intake
Figure 4 depicts the first model with dimensions of 70 cm in radium, 85 cm in height, and 48 cm in neck diameter; the second model is shown in Figure 5 with dimensions of 40 cm in radium, 50 cm in height, and 30 cm in neck diameter.
Figure 4. Geometry of Model 1 with scale 1:27.63
Figure 5. Geometry of Model 2 with scale 1:45.65
The water level above the crest was monitored, and the models were run within a specific range of flow rates throughout this procedure. The parameters Cd, Fr, Re, We, and H/D were computed for each model at the crest of a funnel and the same parameters were calculated for the prototype. Keeping the water level in the elevator tank at the specified level made providing the required water flow possible. The water tank level of the model was manually regulated by partially closing the inflow valves when the water level increased and vice versa when the water level decreased. A piezometer determined the water level's elevation over the funnel's crest.
Dimensional analysis is used before building a physical model in the lab to discover the relationships between the prototype and the model. It can find the dimensionless quantities that are significant to the model and prototype [26].
One way to illustrate the relationship between the following parameters and the Cd value in MGS is as follows:
F (Cd, H, D, V, g, σ, ρ, μ) =0 (11)
where, Cd: Coefficient of Discharge (dimensionless parameter), H: Height of water above the crest of spillway (L), D: Diameter of the spillway’s crest (L), V: Average velocity (LT−1), g: Gravitational acceleration (LT−2), σ: Surface tension of the fluid (MT−2), ρ: Mass density (ML−3), and μ: Dynamic viscosity (ML−1T−1).
The resulting dimensionless parameters are:
Cd=f1(gH/V2, μ/ρVH, σ/(ρV2H), D/H) (12)
where, (gH/V2) is the square inverse of Froud number (Fr), (μ/ρVH) is the inverse of Reynolds number (Re), and (σ/(ρV2H)) is the inverse of Weber number (We).
Based on the findings of the dimensional analysis, it was determined that the discharge coefficient is dependent on Froud number, Reynolds number, Weber number, and H/D, the relationship between these parameters and the discharge coefficient was used to exhibit the impact of the scale effect.
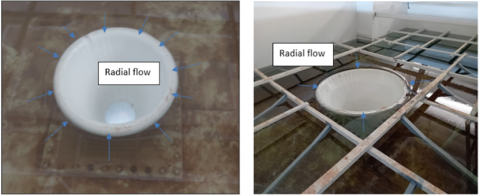
Figure 6 shows the radial flow in the Morning Glory Spillway of models and a head-over crest weir at different flow rates. For each model, we next calculated the discharge coefficient for a range of discharge levels using this data, and finally, we used Eq. (1) to find the theoretical discharge. The results of the dimensional analysis show that the discharge coefficient (Cd) is related to or reliant on the following variables: the Froude (Fr), the Reynolds (Re), the Weber numbers (We), and the relationship between the diameter (D) and the water depth above the crest weir (H). To demonstrate the degree of association between Cd and other parameters, all of them were calculated using experimental data, as can be observed in Figures 7-12.
Figure 6. The inflow in Morning Glory Spillway
All dependent nondimensional parameters must be identical between the prototype and the model to attain dynamic similarity, as stated in Eq. (12). The non-dimensional Reynolds, Froude, and Weber numbers are important in many free-surface liquid flows. There are occasions when we have to accept with partial resemblance between the model and prototype since it is impossible to match all of these parameters. It was determined that the discharge coefficient (Cd) for the Morning Glory weir is dependent on the following parameters: water depth to weir diameter (H/D), Froud number (Fr), Reynolds number (Re), and Weber number (We). The prototype spillway has a Reynolds number of (3.9*106), although the model and prototype are geometrically identical. The prototype is defined as 45.65 and 27.63 times the size of the two models, respectively, based on the length ratios employed in the experimental works, which are 1:45.65 and 1:27.63. Figure 7 shows a comparison of the Reynolds numbers of Model 1 and Model 2, it was clear that the models were well-matched for Reynolds number of more than 3*105; the value below this threshold exhibits slight variation, and the Reynolds number of the scales covering 1:27.63 to 1:45.65 does not affect the discharge coefficient, the failure to attain dynamic similarity can be attributed to the incompatibility of the discharge coefficient (Cd) with Reynolds (Re). The question of whether Reynolds number independence has been attained comes up again. It is evident from Figure 7 that Reynolds number independence was attained; the discharge coefficient has leveled off at approximately 0.4 for Reynolds numbers more significant than 3*105. It can be disregarded when calculating the prototype's discharge coefficient now that Reynolds number independence has been established. Several studies have reached similar conclusions, including [4, 14, 21, 22].
Figure 7. Relationship between Cd and Re for: a) Model 2, b) Model 1
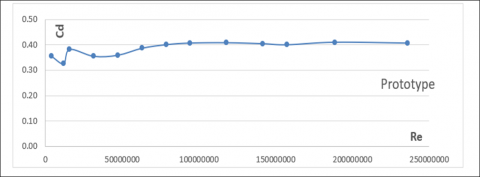
Reynolds and the discharge coefficient are shown in Figure 8 for a prototype. The results show that for Reynolds numbers larger than 78.6*106 of the prototype, the discharge coefficient is unaffected by them. At low Reynolds numbers, there is a negligible effect on the discharge coefficient, thus it may be ignored. Hence, the discharge coefficient is unaffected by the viscosity attribute for these models and prototypes; these support the findings of other investigations [10, 11, 14, 23, 27].
Figure 8. Relationship between Cd and Re for the prototype
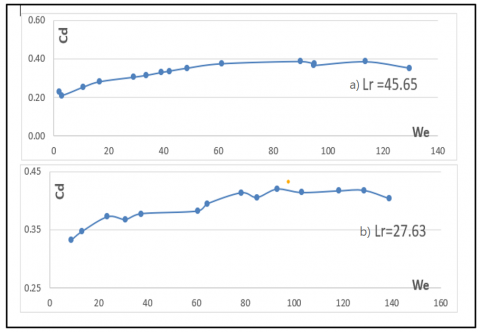
On the other hand, while achieving similarity with the Reynolds number required a flow velocity that was multiple times higher than the prototype, with the Weber numbers, similarity was impossible due to the dominating effects of surface tension and inertia, which meant a flow velocity that was many times lower. Whether the extremely low velocity is an issue in and of itself or the result of a shift in flow classification, it is evident that this is not acceptable. Figure 9 shows that the results showed that the Weber number does not change the discharge coefficient and is not statistically significant for values greater than 60 and 80 for Models 1 and Model 2, respectively. Surface tension has no effect on the discharge coefficient, as seen below, however, the discharge coefficient varies for Weber values less than 60 and 80. The prototype's discharge coefficient can be calculated without taking Weber number independence into account now that it has been achieved. Dagget and Keulegan [27], Jain et al. [28], and Nohani [29] all put forth situations under which Reynolds and Weber numbers may have no impact on the vortex.
Figure 9. Relationship between Cd and We for: a) Model 2, b) Model 1
Figure 10. Relationship between Cd and We for the prototype
Additionally, the results demonstrated that when the Weber number is greater than (1.26*105) for the prototype, it does not affect the discharge coefficient. This indicates that surface tension does not affect the discharge coefficient, but when Weber values are less than (1.26*105) there is a minimal effect, as shown in Figure 10.
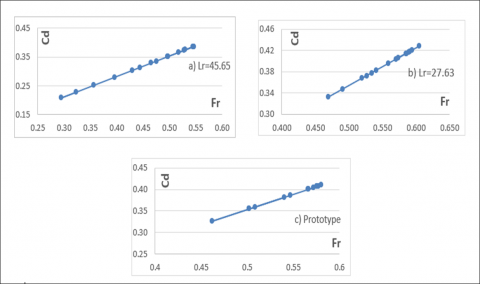
Attempting to establish a relationship between the discharge coefficient and the Froude number was the next analytical step. Figure 11 from the analysis of the results demonstrates the best fit between the Froude number dependence. Figure 11 made it crystal evident that the discharge coefficients computed from measurements rely on the Froude number for all discharge values. On two different models. No matter the scale ratio or the position of the weir head, a linear relationship between the two parameters is evident. As a result, it's reasonable to infer that there's a connection between the weir coefficient and the Froude number; this would explain how gravity profoundly affects the discharge coefficient values across the board. An essential part of the proposed formula is empirical coefficients.
Factor values derived using empirical equations were:
Cd = 0.707* Fr. For Model 1 (13)
And
Cd = 0.707* Fr. For Model 2 (14)
Figure 11 shows that the errors are not invisible; more research is needed to determine if they become worse for higher water velocity values.
Figure 11. Relationship between Cd and Fr for a) Model 2, b) Model 1, and c) prototype
Figure 11 shows a linear association between the Froude number and discharge coefficient. The Froude number appears to have been independent of the length ratio, as the discharge coefficient-Froude number relationship in Eq. (15) of the prototype is identical to that of the models.
Cd = 0.707* Fr (15)
Also, a close matching between the discharge coefficient and the Froude number can be interpreted mathematically. The analysis revealed a clear mathematical relationship between these two variables.
$F r=\frac{V}{\sqrt{g h}}=\frac{Q_{a c t}}{A \sqrt{g h}}$ (16)
$Q_{a c t}=C d * Q_{t h}$ (17)
$Q_{t h}=A * \sqrt{2 g\left(h+h_e\right)}$ (18)
where, he= velocity head m, h = head above the crest, A= area of flow, and Qact= actual discharge.
When the spillway height is more than 1.33 Hd, the approach velocity head becomes insignificant. In 1959, Chow claimed. At more than 1.33 m above the crest, the spillway is located in two models and the prototype. Thus, it is possible to disregard the (he). Eq. (19) was rearranged and Eqs. (16) and (18) were substituted, yielding:
Cd = 0.707* Fr (19)
Several studies have reached similar conclusions that the discharge coefficient is precisely related to the Froud number, including the study by Alfatlawi and Alshaikhli [14].
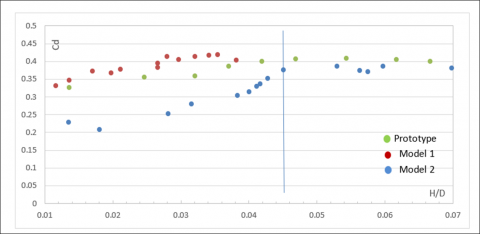
The relationship between the discharge coefficient of a weir and the relative head-to-diameter of Glory weir H/D involves understanding how the flow rate over the weir is influenced by the head of water above the crest of the weir. The relationship between the discharge coefficient and the relative head-to-diameter can be complex and is influenced by the shape and design of the weir.
The relationship between H/D and the discharge coefficient is seen in Figure 12. It proves that, for H/D values less than 0.0451, the discharge coefficient is quite sensitive to H/D. Nevertheless, when the values surpass 0.0451, the discharge coefficient is unaffected by H/D.
Approach velocity, viscosity effects, and the flow regime effect are to blame for this. A change in the discharge coefficient could occur if the flow becomes more turbulent at higher heads. Furthermore, low heads are more affected by viscous effects, and Cd can be influenced by the Reynolds number. See Figures 7 and 8 for examples of how the effect of viscosity diminishes with increasing head. How fast the water is flowing into the weir is another factor that influences the discharge coefficient. Changing the Cd is possible with higher approach velocities because they raise the effective head.
Figure 12. Relationship between Cd and H/D for Model 1, Model 2, and prototype
To find the correlation between the discharge coefficient and H/D for values below 0.045, statistical studies were conducted on the data from both the original model and the models. You can see the findings of the regression analysis in Table 1. They show that when H/D is less than 0.045, there is a correlation between H/D and the discharge coefficient. Similar to the relation in Eq. (17), the statistical analysis likewise showed a highly significant association between the Froude number and the discharge coefficient.
The discharge coefficient values for both the prototype and Model (2) are near 0.40 when H/D > 0.0451. On the other hand, when H/D < 0.0451, the statistical analysis revealed a relationship between Cd and H/D for the prototype and Model (2), as illustrated in Eqs. (20) and (21) respectively.
For model (2):
Cd =0.136 + 4.75*(H/D), (H/D) < 0.0451 (20)
For prototype:
Cd = 0.33 + 1.37*(H/D), (H/D) < 0.0451 (21)
Table 1. Statistical analysis of Cd and H/D
|
I |
Coefficients |
Standard Error |
t-Stat. |
P-value |
|
|
Intercept |
0.136 |
0.018 |
7.23 |
8.9E-05 |
Model 2 |
|
H/D |
4.748 |
0.528 |
8.99 |
1.8E-05 |
|
|
Intercept |
0.334 |
0.015 |
21.93 |
5.8E-07 |
Prototype |
|
H/D |
1.373 |
0.500 |
2.74 |
0.033 |
The dimensional analysis revealed that the discharge coefficient is dependable upon the Froude number, Reynolds number, Weber number, and H/D ratio and it has stabilized at approximately 0.4 for Reynolds numbers greater than 300,000. The prototype's discharge coefficient can be calculated without considering the Reynolds number since it has been reached.
The Weber number does not affect the discharge coefficient and is not statistically significant for values greater than 60 in Model (1) and 80 in Model (2). This proves that the discharge coefficient is unaffected by surface tension; however, it does show that the discharge coefficient changes for Weber values between 60 and 80. Now that Weber number independence has been achieved, the prototype's discharge coefficient can be calculated without taking it into account.
Regardless of the discharge value, the relationship between the measured discharge coefficients and the Froude number was evident. We will consider two models here. The scale ratio and weir head do not affect the linearity of the relation between the two parameters. The prototype's discharge coefficient-Froude number relationship is identical to all models.
Ultimately, the relative head-to-diameter and the Glory weir discharge coefficient are affected by the flow regime as well as other variables such as approach velocity and viscosity. The glory weir discharge coefficient, on the other hand, when H/D values greater than 0.0451, the discharge coefficient is very constant and equal to 0.4 for models and prototype, and Eqs. (18) and (19) were determined for H/D less than 0.0451.
More research and future studies are needed to fully understand the hydraulic aspect of the Morning Glory Spillway and enhance the scientific understanding of air blowing in a full-scale model. Also, study the measures that reduce the size of the air gaps inside the tunnel.
[1] Chanson, H. (2004). Hydraulics of rectangular dropshafts. Journal of Irrigation and Drainage Engineering, 130(6): 523-529. https://doi.org/10.1061/(ASCE)0733-9437(2004)130:6(523)
[2] Zhao, C.H., Zhu, D.Z., Sun, S.K., Liu, Z.P. (2006). Experimental study of flow in a vortex dropshaft. Journal of Hydraulic Engineering, 132(1): 61-68. https://doi.org/10.1061/(ASCE)0733-9429(2006)132:1(61)
[3] Sabeti, P., Karami, H., Sarkardeh, H. (2019) Analysis of the impact of the effective length of Morning Glory Spillway on its performance (numerical study). Instrumentation Mesure Metrologie, 18(2): 211-221. https://doi.org/10.18280/i2m.180217
[4] Fais, L.M.C.F., Genovez, A.I.B. (2009). Discharge rating curve, and scale effects correction in morning glory spillways. Advances in Water Resources and Hydraulic Engineering, 2041-2046. https://doi.org/10.1007/978-3-540-89465-0_350
[5] Heller, V. (2011). Scale effects in physical hydraulic engineering models. Journal of Hydraulic Research, 49(3): 293-306. https://doi.org/10.1080/00221686.2011.578914
[6] Kobus H. (1980). Hydraulic Modelling. German Association for Water Resources and Land Improvement. Hamburg, Berlin: Verlag Paul Parey.
[7] Chanson, H., Chachereau, Y. (2013). Scale effects affecting two-phase flow properties in hydraulic jump with small inflow Froude number. Experimental Thermal and Fluid Science, 45: 234-242. https://doi.org/10.1016/j.expthermflusci.2012.11.014
[8] Pinto, N.L., Neidert, S.H. (1982). Model-prototype conformity in aerated spillway-flow. In International Conference on the Hydraulic Modelling of Civil Engineering Structures, Coventry, England, pp. 22-24.
[9] Sarginson, E.J. (1972). The influence of surface tension on weir flow. Journal of Hydraulic Research, 10(4): 431-446. https://doi.org/10.1080/00221687209500034
[10] Musavi-Jahromi, S.H., Hajipour, G., Eghdam, M. (2016). Discharge coefficient in the morning glory spillways due to longitudinal angles of vortex breakers. Bulletin of Environment, Pharmacology and Life Sciences, 5(5): 34-41.
[11] Sayadzadeh, F., Musavi-Jahromi, S.H., Sedghi, H., Khosrojerdi, A. (2020). Pyramidal vortex breakers influences on the flow discharge of morning glory spillway. Ain Shams Engineering Journal, 11(2): 455-463. https://doi.org/10.1016/j.asej.2019.08.013
[12] Kolkman, P.A. (1984). Considerations about the accuracy of discharge relations of hydraulic structures and the use of scale models for their calibration. Waterloopkundig Laboratorium.
[13] Haghbin, M., Sharafati, A., Aghamajidi, R., Asadollah, S.B.H.S., Noghani, M.H.M., Jalón, M.L. (2022). Determination of discharge coefficient of stepped morning glory spillway using a hybrid data-driven method. Flow Measurement and Instrumentation, 85: 102161. https://doi.org/10.1016/j.flowmeasinst.2022.102161
[14] Alfatlawi, T.J., Alshaikhli, H.I. (2015). Prediction the coefficient of discharge for stepped morning glory spillway using ANN and MNLR approaches. International Journal of Civil and Environmental Engineering, 37(2): 1701-8285.
[15] Camargo, S.A., Dpelling, O.R., Varas, E.A. (2006). A mathematical model of morning glory spillways using artificial neural networks. In Proceedings of the International Symposium on Hydraulic Structure, IAHR, Ciudad Gujana, Venezuela.
[16] Kamanbedast, A.A. (2012). The investigation of discharge coefficient for the morning glory spillway using artificial neural network. World Applied Sciences Journal, 17(7): 913-918.
[17] Kashkaki, Z., Banejad, H., Heydari, M. (2018). Application of ANN in estimating discharge coefficient of circular piano key spillways. Journal of Soft Computing in Civil Engineering, 2(3): 39-49. https://doi.org/10.22115/scce.2018.118311.1048
[18] Othman, L.S., Abdulrahman, K.Z. (2024). Advancements in flow behavior investigation and performance enhancement of morning glory spillways: A systematic review of numerical and physical models. Iranian Journal of Science and Technology, Transactions of Civil Engineering, 48(3): 1191-1225. https://doi.org/10.1007/s40996-023-01249-w
[19] Genovez, A.I.B. (1997). Evaluation of limit lenght in the study of air entrainment in shaft with morning glory entrance. UNICAMP. Campinas, Portuguese.
[20] Gouryev, A.P., Brakeni, A., Beglarova, E.C. (2020). Discharge coefficient of shaft spillway under small heads. LARHYSS Journal, 42: 23-39.
[21] Nohani, E. (2015). Laboratory investigation of downstream submergence of shaft spillway on discharge efficiency. Science International, 27(3): 2301.
[22] Aghamajidi, R., Jahromi, H.M., Seghi, H., Kashkoi, H.A. (2013). Study effect of guide pier and stepped chamber on flow regime of morning glory spill way. International Journal of Agriculture and Crop Sciences, 6(9): 493.
[23] Aydin, M.C., Ulu, A.E. (2023). Numerical investigation of labyrinth-shaft spillway. Applied Water Science, 13(4): 89. https://doi.org/10.1007/s13201-023-01896-4
[24] Pfister, M., Chanson, H. (2012). Scale effects in physical hydraulic engineering models by Valentin Heller. Journal of Hydraulic Research, 50(2): 244-246. https://doi.org/10.1080/00221686.2012.654671
[25] Boes, R.M., Hager, W.H. (2003). Two-phase flow characteristics of stepped spillways. Journal of Hydraulic Engineering, 129(9): 661-670. https://doi.org/10.1061/(ASCE)0733-9429(2003)129:9(661)
[26] Othman, L.S., Ibrahim, H.M. (2017). Simulation-optimization model for Dokan reservoir system operation. Sulaimania Journal for Engineering Sciences, 4(5): 7-25.
[27] Daggett, L., Keulegan, G. (1974). Similitude conditions in free-surface vortex formations (flow tests using cylindrical tanks with adjustable vanes). Journal of the Hydraulics Division, 100(11): 1565-1580.
[28] Jain, A.K., Garde, R.J., Ranga Raju, K.G. (1978). Vortex formation at vertical pipe intakes. Journal of the Hydraulics Division, 104(10): 1429-1445. https://doi.org/10.1061/JYCEAJ.0005087
[29] Nohani, E. (2014). An experimental study on the effect of vortex breakers on discharge coefficient for the shaft spillways with sharp edge and wide edge. Journal of Civil Engineering and Urbanism, 4(5): 546-549.