Abdul Wahid Hasyim*![]() | Ismu Rini Dwi Ari
| Ismu Rini Dwi Ari![]() | Eddi Basuki Kurniawan
| Eddi Basuki Kurniawan![]() | Lenna Kriswati | Mohammad Nouval Irfandhia Wahid
| Lenna Kriswati | Mohammad Nouval Irfandhia Wahid![]() | Andik Isdianto
| Andik Isdianto![]()
© 2024 The authors. This article is published by IIETA and is licensed under the CC BY 4.0 license (http://creativecommons.org/licenses/by/4.0/).
OPEN ACCESS
Urban flooding poses a significant challenge in Malang City, particularly within unplanned settlements where rapid urbanization and inadequate infrastructure intensify flood risks. This study evaluates flood vulnerability by integrating object-based classification with multivariate analysis, focusing on the effects of land cover types, slopes, elevations, rainfall intensity, and NDWI on flood occurrences. Using advanced remote sensing with high and medium resolution imagery, coupled with Multiple Linear Regression Analysis, the research quantifies the influence of these factors on flood potential. The findings reveal that built-up areas significantly increase flood risk, as evidenced by a high positive regression coefficient (β = 0.580), while open spaces and vegetation, such as fields and trees, strongly mitigate flood risk (β = -0.653 for rivers, β = -0.401 for fields). The model explains 84.7% of the variability in flood vulnerability (R² = 0.847), indicating the substantial impact of environmental and urban factors. These results emphasize the need for urban planners to integrate flood risk management into city planning, particularly through the preservation of green spaces and the enforcement of stricter zoning regulations. Such strategies are crucial for enhancing urban resilience to flooding and advancing sustainable development goals, particularly SDG 11 (Sustainable Cities and Communities) and SDG 13 (Climate Action).
urban flooding, environmental risk assessment, remote sensing applications, land use planning, flood risk mapping, unplanned urban areas, sustainable urban development, disaster mitigation
Flooding is a common disaster in both urban and rural areas. However, in urban areas, the occurrence of floods are unique because of built-up land which are in line with an increase in population density. In addition, rainfall intensity and duration are also main causal factors [1, 2]. The impacts of flooding are prominent in densely populated urban areas, with the worst impacts felt within unplanned settlements [3]. Unplanned settlements are informal settlements built in areas that are not in accordance with the laws and regulations in the Detailed Spatial Plan of the local area [4, 5]. The existence of unplanned settlements is defined in the phenomenon of urban sprawl, which is the uncontrolled expansion of urban growth, where it mostly occurs in areas by water sources where it mostly occurs in areas by water sources especially rivers [6]. Unplanned settlements, which are often characterized by a lack of compliance with development control mechanisms and the construction of illegal structures, pose a major challenge in many urban areas [7]. These settlements usually start with illegal residences and may grow to form populated areas [8].
The development of Malang as a city of education, tourism, and industry has led to urban growth and increased population density. Malang City is known to have many universities, namely 8 state universities and 28 private universities [9]. Apart from that, there are 17,220 industries in the city which makes it the third largest in East Java Province [9]. This has an impact on the fulfillment on the need for space for activities that continues to increase. Thus, urban growth began to move away from the city center by spreading out to the outskirts of Malang City, and some of this growth resulted in the emergence of unplanned settlements [10]. Within the unplanned settlement area there are also several houses or settlements that are considered slums. The survey results in each urban village in Malang City show that there are 31 urban villages that are indicated as slums based on the Regulation of the Minister of Public No.14/2018 [11]. The slum locations are scattered in each sub-district in Malang City totaling 317 neighborhoods with a total area of 282.33 Ha. Which stated that 29 were found in a total of 57 sub-districts, is categorized as a slum area. The most numerous slum areas in the Malang City were identified found in the Lowokwaru sub-district area [12]. In addition, the data from the Regional Agency for Disaster Management (BPBD Malang City) states that there are 20 flood location in Malang that always experience flooding every rainy season [13]. These floods lasts for a short duration, but also has a negative impact on the citizen of Malang. Based on public perception, losses from flood disasters result in property and human casualties [14]. This also gave rise to opinions among the public that community involvement in the process of formulating policies for implementing spatial planning in the form of statutory regulations in the city of Malang related to flood management has not been optimized, giving rise to many development violations which have resulted in flooding in the city of Malang [15].
Areas in the Malang City study area dominant with a moderate or vulnerable level of vulnerability with a percentage of 63.0885% of the total area of Malang City or an area 6777.0180 Ha. Distribution of vulnerable areas Flood disasters in Malang City tend to be at an altitude of between 400 – 475 m and are close to rivers that has the potential for high levels of runoff [16]. The Regional Disaster Management Agency (BPBD) recorded 29 points affected by flooding in Malang City, East Java. The floods, which reportedly also damaged several infrastructures, were triggered by high-intensity rain from noon to evening.
As a result, flooding occurred at a number of points in five sub-districts in Malang City. In Blimbing Subdistrict, flooding occurred on Sulfat Street and Sunandar Priyo Sudarmo Street. In Lowokwaru Subdistrict, flooding occurred on Raya Sudimoro Street, Raya Tlogomas Street. Then Sansiviera Street, Bunga Cokelat Street, Semanggi Barat Street, Soekarno Hatta Street, Dam Sutami Street and Simpang Gajayana Street. In Klojen Subdistrict, floods inundated Semeru Street, Veteran Street, Bondowoso Street, Trunojoyo Street, Bandung Street, Mayjend Pandjaitan Street, Bareng Raya Street and Galunggung Street. Flooding also occurred in the basement area and the first floor of Malang Town Square Mall (Matos). Furthermore, in Sukun Subdistrict, floods inundated Raya Candi II Street, Raya Candi III Street, Simpang Mega Mendung Street, Bandulan Street to Sigura Gura Residence Housing on Bendungan Palasari Street. In Kedungkandang Subdistrict, flooding occurred on Danau Ranau Street, Danau Toba Street, Danau Maninjau Raya Street, Colonel Sugiono Street and Danau Kerinci Street [17].
Based on these events, a study is needed to determine the most influential factors in unplanned settlements on flood vulnerability in Malang City. The delineation of unplanned settlements is also based on several criteria that are determined based on expert references [18, 19]. The data used was a statistical spatial database obtained using remote sensing technology. The main source of processed data is the digital number value contained in a satellite image from the recording of reflected waves emitted to the Earth's surface and then recaptured by the satellite in the form of a raster image and limited by the delineation of unplanned settlements [20, 21]. The results of the data compilation would be analyzed using multiple linear regression analysis. The coefficient values would determine the strength and direction of the influence of each variable in the form of a model [22, 23].
This research can provide solutions to research gaps, and is unique in combining object-based classification and the use of multivariate analysis to assess flood vulnerability in unplanned settlements, especially those that occur in Malang City. This study uses remote sensing technology with high and medium resolution, and multiple linear regression analysis to quantitatively identify the influence of environmental and urban factors, this is something that is rarely discussed in previous research. This unique approach to solving the problem of unplanned settlements can provide new, more accurate insights for city planners in determining more effective and sustainable flood mitigation strategies.
This research directly supports SDG goal 11, namely "Sustainable Cities and Settlements," with a focus on efforts to reduce the risk of flood disasters in urban areas, especially in unplanned settlements. This study is also in line with SDG target 13, namely "Action on Climate Change," by providing insight into the existence of urbanization and land use changes that directly influence flood vulnerability, as well as the importance of integrating climate risk mitigation into the preparation of urban spatial planning documents.
2.1 Delineation of research location
This research study used grid delineation boundaries in unplanned settlements in Malang. The delineation of unplanned settlements are determined using 5 criteria, which are:
These criteria are used to identify unplanned settlement areas, which are formed as grid units using GIS software and some supporting data, namely Google Earth imagery and Shapefile data [8, 24]. However, there are some exceptions to these criteria, such as land with public service, education, and industrial functions that cannot be classified as unplanned settlement areas.
Unplanned settlements often form residential spaces built in areas that are not officially planned as residential spaces. The most prominent characteristic of unplanned settlements is that they are seen in low quality residential buildings that do not have adequate infrastructure and social facilities [4]. Several slum locations are included in the Unplanned Settlement delineation. Slums can also be identified based on physical characteristics, including high population of density > 1,250 people/H, layout very irregular, building density reaches high levels of 250 or more per hectare, narrow house shape, poor sanitation and poor building quality and damage. Another feature of the settlement. Slums are also associated with industrial areas, next to the train tracks, close to the center of activity, and water areas [25].
2.2 Research variables
Each research grid includes variables such as built-up land, open land, trees, rivers, rice fields, slope, elevation, and rainfall that could cause flooding in unplanned settlements [26, 27]. Table 1 shows the variables that were used.
Table 1. Variables
|
Variables |
Units |
Required Data |
|
Extent of Land Cover
|
Percentage (%) |
Sentinel 2A raster imagery with the acquisition date 08/04/2022 |
|
Land slope |
Percentage (%) |
Raster DEM of Malang City |
|
Elevation of the terrain |
Meters above sea level (msl) |
Raster DEM of Malang City |
|
Rainfall intensity |
Millimeter (mm) |
BMKG rainfall data Malang City |
|
NDWI area |
Percentage (%) |
Sentinel 2A raster imagery with acquisition date 08/04/2022 |
Source: Study Result, 2022.
2.3 Data collection method
This study employs the remote sensing method to collect primary data that will be processed further in multiple linear regression analysis. The remote sensing method uses satellites to collect information data about the earth's surface without the need for direct physical contact at the desired location [8]. Sentinel, which provides satellite imagery known as Sentinel 2A, was chosen for this study. The sharpness resolution of Sentinel 2A satellite imagery is 10 x 10 meters, which provides more detailed land cover information than other satellite imagery. The Sentinel 2A satellite image used in this study was acquired on April 8, 2022, because that date was chosen because it was the date of the flood in Malang City that was expected to have the greatest impact. The images were processed using a supervised classification method that relies on a training sample to classify land cover. Maximum Likelihood Classification, which uses the level of pixel similarity to identify pixels into predetermined classes, is the name given to this guided classification process. Other researchers most commonly use Maximum Likelihood Classification, which is the most accurate guided classification method. This is based on calculating the similarity of each pixel under the assumption that homogeneous objects always have a normally distributed histogram.
Secondary data was obtained from the Sub-National Development Planning Agency (BAPPEDA Malang City) in the form of slum location points and flood location points in Malang City. Secondary data comes in the form of shapefiles, reports, and table data that have been recognized by related parties and are used to delineate unplanned settlement areas.
2.4 Slope and topography data collection
The Malang City raster DEM is used to provide spatially statistical slope and topography (land elevation). In Malang City, elevation and slope data are obtained by processing DEM or SRTM images. DEM data will be processed using GIS software and calculated in percentage (%) units. Analyzing a topographic map can reveal an area's slope [28].
To prove the correctness of the image results using field conditions, kappa accuracy was carried out to prove the accuracy of land cover classification in real conditions [12].
Table 2. Kappa accuracy test
|
Kappa (%) |
Agreement |
|
<0 |
Less than change agreement |
|
1-20 |
Slight agreement |
|
21-40 |
Fair agreement |
|
41-60 |
Moderate agreement |
|
61-80 |
Substantial agreement |
|
81-99 |
Almost perfect agreement |
Table 2 explains the percentage of the kappa accuracy test. And in this study it has an accuracy value of 91% where the data taken is very close to the original field conditions.
2.5 NDWi map generation
NDWI values are calculated by converting Landsat Multispectral Image data into a Normalized Difference Water Index with a scale of -1 (low density) to +1 (high density). When it rains, the NDWI distribution map will be used to detect the location of water (flooding) or puddles in Malang City. Furthermore, data from image processing using GEE (Google Earth Engine) supports the accuracy of the distribution of flood locations in Malang City [24, 29].
2.6 Data analysis
The evaluative analysis stage employs Multiple Linear Regression Analysis to combine the scoring of the independent variables, namely: land cover, slope, rainfall intensity, NDWI, and elevation, in order to determine the influence of each independent variable (X) on the dependent variable (Y), namely the presence of waterlogging, with justification from previous studies. With the scope of the Unplanned Settlement grid, data compilation was performed on the matrix data contained in each thematic map. The data compilation results are variable values that will be used as input for Multiple Linear Regression analysis to determine the value of the influence of independent variables on the dependent variable, namely the extent of flooding per Unplanned Settlement grid.
3.1 Unplanned settlement delineation
The number of unplanned settlement research grids discovered was 284, with each grid measuring 250m × 250m and covering an area of 62,500 m2. The size of 250m × 250m is based on the size of the settlement block, which is subjectively thought to represent the character of parcel distribution in one area. Thus, the unplanned settlement area's total delineation area is 17,750,000 m2. Each delineation grid has a variety of physical settlement characteristics, particularly in the morphology of neighborhood buildings.
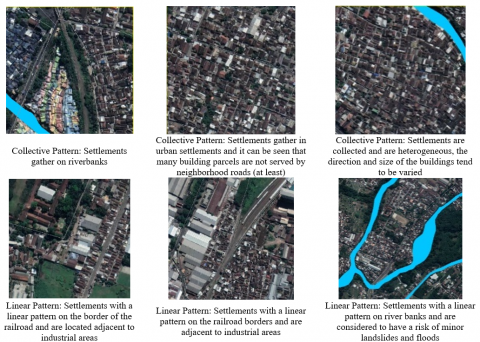
The density of the building, the pattern of the road network, as well as the direction (facing) of the building and the size of the building, which tends to be heterogeneous as in the community village, all contribute to the diversity of the physical character of the building. The physical condition of the settlements is more homogeneous and neater than the morphology of building parcels in Well Planned Settlement. This can be seen in the grid-shaped road network, homogeneous building sizes, and lower building density. The distribution of unplanned settlement areas is shown below.
According to Figure 1, the unplanned settlement delineation grid is almost evenly distributed in Malang City, particularly in densely populated urban areas rather than on mountain slopes. The majority of the Unplanned Settlement delineation grids are scattered in areas with a lot of heterogeneous parcels that are not served by neighborhood roads and are only served by narrow roads, and it is very clear on the image that the Unplanned Settlement appears to have almost no road network in a collection of parcels in one area. Furthermore, the pattern of Unplanned Settlement can be divided into two settlement pattern characteristics: collective and linear. Linear Unplanned Settlement is commonly found in areas near collector roads, railroad borders, and river borders. While the village area has a collective settlement pattern.
Figure 1. Three heat sources map of unplanned settlements delineation results for Malang City 2022
It can be seen in the figure that the Kedungkandang area has a large unplanned settlement area compared to other sub-districts in Malang city. Meanwhile, Blimbing sub-district has fewer unplanned settlement areas.
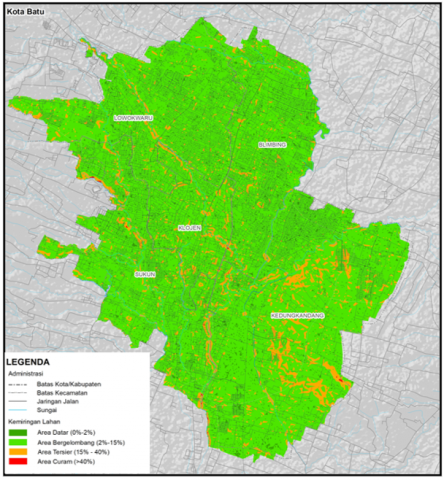
It should be noted that several slum locations are included in the Unplanned Settlement delineation, as shown in Figure 2. This reinforces the fact that Unplanned Settlement has a relationship with slums. A slum is a general impression or description of low attitudes and behavior as seen from the middle class's standard of living and income [25]. Slums, in other words, can be interpreted as a signal from the established upper class to the unestablished lower class. Slums are a deterioration or damage to the environment from both a physical and a community/social standpoint, namely disturbances caused by natural elements such as water and air, as well as disturbances caused by humans themselves such as traffic density and garbage [30-32].
In this study, slums are only mentioned as background information for further research, in order to provide the findings of the relationship between Unplanned Settlement, slums, and flood locations. The distribution points of slum house locations in Malang City are shown below, overlaid with Unplanned Settlement delineation grid shapefile data.
Figure 2. Malang City unplanned settlements settlement pattern 2022
3.2 Malang City land cover
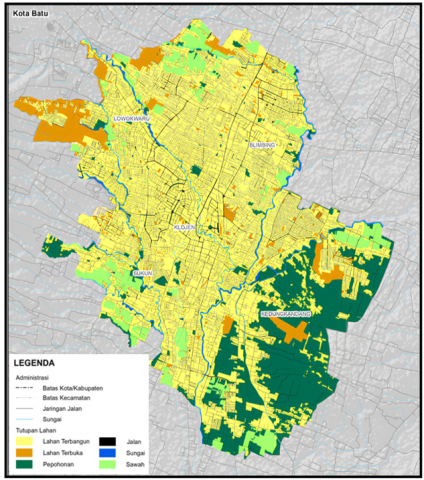
The interpretation results produced after processing Sentinel 2A rasters reveal the land cover in Malang City. The raster used has an acquisition date of April 8, 2022. Land cover classification was performed on the processed Malang City raster with the Malang City area as a whole in mind. The images were processed using a supervised classification method that relies on a training sample to classify land cover. The Maximum Likelihood Classification process is used for guided classification, which uses pixel similarity to identify pixels into predetermined classes. Maximum Likelihood Classification is the most accurate guided classification method and is used by the majority of researchers [33]. The classification of land cover that is interpreted broadly is the distinction between vegetated and non-vegetated areas. In this study, vegetation areas are classified as grassland, shrubland, sparse tree vegetation, and dense tree vegetation. While non-vegetated land cover in this study is represented by open land and built-up land, as illustrated in Figures 3 and 4.
In Figures 3 and 4, it can be seen the distribution of land cover in Malang City. Land cover in Malang City is dominated by built-up land in four sub-districts, namely Lowokwaru, Sukun, Klojen, and Blimbing. Meanwhile, the Kedungkandang sub-district is still dominated by trees. The predominance of built-up land increases surface runoff and flood risk, while areas with vegetation help reduce this risk.
These results show the importance of maintaining green spaces with the aim of reducing flood risk, and this strongly supports sustainable urban planning. City planners really need to implement stricter and more precise regulations in managing development in dense areas, and consider always prioritizing the preservation and restoration of green open spaces, so that a more resilient urban environment can be achieved.
Figure 3. Land cover map of Malang City
Figure 4. Land cover map of unplanned settlements in Malang City 2022
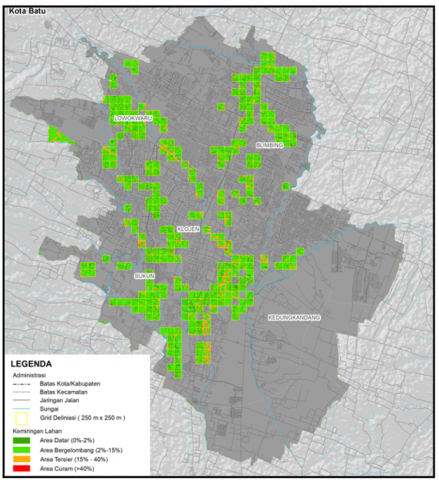
3.3 Malang City land slope
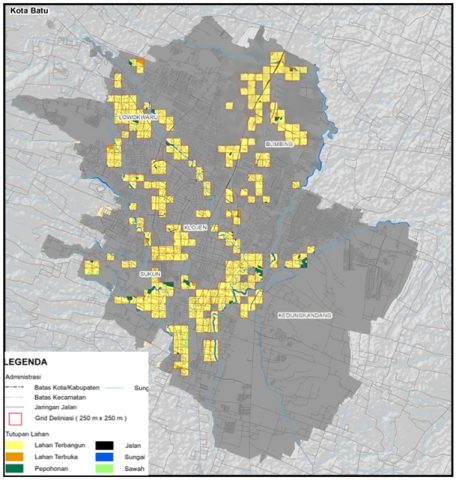
The slope is obtained in this study from the results of processing DEM or SRTM raster images using several features in ArcGIS software to produce a slope raster output with pixel accuracy in degrees [34, 35]. The accuracy and precision of slope calculations play a crucial role in terrain analysis, hydrological modeling, and land cover classification. The slope maps derived from DEMs provide valuable insights into the topographic characteristics of the terrain, enabling researchers to analyze landforms, assess terrain stability, and model surface processes.
Figure 5. Slope map of Malang City
Figure 6. Unplanned settlement slope map of Malang City
The slope map of Malang City, like the land cover map, must be overlaid with the Unplanned Settlement delineation grid shapefile data. This will display the slope conditions in the unplanned settlements area. This is intended to make the process of collecting data on the area of land cover in the Unplanned Settlement area more efficient. Figures 5 and 6 show the results of DEM data image processing that produced a slope distribution map of Malang City.
In Figures 5 and 6, it can be seen the distribution of Malang City with high to low slopes. The land elevation in Malang City is dominated by undulating slopes (2-15%). with some scattered areas having steep slopes (>40%). The slope of the land is a key factor in determining areas suitable for development, especially for built or unplanned residential areas. In this context, it can be seen that residential development in Malang City tends to be concentrated in certain locations that have relatively moderate to steep land slopes. The increase in building density in this area is a clear indication of increasing slum conditions.
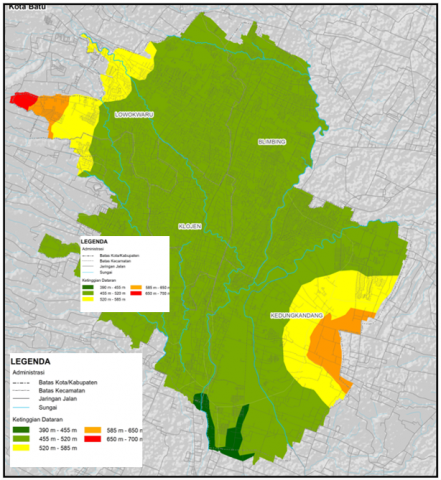
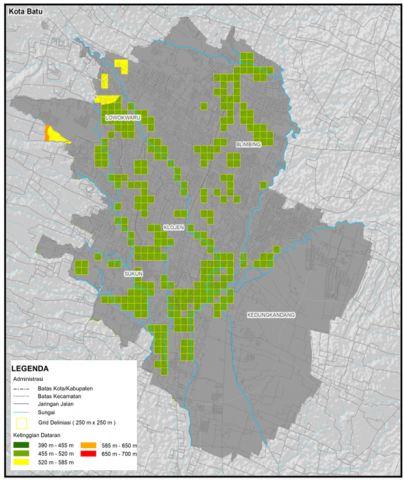
3.4 Malang City elevation
Digital Elevation Models (DEM) are essential in geospatial analysis, providing elevation or elevation information for a variety of applications. DEM accuracy is critical for reliable elevation estimation and terrain modeling. Techniques such as grid-based DEM analysis, vertical accuracy assessment, and elevation model comparison are used to evaluate the quality and precision of DEM [36].
Figures 7 and 8 show the results of DEM data image processing that produced a slope distribution map of Malang City. It can be seen the distribution of the city of Malang with high to low land elevations. land elevations in the city of Malang are dominated by elevations of 455-520 m. The Malang City still has the potential for flooding because there is still higher ground in the area around the Malang City.
The elevation factor of an area must be considered in the spatial planning of Malang City. City planners need to protect low-elevation areas through good drainage infrastructure and preservation of green open spaces aimed at increasing water absorption. The focus of flood risk mitigation in a city must be directed at areas that have high risk, with the aim of reducing negative environmental and social impacts, so that it can support the development of a more resilient and sustainable city.
Figure 7. Malang City altitude map
Figure 8. Unplanned settlement slope map of Malang City
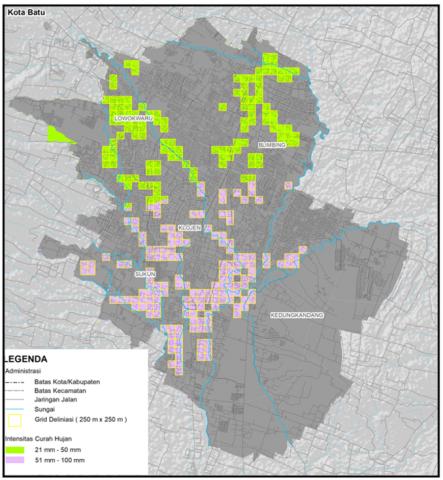
3.5 Malang City climates
Rainfall intensity data is required because it is one of the variables that influences flood vulnerability or the occurrence of inundation in a given area. Data on the distribution of rainfall intensity in Malang City was obtained from the BMKG Malang City website by obtaining data on the distribution of rainfall intensity in Malang City in 2022, adjusted to the date of acquisition of Sentinel 2A raster data. Data on the distribution of rainfall intensity in Malang City was manually digitized using ArcGIS software; this was necessary because the website does not provide rainfall intensity shapefile data, as shown in Figures 9 and 10.
Figure 9. Malang City rainfall map
Figure 10. Map of rainfall in unplanned settlement of Malang City
In Figures 9 and 10, it can be seen the distribution of Malang City with high to low rainfall. in the northern part of the city of Malang (Lowokwaru and Blimbing) is dominated by rainfall of 21–50 mm and is classified as moderate. whereas the southern part of Malang City (Klojen, Sukun, and Kedungkandang) is classified as high with rainfall of 51–100 mm.
On the rainfall factor, Malang City has a rainfall intensity that is not classified as high in the northern area. But there is high rainfall in the south, and this is an area with dense residential areas. On one side, the drainage in Malang City is insufficient or adequate during the rainy season. So there are still areas that experience flooding, and this happens in dense settlements. Malang city planning must make rainfall variations an important consideration, with a focus on improving drainage infrastructure in areas that have high rainfall and high residential density. The high potential risk of flooding can be overcome by preserving green open spaces, to support sustainable city development.
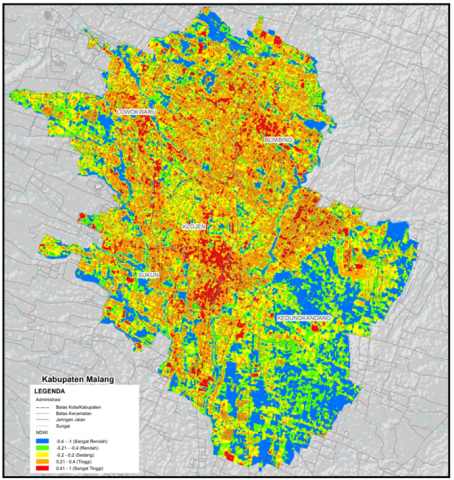
3.6 Malang City NDWI
Normalize Difference Vegetation Index (NDVI) is an index of greenness or photosynthetic activity of vegetation, and one of the most frequently used vegetation indices. NDVI will later be used to obtain vegetation density distribution values in Malang City. The NDWI distribution value is required because it is one of the variables that causes an increase in flood proneness. The NDWI value is used as one of the variables in this study, despite the fact that it has little logical influence. Several references in the context of GIS and spatial map processing, however, support the use of the NDWI value to measure the distribution of inundation during heavy rainfall, but only between the time of the event and the date and time of Sentinel 2A raster data acquisition. The results of NDWI raster data processing are supported in this study by the results of NDWI Calculation using GEE (Google Earth Engine), as shown in Figures 11 and 12.
Figure 11. NDWI map of Malang City 2022
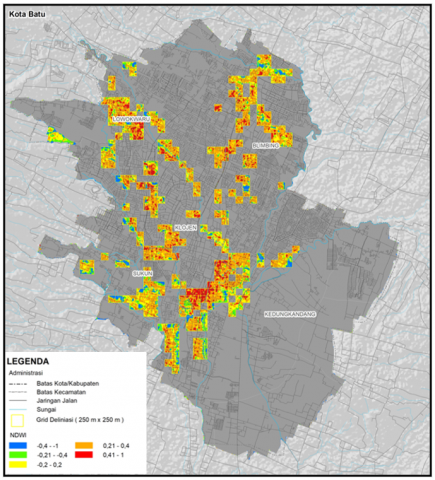
Figure 12. Map of NDWI in unplanned settlements 2022
The NDWI value is utilized to assess the distribution of inundation during heavy rainfall in Malang City. Figure 11 and Figure 12 show the distribution of areas that have high or even low rainfall, by comparing it with the density of vegetation in the area. With the high density of vegetation, it can be seen which areas in Malang City have the potential for flood disasters.
On the NDWI map, there is a map of the distribution of existing vegetation. In Malang City, specifically in the central area, built-up land has been filled, including unplanned settlements, which causes flood disasters in central urban areas. The difference is that as you move away from the city center, there is still a lot of vegetation, which reduces the impact of high rainfall. and as the years go by, the demand for settlements also increases, which, if not monitored properly, will result in more unplanned settlements than the amount of existing vegetation.
These NDWI results show the importance of maintaining and increasing the existence of green open space in Malang City, especially in areas that have dense built-up land and are very vulnerable to waterlogging. Urban planners must be able to focus on effective stormwater management and preservation of vegetation conditions, with the aim of reducing the risk of inundation and supporting more sustainable urban development.
3.7 Multiple Linear regression analysis
The Multiple Linear Regression method was used in this study to calculate the effect value of each independent variable on the dependent variable. Previously, however, a classical assumption test on the compilation of research variable data was required. The results of the classical assumption test on the data compilation in this study are as follows:
The Durbin Watson value is 2.055, as shown in the summary model in Table 3. When compared to the Durbin Watson Table with the limits of the dL and dU values on the number of samples n = 284 and the number of variables n = 8, the result is that the autocorrelation problem is avoided.
Table 3. Model summary
|
Model |
R |
Std. Error of the Estimate |
Durbin-Watson |
|
1 |
0.877a |
8.55082 |
2.055 |
Table 4 shows that the VIF (variance inflation factors) values on all predictor variables are less than 10, indicating that the independent variables used avoid multicollinearity issues.
Table 4. Coefficience
|
|
Model |
Sig. |
Collinearity Statistics |
|
|
Tolerance |
VIF |
|||
|
1 |
(Constant) |
0.000 |
|
|
|
|
X1 |
0.000 |
0.958 |
6.002 |
|
|
X2 |
0.000 |
0.991 |
1.044 |
|
|
X3 |
0.000 |
0.937 |
1.009 |
|
|
X4 |
0.000 |
0.959 |
1.068 |
|
|
X5 |
0.000 |
0.667 |
1.043 |
|
|
X6 |
0.021 |
0.907 |
1.499 |
|
|
X7 |
0.008 |
0.662 |
1.103 |
|
|
X8 |
0.002 |
0.958 |
1.510 |
The normality test in Table 5 is used to determine whether or not the data is normally distributed. Normally, this means that the significance level is less than 5% or 0.05.
Table 5. Kolmogrov Smirnov
|
Unstandardized Residual |
||
|
N |
|
284 |
|
Normal Parametersa,b |
Mean |
0.0000 |
|
|
Std. Deviation |
7.96131704 |
|
Kolmogorov-Smirnov Z |
|
1.398 |
|
Asymp. Sig. (2-tailed) |
|
0.200 |
The results of the Kolmogrov Smirnov test on the research data using SPSS show that the data is normally distributed, as indicated by a sig value greater than 0.05 or 5%, namely 0.054. A sig value greater than 0.05 indicates that it is not significant, or that the data is relatively similar to the average, and thus it is referred to as normal.
Table 6. Glesjer
|
|
Model |
Standardized Coefficients |
t |
Sig. |
|
Beta |
||||
|
1 |
(Constant) |
0.07 |
3.012 |
0.003 |
|
|
X1 |
0.580 |
-10.408 |
0.570 |
|
|
X2 |
-0.307 |
-11.845 |
0.000 |
|
|
X3 |
-0.344 |
-21.856 |
0.000 |
|
|
X4 |
-0.653 |
-13.602 |
0.000 |
|
|
X5 |
-0.401 |
1.556 |
0.000 |
|
|
X6 |
0.055 |
-2.661 |
0.121 |
|
|
X7 |
-0.081 |
1.128 |
0.008 |
|
|
X8 |
0.040 |
-10.408 |
0.260 |
According to Table 6, the research data does not have heteroscedacity issues because the sig value of each independent variable exceeds 0.05, indicating that it is not significant. So that no variable exhibits symptoms of heterosecdacity.
Because the data does not fail the classical assumption test, it is ready to be analyzed using multiple linear regression methods. The following are the model results of the multiple linear regression analysis process:
Y = 0.07 + (0.580) X1 + (-0.307) X2 + (-0.344) X3 + (-0.653) X4 + (-0.401) X5 + (0.055) X6 + (-0.081) X7 + (0.040) X8
where,
Y= Flood Area (%)
X1= Built-up Area (%)
X2= Open Space (%)
X3= Trees (%)
X4= River (%)
X5= Field (%)
X6= Slope (Average)
X7= Land Height (Average)
X8= Rainfall (Average)
To determine the most influential factors in unplanned settlement areas on flood vulnerability, a three-stage model feasibility test (model reliability test, regression coefficient test, and determination coefficient test) was conducted. The model feasibility test results are as follows.
According to Table 7, the sig value is 0.000, which is less than the significance level of 5% or 0.05, implying that the regression model is adequate for explaining the influence of all independent variables on flood vulnerability.
Table 7. Anova
|
|
Model |
Sum of Squares |
Df |
Mean Square |
F |
Sig. |
|
1 |
Regression |
582.434 |
7 |
83.205 |
4.548 |
0.000a |
|
|
Residual |
4957.428 |
271 |
18.293 |
|
|
|
|
Total |
5539.863 |
278 |
|
|
|
According to Table 4, all independent variables have a prob.t value less than the significance value of 5% or 0.05, indicating that all independent variables have a significant influence on the dependent variable, namely flood vulnerability, with a confidence level of 95%, indicating that all independent variables are eligible to be independent.
According to Table 8, the proportion of influence of all independent variables on the dependent variable, namely flood vulnerability, is 0.847 or 84.7%. This is shown in the R Square column of the model summary table.
Table 8. Model Summary
|
Model |
R |
R Square |
Adjusted R Square |
|
1 |
0.920a |
0.847 |
0.843 |
3.8 Influence of environmental and urban factors on the percentage of flood area
Multiple linear regression analysis in this study assesses the influence of various environmental and urban factors on the percentage of flood area. Before delving into regression analysis, several classical assumption tests were carried out to ensure the validity of the model. The autocorrelation test shown by the Durbin-Watson value of 2.055 confirms that there is no autocorrelation in the data, thereby ensuring that the observations are not dependent on each other. The multicollinearity test as evidenced by the Variance Inflation Factor (VIF) values which are all below 10 proves that there is no excessive correlation between predictors, so that the integrity of the model is maintained [37]. Additionally, the normality test shows that the residuals are normally distributed, as indicated by the non-significant Kolmogorov-Smirnov results, and the heteroscedasticity test shows consistent variance across the entire data range, thus confirming the robustness of the model. The formulated regression equation, Y = 0.07 + 0.580X1 - 0.307X2 - 0.344X3 - 0.653X4 - 0.401X5 + 0.055X6 - 0.081X7 + 0.040X8, clearly quantifies the impact of each variable on flood vulnerability.
Positive coefficients for built-up area (X1) and rainfall (X8) indicate that an increase in these variables leads to an increase in flooded area, indicating the impact of urbanization and weather patterns. Urban expansion is associated with a significant increase in surface area and water runoff, resulting in more frequent flooding even with lower intensity rainfall [38]. Land cover transformation, especially an increase in built-up areas and impervious surfaces, has been associated with increased flood risk and reduced infiltration capacity, leading to increased flood events [39].
On the other hand, open space (X2), trees (X3), rivers (X4), and fields (X5) show negative coefficients indicating their role in reducing flood risk through water absorption and improving natural drainage. Open spaces and natural features such as trees and fields have been recognized for their ability to absorb water, reduce water runoff, and increase infiltration rates, thereby reducing the area that is flooded during heavy rains [40]. Trees and forests play an important role in reducing flood risk by increasing soil infiltration, canopy interception, and overall water retention capacity, thereby reducing the impact of urbanization on flood vulnerability [41]. In addition, the presence of rivers and natural drainage features contributes to water transport efficiency and flood mitigation, thus emphasizing the importance of preserving natural waterways in flood risk management [42, 43].
The overall reliability of the model and its explanatory power were confirmed by a significance F value of less than 0.05, indicating that the model predicted the dependent variable statistically significantly. The R-squared value of 0.847 indicates that about 84.7% of the variability in flood vulnerability is explained by the model, which underlines the large impact of environmental and urban factors on flood dynamics [44, 45]. This analysis not only highlights important areas for urban planning and environmental management, but also provides a quantitative basis for implementing targeted flood mitigation strategies in urban areas.
3.9 Management recommendations based on regression analysis
Based on the results of the regression analysis carried out, various adaptation and mitigation measures need to be carried out in Malang City, especially in unplanned settlements.
3.9.1 Infrastructure improvement
Improving infrastructure to manage flood risks effectively in urban areas involves a combination of constructing flood barriers and enhancing soil permeability. Strategies such as building levees, dikes, flood walls, and flood gates along riverbanks are crucial. Levees act as canalization works, limiting river connectivity with floodplains, raising water levels, and reducing the risk of water overflow, thereby helping to control and manage floods [46]. Additionally, flood walls and gates provide a physical barrier that can help prevent flood waters from inundating the surrounding area [47]. These structures, made from materials like earth, concrete, and steel, are designed to contain rising river levels and prevent overflow, thereby protecting adjacent residential and commercial areas. Residents and settlements along riverbanks and floodplains are at risk of inundation during flooding, and the implementation of effective flood mitigation measures such as embankments and embankments is essential to reduce the impact of flooding on these communities [48].
In addition, diversion canals play an important role by diverting excess water from populated areas, thereby reducing pressure on natural waterways. Diversion channels are superior to other flood management measures in certain areas, indicating the effectiveness of diversion channels in reducing flood risk [49]. Optimal river diversion scenarios have been proposed to increase the sustainability of urban deltas, indicating the importance of strategic planning in flood diversion projects [50]. However, challenges may arise in preventing urban development through these routes, especially if they are rarely used for flood transport [51]. Across these approaches, flood resilience can be improved, offering a comprehensive framework for managing flood risk in a variety of situations.
Increasing soil permeability in fields and open spaces is very important to increase rainwater absorption and reduce surface runoff. Collecting rainwater and installing permeable concrete can increase the absorption capacity of water entering the soil, purify the water runoff system, recharge groundwater, and the final result is minimizing the risk of flooding [52]. The use of permeable pavement systems on a sustainable basis is very effective in reducing peak flows and the volume of water runoff on the surface, this can even be done in areas with poor soil drainage [53].
Infrastructure improvements require large investments and very careful planning to ensure sustainability in the community can be implemented properly. Environmental impacts must also be carefully considered, such as potential changes to natural waterways and the existence of local ecosystems. The two main factors that control the spatial distribution of flash floods are the area of the water catchment area and the density of the drainage network, which really need to be considered in every city spatial plan [54]. Overall, implementing these strategies in residential areas can mitigate flood risks, increase the resilience and sustainability of the urban environment, protect property and life from the negative impacts of flooding that are so important to avoid.
3.9.2 Enhancing green spaces
Strategies to increase green space in urban areas, especially in unplanned settlements, are very important to mitigate flood risk. Parks, gardens, and even small areas of vegetated land, can naturally increase water infiltration into the soil and reduce surface water runoff, which is very important in preventing and reducing the risk of urban flooding [55, 56]. Trees, shrubs and grass have the natural ability to increase soil porosity and stabilize the soil, so they can help absorb more rainfall and also reduce land erosion, this is an important factor in maintaining the efficiency of urban drainage systems.
Implementing green space in dense urban environments can be a challenge, space limitations are the main issue that needs to be considered. However, innovative solutions such as green roofs and vertical gardens can help solve this problem, by implementing strategies using roofs and vertical surfaces as places to create absorbent areas that can retain rainwater. This vertical garden provides an opportunity for the community to utilize vertical surfaces to collect rainwater, thereby increasing water absorption and retention in residential environments [57]. Another alternative solution is permeable pavement which allows rainwater to seep into the ground without difficulty, thereby reducing runoff which would flood the urban drainage system. Permeable pavements are effective in reducing stormwater runoff in developed urban areas, indicating their important role in improving water flow and flood management [58].
In addition, building features such as rain gardens and bioswales in residential and commercial areas can serve to capture runoff and increase the natural absorption of rainwater. Rain gardens, which are multi-layered structures with vegetation cover, are designed to manage rainwater runoff from impervious surfaces such as roofs, sidewalks and car parks. This system directs rainwater to the garden to be filtered, retained, and slowly discharged into groundwater, the surrounding local drainage system, and into the reservoir [59]. Rain gardens can significantly improve the runoff response of suburban watersheds, making them a highly likely option in urban watershed management and restoration strategies, as they are cost-effective [60]. These installations not only have good function but also aesthetic appearance, so it can be concluded that they contribute to biodiversity and urban beauty. A larger scale initiative could be carried out by developing a community park with an integrated wetland or pond, which functions as a natural water reservoir when heavy rain occurs.
Formulating and integrating green space into city planning does not only function as a flood management strategy. If we can choose the right alternatives and strategies, the existence of this green space can improve the quality of life of its residents, enrich urban biodiversity, and create a more resilient and sustainable urban environment. The role of green space in urban infrastructure is something that deserves to be prioritized, so it is important for city planners to prioritize these features in their city planning strategies.
3.9.3 Urban planning
Strategic control is needed in integrating flood risk management into city planning and implementing drainage systems in built-up urban land areas. The use of flood vulnerability analysis can be done by developing flood mitigation strategies in land use planning [61]. Legislation discussing zoning must strictly limit development in flood-prone areas, while building regulations must require the construction of construction that is resistant to flood disasters. The implementation of zoning regulations is a very smart sustainable step to reduce the overall risk of flooding in flood-prone areas [62]. Urbanization, which has the impact of increasing residential density in traditional cities and low-income communities, has been identified as one of the factors that can worsen flooding in urban water catchment areas. This underscores the importance of zoning regulations in managing flood hazards in rapidly developing areas [63]. Prioritizing flood-prone areas through spatial data analysis is critical to identifying zones that require detailed assessment and implementing zoning laws to limit development in high-risk areas [64].
Effective land use planning should preserve natural waterways and direct urban growth away from flood-prone areas. Implementation of zoning laws that limit development in flood-prone areas, coupled with flood-resistant construction practices mandated by building codes, can help reduce flood risk and protect vulnerable areas [65, 66]. Limiting and not developing this area means that this area can carry out a natural flood control function. Developing an integrated policy framework aligning flood risk management with broader urban development goals such as sustainability and resilience.
3.9.4 Community engagement
Involving local communities in flood prevention strategies will significantly increase their effectiveness by ensuring that solutions are tailored to specific local conditions and historical flood patterns. Local communities play an important role in flood prevention strategies by providing valuable knowledge, mitigation strategies, and increasing community resilience [67]. Remembering and relating flood stories to personal experiences and practices can contribute to developing community resilience to future flood risks [68]. This approach emphasizes the importance of ongoing flood memory and lay knowledge in strengthening community resilience efforts.
Community participation enhances maintenance efforts and contributes to the overall effectiveness of flood prevention strategies. This engagement also increases residents' awareness and preparedness for flood events through education about vigilant monitoring of flood prevention infrastructure, leading to prompt identification and resolution of issues. Low community knowledge and ineffective law enforcement in controlling and protecting river borders are obstacles to community participation in spatial planning [69]. Involving local communities in flood prevention strategies allows the creation of solutions that are adapted to specific local conditions and historical flood patterns, thereby ultimately increasing the effectiveness of flood prevention efforts sustainable practices and emergency procedures [70].
Strengthened trust and cooperation between residents and local authorities improve communication and compliance with flood management measures. Increased engagement between local residents and authorities contributes to greater social trust, more local motivation, and ultimately real action towards flood preparedness on the part of local residents [71]. Ultimately, community involvement empowers residents, fosters a sense of ownership and responsibility that encourages the sustainability of flood risk management efforts and builds resilience in communities.
3.10 Limitations and future research
It is important to acknowledge several limitations in this study. First, the use of secondary data, such as rainfall data, elevation maps, and satellite images, can affect the accuracy of the analysis results. This secondary data, although very helpful, does not always describe the latest or real-time conditions of the study area, so it can reduce the precision of flood vulnerability predictions and modeling. Second, the focus of this study is limited to discussing one city, namely Malang City, which means that the results and findings from this research may not be completely generalizable to other regions that have different geographic characteristics, climate or spatial planning patterns. So further research is needed covering several cities or regions with varying conditions to strengthen the validity of the findings and increase their applicability in a wider context.
Despite these limitations, the results of this research have very important implications for sustainable urban development, which can be applied in urban areas that have almost the same characteristics as the city of Malang. The findings regarding the distribution of flood vulnerability and the important role of green open spaces, as well as effective water management can be used as a reference in urban spatial planning. City planners must be able to consider integrating environmental risk mitigation into city planning documents to reduce the impact of disasters and increase the city's resilience. Improving drainage infrastructure, preserving vegetation, and wiser management and regulation of land use are strategic steps that can be taken and used to realize more resilient and sustainable city development. In addition, further research in the future involving primary data and analysis in various cities that have different characteristics, will be very helpful in validating and expanding the application of these findings on a wider scale, so that more and more urban areas become better in the future.
In Malang City, unplanned settlement is almost evenly distributed, particularly in densely populated urban areas. The majority of Unplanned Settlements are dispersed in built-up land areas with heterogeneous physical conditions of parcels that are not served by neighborhood roads. The image clearly indicates that unplanned settlements lack a proper network and tend to cluster in specific areas. Furthermore, the pattern of Unplanned Settlement can be classified into two types: collective and linear. Linear Unplanned Settlement is commonly found in areas near collector roads, railroad borders, and river borders. While the village area has a collective settlement pattern.
The presence of slums in the Unplanned Settlement delineation also indicates that slums are included in the Unplanned Settlement category, where the Unplanned Settlement criteria must also be related to slums. However, this cannot be discussed further because slums require more in-depth analysis, such as social and economic conditions, which are not covered in this study.
According to the results of the Multiple Linear Regression analysis, slope is the independent variable with the highest negative coefficient value. As a result, the higher the value of the degree of slope, the lower the risk of flooding. However, keep in mind the role of variables in influencing flood vulnerability, such as land cover, particularly built-up land, which has the highest positive coefficient value. As a result, the greater the percentage of built-up land cover in an area, the greater the risk of flooding. This is due to the lack of water absorption areas in the area, such as open land and trees.
Furthermore, the open land and trees variable has a relatively high negative influence value, implying that the more open land or trees there are in an area, the lower the potential for flooding or inundation of rainwater. When compared to other land cover variables, rivers and rice fields have no significant influence value, so rivers and rice fields have little impact on the potential for flooding in an area. Many areas with watersheds are frequently observed to have inundation or flooding.
Based on the model's interpretation, stakeholders will need to engage in planning activities to anticipate flooding in Malang City in a variety of ways:
The results of this research have very significant implications for achieving SDG targets, especially SDG 11 and SDG 13. Implementation of flood risk-based spatial zoning regulations and improving drainage infrastructure standards recommended in this study will greatly help reduce vulnerability to disasters in urban areas, supporting development a more resilient and sustainable city. In addition, preserving and increasing the existence of green open spaces as part of a flood mitigation strategy also supports global efforts to deal with climate change, in accordance with SDG 13 targets.
Therefore, this research not only contributes to the existing scientific literature, but also offers practical solutions that can help cities with similar characteristics in all parts of the world, to achieve overall sustainable development goals. It is hoped that the resulting model can be used as material in making development policies for these cities to overcome flooding problems caused by unplanned settlements in their cities.
[1] Innis, P.G. (2023). Official risks and everyday disasters: The interplay of riskscapes in two unplanned settlements Monrovia. Urban Forum, 34(1): 53-77. https://doi.org/10.1007/s12132-022-09465-9
[2] Liu, J., Shao, W.W., Xiang, C., Mei, C., Li, Z. (2020). Uncertainties of urban flood modeling: Influence of parameters for different underlying surfaces. Environmental Research, 182: 108929. https://doi.org/10.1016/J.ENVRES.2019.108929
[3] Bizimana, J.P., Schilling, M. (2009). Geo-information technology for infrastructural flood risk analysis in unplanned settlements: A case study of informal settlement flood risk in the nyabugogo flood plain, Kigali City, Rwanda. In Geospatial Techniques in Urban Hazard and Disaster Analysis. Springer Netherlands.
[4] Chiasson, J.G. (2019). Designing spaces for unplanned settlements: Upgrading the condition of popular settlements in Mexico’s Ejido Lands, School of Urban Planning McGill University, USA.
[5] Debray, H., Kraff, N.J., Zhu, X.X., Taubenböck, H. (2023). Planned, unplanned, or in-between? A concept of the intensity of plannedness and its empirical relation to the built urban landscape across the globe. Landscape and Urban Planning, 233: 104711. https://doi.org/10.1016/j.landurbplan.2023.104711
[6] Yasin, M.Y., Mohd Yusoff, M., Abdullah, J., Mohd Noor, N., Mohd Noor, N. (2021). Urban sprawl literature review: Definition and driving force. Malaysian Journal of Society and Space, 17(2): 116-128. https://doi.org/10.17576/geo-2021-1702-10
[7] Ketadzo, J.A., Nkongolo, N.V., Akrofi, M.M. (2021). Empirical analysis of the impact of urbanization on groundwater quality within the slums of Accra, Ghana. World Water Policy, 7(1): 112-131. https://doi.org/10.1002/wwp2.12054.
[8] Irshad, H., Mahar, M.U., Jahangir, A., et al. (2023). An assessment of public experiences and expectations with physicians: A cross sectional study from Karachi, Pakistan. BMC Health Services Research, 24: 108. https://doi.org/10.21203/rs.3.rs-3446056/v1
[9] Aprildahani, Hasyim, A.W., Rachmawati, T.A. (2014). Conversion of agricultural land in the urban area of Karangploso, Malang Regency as an impact of urban sprawl. Jurnal Teknik Pengairan, 5(2): 36-47.
[10] Permen PUPR14-2018. (2018). Ministry of Public Works and Public Housing. https://peraturan.go.id/id/permen-pupr-no-14-prt-m-2018-tahun-2018, accessed on Oct. 10, 2024.
[11] Damayanti, F., Rahma, P.D. (2018). Identification of slum areas in Malang City. Jurnal Rekayasa Unira, 3(2): 13-20.
[12] Muntaha, Y., Prayogo, T.B., Yuliani, E. (2022). Innovative infiltration well modeling for low permeability groundwater conservation in Malang City. Journal of Irrigation Engineering, 13(1): 36-47. https://doi.org/10.21776/ub.pengairan.2022.013.01.04
[13] Nchito, W.S. (2007). Flood risk in unplanned settlements in Lusaka. Environment and Urbanization, 19(2): 539-551. https://doi.org/10.1177/0956247807082835
[14] Muhibbin, M., Said Sugiharto, U., Parmono, B. (2022). Malang City community participation in flood disaster prevention, Malang. Negara dan Keadilan, 9(2): 218. https://doi.org/10.33474/hukum.v9i2.9284
[15] Utama, G.S. (2023). Determination of Flood Disaster Vulnerability Level in Malang City Using Geographic Information System (GIS). Geofisika.
[16] LPPD-Tahun-2022-BPBD-KOTA-MALANG. (2022). https://malangkota.go.id/download/2023/sakip_kota_malang_2023/LPPD-Kota-Malang-Tahun-2022.pdf.
[17] Mottelson, J. (2023). On the impact of urban planning in contexts with limited enforcement of building and planning regulations: A study of the urban form of planned and unplanned informal settlements in Maputo, Mozambique. PLoS ONE, 18: e0292045. https://doi.org/10.1371/journal.pone.0292045
[18] Musa, B., Fuka, A. (2019). Assessment of development challenges in unplanned settlements of Suleja, Niger State Nigeria. https://dataprojectng.com/paymentpage/8093.
[19] Marpaung, B.O.Y., Harahap, M. (2020). The structure of unplanned settlements in badur village, medan, Indonesia. International Journal of Academic Research, 4(3): 177-187.
[20] Sietchiping, R. (2021). Planning the Unplanned: Modelling Informal Settlements by Means of Geographic Information Systems and Cellular automata, USA.
[21] Jacobs, C., Musukuma, M., Hamoonga, R., Sikapande, B., Chooye, O., Wehrmeister, F.C., Michelo, C., Blanchard, A.K. (2024). Trends and inequalities in maternal and newborn health services for unplanned settlements of Lusaka City, Zambia. Journal of Urban Health. https://doi.org/10.1007/s11524-024-00837-z
[22] Utami, T.B., Susetyo, B. (2017). Typology of accessibility between planned and unplanned settlement, Architecture Department-Mercu Buana University, Jakarta. https://doi.org/10.1051/matecconf/201710105026
[23] Abdelkader, M., Sliuzas, R., Boerboom, L., Zevenbergen, J. (2022). The unintended consequences of Egypt’s institutional land regime on unplanned settlement growth in the Nile Valley. Land Use Policy, 113: 105887. https://doi.org/10.1016/j.landusepol.2021.105887
[24] Joseph, C. (2015). The implications of unplanned settlement on environmental quality in Gwagwalada Town. Department of Geography and Environment Management, Faculty of Social Sciences, University of Abuja, Abuja, Nigeria.
[25] Ibimilua, A.F. and Ibimilua, O.F. (2024). Urban slums and suburban sprawls: Environmental challenges of safe, resilient and sustainable cities. Polish Journal of Environmental Studies, 33(4): 3677-3685. https://doi.org/10.15244/pjoes/166592
[26] Marpaung, B.O. (2016). Appearance of unplanned settlement as a reality in Medan city and surrounding area, Department of Architecture - University of Sumatera Utara.
[27] Setiawan, A., Wahyutomo, A. (2022). Kajian risiko bencana banjir dan tanah longsor di kabupaten purworejo.
[28] El-Shorbagy, A.-M. (2014). An assessment study of unplanned settlements case study: Al-Ruwais district, Jeddah, Saudi Arabia. European Scientific Journal, 10(32): 266-277.
[29] Kurniasih, D., Mentayani, I., Hartati, L., Abidin, Z. (2019). Analisis penataan permukiman kumuh rencana kawasan 1 kota banjarmasin kuin utara - alalak selatan - alalak tengah - alalak utara. EnviroScientae, 430-440.
[30] Sunarti, S., Yuliastuti, N., Purwanto, A.A., Putri, K. (2022). Sustainability of slum upgraded area, case of Mojosongo, Surakarta, Indonesia. IOP Conference Series: Earth and Environmental Science, 1111(1): 012037. https://doi.org/10.1088/1755-1315/1111/1/012037
[31] Arifin, M.Z., Wunas, S., Sastrawati, I., et al. (2022). Disaster mitigation of slum-scale fires in Jongaya village at Tamalate. IOP Conference Series: Earth and Environmental Science, 1117(1): 012027. https://doi.org/10.1088/1755-1315/1117/1/012027
[32] Ozesmi, S.L., Bauer, M.E. (2002). Satellite remote sensing of wetlands. In Wetlands Ecology and Management, 10(5): 381-402. http://doi.org/10.1023/A:1020908432489
[33] Maurya, S., Srivastava, P.K., Gupta, M., Islam, T., Han, D. (2016). Integrating soil hydraulic parameter and microwave precipitation with morphometric analysis for watershed prioritization. Water Resources Management, 30(14): 5385-5405. https://doi.org/10.1007/s11269-016-1494-4
[34] Xue, C., Chen, G., Feng, J., Zhao, J., Wang, Y. (2023). Slope scaling effect and slope-conversion-atlas for typical water erosion regions in china. Sustainability, 15(4): 3789. https://doi.org/10.3390/su15043789
[35] Ihsan, H.M., Sahid, S.S. (2021). Vertikal accuracy assessment on sentinel-1, alos palsar, and demnas in the ciater basin. Jurnal Geografi Gea, 21(1): 16-25. https://doi.org/10.17509/gea.v21i1.29931
[36] Gelagay, A.A., Negash, W.D., Belachew, T.B., et al. (2023). Magnitude of unmet need for family planning and associated factors among women in the extended postpartum period in Dabat district, Northwest Ethiopia. Evidence from dabat demographic health surveys. BMC Public Health, 23(1): 1123. https://doi.org/10.1186/s12889-023-16046-3
[37] Reddy, P.S., Bhavani, R. (2023). Hydrological modeling of urban flooding in nandigama: Land use dynamics and climate influence. IOP Conference Series: Earth and Environmental Science, 1280(1): 012056. https://doi.org/10.1088/1755-1315/1280/1/012056
[38] Mireille, N.M., Mwangi, H.M., Mwangi, J., Gathenya, J.M. (2019). Analysis of land use change and its impact on the hydrology of kakia and esamburmbur sub-watersheds of narok county, Kenya. Hydrology, 6(4): 86. https://doi.org/10.3390/hydrology6040086
[39] Tyler, J., Sadiq, A., Noonan, D.S. (2019). A review of the community flood risk management literature in the usa: Lessons for improving community resilience to floods. Natural Hazards, 96(3): 1223-1248. https://doi.org/10.1007/s11069-019-03606-3
[40] Lunka, P., Patil, S. (2015). Impact of tree planting configuration and grazing restriction on canopy interception and soil hydrological properties: Implications for flood mitigation in silvopastoral systems. Hydrological Processes, 30(6): 945-958. https://doi.org/10.1002/hyp.10630
[41] Shih, S., Chen, P.C. (2021). Identifying tree characteristics to determine the blocking effects of water conveyance for natural flood management in urban rivers. Journal of Flood Risk Management, 14(4): e12742. https://doi.org/10.1111/jfr3.12742
[42] Marapara, T.R., Jackson, B., Hartley, S., Maxwell, D. (2020). Disentangling the factors that vary the impact of trees on flooding (a review). Water and Environment Journal, 35(2): 514-529. https://doi.org/10.1111/wej.12647
[43] Saber, M., Abdrabo, K.I., Habiba, O.M., Kantosh, S.A., Takemon, Y. (2020). Impacts of triple factors on flash flood vulnerability in egypt: Urban growth, extreme climate, and mismanagement. Geosciences, 10(1): 24. https://doi.org/10.3390/geosciences10010024
[44] Nofal, O.M., Lindt, J.W.V.D. (2020). Minimal building flood fragility and loss function portfolio for resilience analysis at the community level. Water, 12(8): 2277. https://doi.org/10.3390/w12082277
[45] Miguez, M.G., Veról, A.P., Sousa, M.M.D., Rezende, O.M. (2015). Urban floods in lowlands-levee systems, unplanned urban growth and river restoration alternative: A case study in Brazil. Sustainability, 7(8): 11068-11097. https://doi.org/10.3390/su70811068
[46] Miller, S. (2000). Arbuscular mycorrhizal colonization of semi‐aquatic grasses along a wide hydrologic gradient. New Phytologist, 145(1): 145-155. https://doi.org/10.1046/j.1469-8137.2000.00566.x
[47] Adedeji, O.H., Olayinka, O.O., Ogundiran, T., Tope-Ajayi, O.O. (2021). Urban flood impacts, flood water quality and risk mapping of Olodo area, Ibadan, Nigeria. Journal of Natural Sciences Engineering and Technology, 19(1): 56-73. https://doi.org/10.51406/jnset.v19i1.2097
[48] Kuntiyawichai, K., Schultz, B., Uhlenbrook, S., Suryadi, F., Griensven, A.V. (2010). Comparison of flood management options for the yang river basin, Thailand. Irrigation and Drainage, 60(4): 526-543. https://doi.org/10.1002/ird.596
[49] Moodie, A.J., Nittrouer, J.A. (2021). Optimized river diversion scenarios promote sustainability of urbanized deltas. Proceedings of the National Academy of Sciences, 118(27): e2101649118. https://doi.org/10.1073/pnas.2101649118
[50] Serra‐Llobet, A., Kondolf, G.M., Magdaleno, F., Keenan‐Jones, D. (2021). Flood diversions and bypasses: Benefits and challenges. WIREs Water, 9(1): 1-24. https://doi.org/10.1002/wat2.1562
[51] Kusumaningrum, P., Risnan, M. (2023). Utilization of by-products and waste GGBFS materials from steel processing industry to produce sustainable green pervious concrete in Indonesia. IOP Conference Series: Earth and Environmental Science, 1245(1): 012017. https://doi.org/10.1088/1755-1315/1245/1/012017
[52] Kia, A., Wong, H. Cheeseman, C. (2017). Clogging in permeable concrete: A review. Journal of Environmental Management, 193: 221-233. https://doi.org/10.1016/j.jenvman.2017.02.018
[53] Odeh, T., Alakhras, A.I., Habib, M., Alduaij, O., Mohammad, A.H., Alslaty, F. (2022). A recommended urban plan according to flash flood risk potential map: The case study of mecca province - Saudi Arabia. International Journal of Sustainable Development and Planning, 17(3): 737-742. https://doi.org/10.18280/ijsdp.170304
[54] Lama, G.F.C., Giovannini, M.R.M., Errico, A., et al. (2021). Hydraulic efficiency of green-blue flood control scenarios for vegetated rivers: 1d and 2d unsteady simulations. Water, 13(19): 2620. https://doi.org/10.3390/w13192620
[55] Rusdiana, O., Rizki, T.A., Winata, B. (2024). Assesing infiltration rate and soil physical properties at different vegetation densities in the jasinga silviculture teaching industry (jsti) area. IOP Conference Series: Earth and Environmental Science, 1315(1): 012036. https://doi.org/10.1088/1755-1315/1315/1/012036
[56] Samzadeh, M., Din, N.B.C., Abdullah, Z., Mahyuddin, N., Ismail, M.A. (2021). Feasibility of vertical rainwater harvesting via in-situ measurement of wind-driven rain loads on building facades in a tropical climate. International Journal of Built Environment and Sustainability, 8(3): 27-45. https://doi.org/10.11113/ijbes.v8.n3.736
[57] Shafique, M., Kim, R., Kyung-Ho, K. (2018). Rainfall runoff mitigation by retrofitted permeable pavement in an urban area. Sustainability, 10(4): 1231. https://doi.org/10.3390/su10041231
[58] Kravchenko, M., Trach, Y., Trach, R., Tkachenko, T., Mileikovskyi, V. (2024). Improving the efficiency and environmental friendliness of urban stormwater management by enhancing the water filtration model in rain gardens. Water, 16(10): 1316. https://doi.org/10.3390/w16101316
[59] Daniels, B.J., Yeakley, J.A. (2024). Catchment-scale hydrologic effectiveness of residential rain gardens: A case study in Columbia, Maryland, USA. Water, 16(9): 1304. https://doi.org/10.3390/w16091304
[60] Raimondi, F., Marchioni, M.L., Dresti, C., Kian, D., Mambretti, S., Becciu, G. (2021). Urban flood risk management: Impact of combined strategies. International Journal of Environmental Impacts, 4(3): 219-230. https://doi.org/10.2495/EI-V4-N3-219-230
[61] Das, A. (2021). Exploring the potential of zoning regulation for reducing ice-jam flood risk using a stochastic modelling framework. Water, 13(16): 2202. https://doi.org/10.3390/w13162202
[62] Wongboontham, T., Nitivattananon, V., Pal, I., Nguyen, T.P.L. (2023). Enhancing urban flood resilience: The role and influence of socio-economics in the Chao Phraya River Basin, Thailand. International Journal of Sustainable Development and Planning, 18(10): 3061-3076. https://doi.org/10.18280/ijsdp.181009
[63] Henry, S.T., Laroche, A., Hentati, A., Boisvert, J. (2020). Prioritizing flood-prone areas using spatial data in the province of new Brunswick, Canada. Geosciences, 10(12): 478. https://doi.org/10.3390/geosciences10120478
[64] Park, K., Oh, H., Won, J. (2020). Analysis of disaster resilience of urban planning facilities on urban flooding vulnerability. Environmental Engineering Research, 26(1): 190529. https://doi.org/10.4491/eer.2019.529
[65] Ndabula, C., Oyatayo, K.T. (2021). Spatial multi-criteria evaluation of proportional accountability of flood causal factors and vulnerable areas in Makurdi, Benue State, Nigeria. Journal of Resources Development and Management, 77: 17-27. https://doi.org/10.7176/jrdm/77-03
[66] Burningham, K., Fielding, J. Thrush, D. (2007). ‘it'll never happen to me’: Understanding public awareness of local flood risk. Disasters, 32(2): 216-238. https://doi.org/10.1111/j.1467-7717.2007.01036.x
[67] McEwen, L., Garde-Hansen, J., Holmes, A., Jones, O., Krause, F. (2016). Sustainable flood memories, lay knowledges and the development of community resilience to future flood risk. Transactions of the Institute of British Geographers, 42(1): 14-28. https://doi.org/10.1111/tran.12149
[68] Thamrin, M.H., Ridho, H., Nasution, F.A. (2022). Strengthening community participation in spatial planning of riverflow regions in Medan City. International Journal of Sustainable Development and Planning, 17(6): 1849-1854. https://doi.org/10.18280/ijsdp.170619
[69] Ismael, D., Hutton, N., Erten-Unal, M., et al. (2024). Community-centric approaches to coastal hazard assessment and management in southside Norfolk, Virginia, USA. Atmosphere, 15(3): 372. https://doi.org/10.3390/atmos15030372
[70] Wachinger, G., Keilholz, P., O'Brian, C. (2018). The difficult path from perception to precautionary action—Participatory modeling as a practical tool to overcome the risk perception paradox in flood preparedness. International Journal of Disaster Risk Science, 9(4): 472-485. https://doi.org/10.1007/s13753-018-0203-8
[71] Fitriani, D.R., Milkhatun, M., Damaiyanti, M., Muflihatin, S.K., Rizal, A.A.F. (2019). The relation between knowledge and experience of facing flood toward the anxiety level of head families in the flood-prone areas. South East Asia Nursing Research, 1(3): 120-127. https://doi.org/10.26714/seanr.1.3.2019.120-127