Samaher J. Mohammed![]()
© 2024 The author. This article is published by IIETA and is licensed under the CC BY 4.0 license (http://creativecommons.org/licenses/by/4.0/).
OPEN ACCESS
This study demonstrates the efficiency of the heating technique with pressure 2.5 “bar” in treating magnesium, calcium, and total hardness of groundwater with sodium carbonate as catalyst. When using a temperature of 100℃, the treatment rates were (89%, 88%, 92%) respectively. Meanwhile, removal rates were (73%, 74%, 80%) respectively at a temperature of 60℃. Topographic mapping of groundwater and its direction is essential to understand the distribution and flow of groundwater in a specific area. These maps are used to identify locations of groundwater sources, assess their quality, and manage their use sustainably. Additionally, its fundamental to understand the distribution and flow of groundwater. Topographic mapping includes creating maps showing groundwater levels, known as groundwater contour lines. The detection technique for groundwater flow direction uses GIS, Global Mapper Civil 3D, and WMS to locate elevation and position of groundwater. This study found changes in the natural land levels within the study area and the disparity between the groundwater level concerning the ground surface and the river water level. Tikrit city is characterized by relatively higher terrain and water table than the other cities of the study area based on the above mentioned characteristics.
directions of groundwater flow, groundwater treatment, thermal methods, pressure techniques, topographic mapping, GIS, hydraulic gradient
The area of concern in the global society is Water Supply for Domestic Uses because of population pressure. This gap between the availability of water and the requirement for the water especially for human consumption can quickly become alarming [1]. Water hardness, a popular topic of discussion when it comes to quality of water, has been elaborated in many papers. This probably due to the presence of positively charged metallic ions especially calcium and magnesium ions [2].
The cause of water hardness can be explained by the fact that in the process of water from most of the wells passing through calcium carbonate and magnesium carbonate rocks, dissolved carbon dioxide plays a key role as indicated by Knivsland [3]. Thus, the dissolution process will lead to the formation of calcium and magnesium ions in the water and this gives water hardness. This occurrence has a great effect on the quality of water in use and affects various sectors, homes, and the environment by Boonpanaid and Piyamongkala [4]. Water hardness is usually expressed in milligrams per litre “mg/L” or parts per million (ppm) as calcium carbonate (CaCO3) as pointed out by Wang et al. [5]. This categorization is useful in creating a standard way of measuring water hardness irrespective of the source of the water or the area it is coming from.
Numerous works have been conducted to solve the problem of water hardness, and several methods have been suggested to remove the calcium and magnesium ions from the hard as well as saline water sources like ground water and sea water. The various methods of water treatment that are available are chemical precipitation, electrochemical methods, adsorption, electrolysis, reverse osmosis, Nano filtration, and ion exchange. This is due to the fact that water purification is a vital process, as there is a impending issue of water scarcity in many parts of the world. According to studies [6, 7], this paper postulates that heating and pressing as a way of removing water hardness due to calcium and magnesium ions is efficient and effective. However, all the methods have their own strengths and weaknesses and the selection of the method depends on the requirements and conditions. When applying both of the methods, the results may be even more effective and give the most efficient way of solving the issue with hard water. These methods shall continue to be more effective as technology progresses and will also be economical thus providing better quality water for domestic and industrial purposes, according to Ahn et al. [8].
Among those methods, carbonation is relatively an inexpensive process which can be used to remove of calcium and magnesium ions from hard water samples. Carbonate hardness is extremely sensitive to temperature and can easily precipitate. At high temperatures, Magnesium salts also produce hard scales inside the boilers. In this paper, the process of crystallization of precipitated calcium carbonate (PCC) just as well as magnesium carbonate from the hard water samples which were investigated. In addition, the calcite PCC obtained could be utilized as filler material used to enhance the mechanical properties of these composites in both, the plastics and paper industries [9, 10].
The role of surface water, rainfall and soil layer on groundwater has been seen to be a, rather intricate hydrological process. The connection between surface water and groundwater which is well illustrated by infiltration processes during precipitation events plays a crucial role in recharging the underground aquifers. The basic properties of the layers of the soil significantly affect the rate of percolation of water and the seepage that will happen in the underground. Soil type and structure varies in the field and this affects the water retention and transmission rate of the water through the ground and hence the aquifer recharge rates. To construct better knowledge on the behavior of groundwater, it is pivotal to comprehend the interconnection of these factors, thus we establish these impacts on water quality [11].
Out of the variables, groundwater is likely to be more susceptible to bacterial contamination and changes in the quality parameters that may influence the softness of water significantly. The flow dynamics of the water concerning sewage constituents’ infiltration and interaction is vital to know in order to design ideal water quality management plans [12]. It is necessary to consider the impact of the groundwater conditions on the intended constructions regarding the hydrological aspects. Due to the fact that groundwater is a vital but at the same time a quite delicate and rather an intangible resource, its discussion deserves a special attention. Consequently, there is the need to introduce several management measures in order to protect this vital water source as well as the ecosystems associated with it from the problems of salinization and pollution. To predict the amount of the groundwater, draw down and pumping from the proposed well systems, a simulation program was also employed with the help of geological, hydrological and hydrogeological data from various sources. More studies were conducted to assess the steady and transient state flow behavior with the help of field data from studies [13, 14]. Researches conducted by academicians and scholars like studies [15, 16]. This paper has also identified the hydrological status and hydraulic parameters of the groundwater aquifers which are essential in the distribution of water resources. The flow net was constructed and it was realized that the overall function of an aquifer is in the mapping of some of the main characteristics of a reservoir including movement of water and the recharge structure especially in the case of pumping. Thus, it is relevant to estimate the ungauged aquifer systems to predict patterns of water resources, and floods and landslides in the context of climate change. Hydrology mapping plays an important role in determining new information that aid in establishing the movement of the ground water. Therefore, according to the information obtained, the hydrogeological conceptual model is suggested in which two separate aquifers are identified and their permeability coefficients are defined, as observed by Vincent et al. [17].
2.1 Study area
This study was conducted on six cities located on the western bank of the Tigris River in Salah al-Din Governorate in northern Iraq: Al-Shirkat, Tikrit, Owainat, Mukeshefa, Al-Ishaqi and Balad, respectively. This study area is around 8.1 “km2”, it is characterized by Diverse terrain including plains, highlands and plateaus. The length of the Tigris River in Saladin Governorate is 360 “km”. These cites that rely heavily groundwater and are close to the river were chosen for the study based on their geological order from north to south.
Processing technology: In this study, the total hardness of groundwater, as well as the hardness of calcium and magnesium, was performed using three factors: pressure of 2.5 “bar”, temperature, and sodium carbonate (Na2CO3) at a concentration of 150 “mg/L” as a catalyst for eliminating and precipitating magnesium and calcium ions. Two different temperatures were chosen for the treatment procedure with constant pressure factors and sodium carbonate concentration: the first 60℃, the second is 100℃ using a heat source. The study was done on 36 samples groundwater was taken from 36 wells, 6 in each of the 6 cities in this study. Where the six cities adjacent to the Tigris River in Salah al-Din Governorate in Iraq were chosen to represent the study areas: Al-Shirkat, Tikrit, Owainat, Mukeshefa, Al-Ishaqi, and Balad respectively. Sodium carbonate at a concentration of 150 “mg/L” was mixed with the water sample, then heated the sample under 2.5 “bar” pressure using a 2 “L” reactor made of steel. The reactor (Which uses electricity as an energy source) has been supplied with manometer, to gage the pressure with an automatic ventilation function (to release the pressure).
2.2 The treatment process
1. Sodium carbonate added to a water sample.
2. Head being applied to catalyze the effects of Na₂CO₃ as Eqs. (1) and (2):
$\mathrm{Ca}^{2+}+\mathrm{Na}_2 \mathrm{CO}_3 \rightarrow \mathrm{CaCO}_3 \downarrow+2 \mathrm{Na}^{+}$ (1)
$\mathrm{Mg}^{2+}+\mathrm{Na}_2 \mathrm{CO}_3+\mathrm{H}_2 \mathrm{O} \rightarrow \mathrm{Mg}(\mathrm{OH})_2 \downarrow+2 \mathrm{Na}^{+}+\mathrm{CO}_2$ (2)
3. Leave the sample to sediment.
4. Filter the participated part away.
This process is utilized to remove Ca+2 and Mg+2 [8, 9].
In the first case, the water temperature was raised to 60℃ under pressure for half an hour. In the second case, the reactor is heated using a heat source to 100℃ under pressure. 36 well water samples were treated, with 6 samples from 6 wells in each of the six cities in the region of the study. Physical and chemical properties were examined, including (pH), dissolved oxygen (DO), electrical conductivity (EC), total hardness, calcium (Ca), magnesium (Mg). Tests were conducted according to standard methods for testing drinking water. EC, DO, and pH tests were measured at the sampling site, and other tests were performed in the laboratory according to standard water testing methods [4, 11].
2.3 Topographic maps process
The importance of mapping the topography and trend of groundwater is in planning the sustainable use of groundwater. It also contributes to detecting and protecting water sources from pollution. It is used in designing water distribution networks and construction projects. These maps provide important data for hydrological and geological studies. To extract topographic maps, Aerial surveys of the study area was conducted to conduct a topographical study of the area through engineering programs such as GIS, Civil3D and study of land and river levels, well levels, and groundwater in this region, to produce topographic and GIS maps. Drawing topographic maps involves collecting water levels data from wells through the use of hydraulic measurement techniques. In addition to using (GIS) and data analysis programs to create digital models of water levels and create contour maps that show the variation in groundwater levels in the studied area. The direction of groundwater was also determined based on the hydraulic potential gradient, which represents the difference in water level elevation between two points. Groundwater moves from areas of high to low hydraulic potential. Hydraulic potential is measured at multiple points throughout the wells, and the data is used to draw lines representing the levels of hydraulic potential, known as potential lines. As well as determining the direction of groundwater flow, through hydraulic stress gradient analysis [11, 16].
3.1 Topography
The result includes the study net Conduct surveys of the western bank of the Tigris River within Salah al-Din Governorate to evaluate the topographic and hydrological characteristics, with a special focus on the natural elevations and groundwater levels in the analyzed area. Specialized engineering programs were used to facilitate accurate data collection and analysis. Figure 1 shows the study site located in Saladin Governorate in Iraq. Six cities were chosen on the western bank of the Tigris River within Saladin Governorate. Aerial and cadastral surveying, Civil3D and GIS programs are adopted for data extraction DEM and mapping. Topography plays a vital role in understanding the natural environment of any area. It is concerned with the study of the shapes of the Earth's surface and the distribution of elevations and depressions, and as such provides valuable information about how natural and human factors interact in shaping the natural landscape. In this context, the importance of studying the topographic characteristics of the study site is highlighted, especially when considering the locations of the studied wells and their impact on the surrounding land levels. Hence the importance of drawing topographical maps of the study area for the purpose of studying the nature of the land and the differences in the land levels characteristics and its distance from the Tigris River [15, 18, 19].
Figure 1. The map of the study area within Saladin governorate - Republic of Iraq
Figure 2. A longitudinal section of the natural ground levels at the site of the studied wells
Figure 2 was drawn based on the information obtained from aerial surveys (Digital Elevation Model -DEM) and the topographical and hydrological study of the study area, where it shows the difference in natural land height levels for the six cities in Salah al-Din Governorate, which are in sequence from north to south (Al-Shirkat, Tikrit, Owainat, Mukeshefa, Al-Ishaqi and Balad). Al-Shirkat and Tikrit cities showed a noticeable difference in height compared to the others. The studied cities are on the bank of the Tigris River. The natural land level in the cities of Al-Shirkat and Tikrit ranged between 110 m and 150 m, respectively, and the distance between the two cities was about 125 km, but the depth of groundwater in the city of Al-Shirkat is very close to the surface of the earth, even though the surface of the Tigris River is less than 10 m, compared to the depth of groundwater in the city of Tikrit, which exceeds 65 m. While the distance between the city of Owainat and Tikrit does not exceed 10 km. However, we find that the depth of the groundwater does not exceed 13 m.
Natural land levels decrease gradually in the rest of the study areas from north to south, and groundwater levels are close to the surface of the earth. The average water depth in the rest of the study areas was 13 m, except for the city of Al-Ishaqi, where the groundwater depth was approximately 24 m. The results of the study show a significant difference between the depth of the groundwater reservoirs in the city of Tikrit compared to the rest of the study areas. It can be concluded from these data that the groundwater reservoir in the city of Tikrit is separate, with deeper levels than the rest of the cities. The possibility of it being affected by the waters of the Tigris River is weak, due to the distance vertically between the levels of the Tigris River and groundwater, which may reach 33 m. While we found that the groundwater level in the rest of the cities is close to the river level, which led to the possibility of feeding groundwater reservoirs from river water, thus affecting the characteristics of groundwater. This is demonstrated by the analysis of the direction of groundwater flow during the current study. The effect of the Tigris River water in raising the groundwater level is clear in most of the areas surrounding the Tigris River within the boundaries of the study area, except for the city of Tikrit, whose land is higher than the river by more than 30 m. The depth of groundwater in most areas west of the river within the study area does not exceed 13 m. Except for the city of Tikrit, the average depth of groundwater exceeds 65 m. This is what appears Morphology Natural land within the boundaries of the studied area and groundwater in Figures 1 and 2 [12, 13].
3.2 Groundwater characteristics
Figure 3 demonstrates the direction of groundwater flow from west to east, north of the study area, which represents the location of the cities of Al-Shirkat and Tikrit. As for the rest of the areas towards the south of the study area, we find that the groundwater is heading south-west. Which shows the groundwater near the river is affected by the waters of the Tigris River in most areas of Salah al-Din Governorate. The effect of the river appears in raising the groundwater level in the surrounding areas. A map of the pH-values of groundwater in Salah al-Din Governorate was produced, where Figure 4 shows the pH-values of groundwater in the study area. The effects of river Tigris are shown on the groundwater concentrations ranged between 7.1 - 7.3, while the pH-value in the groundwater in the groundwater near the Tigris River and affected by it ranged from 6.9 to 7.6. The basicity of groundwater increases to 8.2 as we move away from the influence of river water, as the pH-value increases to basicity as the groundwater moves southwest of the Tigris River [20-22].
Figure 3. A topographical map of the levels and direction of groundwater flow in the study area
Figure 4. A contour map of the pH values of groundwater in the study area
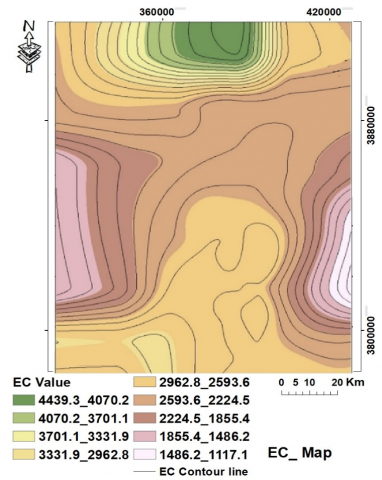
Figure 5. A contour map of the electrical conductivity of groundwater in the study area
The electrical conductivity of groundwater is a crucial factor in understanding the distribution of groundwater in different regions. Research results imply the electrical conductivity of groundwater increases north of the study area, as shown in Figure 5 shows the groundwater EC in the study area using colored legend. The green color (north side of the map) indicates an increase in EC between (4439.3-3701.1) μS/cm and gradually decrease as far as we move away from the river (both west and east) reaching (1855.4-1117.1) μS/cm. This may be the rise is due to several factors, including: the Configurations, the Geological, the different in this region that may contribute to increasing groundwater conductivity. In addition to increase pollutants industrial and Sewage that throw it into a river Tigris. The river is also exposed to pollutants resulting from farms surrounding the river Groundwater resulting from fertilizer and pesticide residues. On the other hand, the results to a decrease in groundwater conductivity in wells located southwest or south-east of the study area. This decrease may be due to various geological factors that may reduce the electrical conductivity values in this groundwater, such as the presence of non-porous rocks or geological layers that block water flow. One of the interesting points that the search results showed that it is the clear effect of the Tigris River on groundwater conductivity in groundwater in the south region of the study. The influence of the river increases the electrical conductivity of groundwater. This phenomenon could be due to the influence of surface water flows on the formation and movement of geological layers in the area. Geological and natural formations such as sedimentary rocks and sand cause the release of fine particles into groundwater. Some minerals and organic materials also decompose naturally and release fine particles into the water [8, 11, 23].
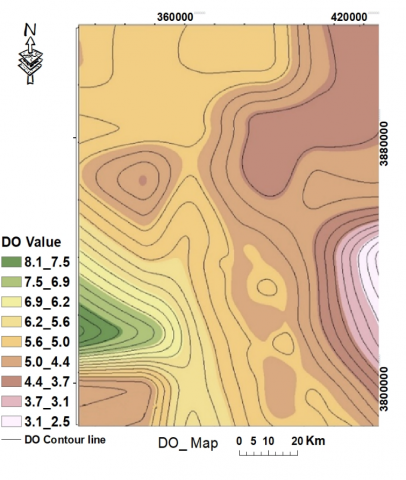
Figure 6. A contour map of dissolved oxygen concentration in groundwater in the study area
That studying changing dissolved oxygen concentrations in groundwater is vital to understanding the health and impact of aquatic ecosystems Human activities on water quality. Dissolved oxygen concentrations ranged in the area study (8.1-2.5) mg/L, observed a decrease in dissolved oxygen concentrations in groundwater east of the study area as shown in Figure 6. Where the green color indicates a high concentration of (DO) in groundwater (8.1-6.9) mg/L eastern of the study area. Which decreases gradually westward (3.7-2.5) mg/L. It results to the declined concentration of dissolved oxygen depends on human and geological factors, such as industrial and agricultural pollution. In addition to subtraction untreated wastewater leads to an increase in nutrient and organic loading in groundwater, leading to oxygen depletion. Groundwater flow itself may also cause a decrease in dissolved oxygen concentrations in groundwater. Ground water flows fast, dissolved oxygen may not be available because organisms in the ecosystem use it up for their metabolism. Besides other natural changes and factors like temperature changes and flow changes that can influence the dissolved oxygen levels in groundwater [24-26].
3.3 Hardness treatment
Determination and evaluation of total hardness of the groundwater is significant in assessing the quality of water and its usage. Water hardness refers to the level of the dissolved minerals in the water including calcium, magnesium and other minerals that have an impact in various uses of the water such as drinking, washing and industrial processes. Totally, the total hardness was analyzed in six wells in six different regions. It was also evidenced that the there were high variations in the hardness levels in the different regions with Tikrit having the highest levels of 1010 mg/L while Mukeshefa having the lowest at 381 mg/L as shown in Table 1 and Table 2.
High hardness values indicate the presence of high levels of dissolved minerals such as calcium and magnesium. This may be a result of the nature of the soil and rocks in that area, so the relatively low hardness values indicate the presence of a smaller amount of these minerals, which makes the water in this area less hard compared to the hardness of groundwater in Tikrit. In addition, the clear and significant change in hardness may indicate the presence of a water reservoir separate from the Tigris River. In this case, no water exchange with the river occurs, which prevents dilution of high hardness through river water unlike low hardness areas [27, 28].
The results of the study also showed a direct relationship between the concentrations of magnesium and calcium and the total hardness values. The highest values of calcium hardness were observed in the Tikrit area, reaching 1541.7 mg/L, as shown in Table 1. This high value indicates a very high concentration of calcium in the area's water, which can negatively affect water use for domestic and industrial purposes. High hardness water can lead to deposits forming in pipes and appliances household, which reduces its efficiency and increases maintenance costs. In contrast, where the lowest value of calcium hardness is in the Al-Shirkat region as in Table 3, it reached 89.1 mg/L. This value is considered much lower than that recorded in Tikrit, Reflecting a large variation in Calcium concentrations between the two regions and a change in water quality Groundwater. As for magnesium hardship, the highest values were also recorded in the Tikrit (Table 1), it reached 590 mg/L. This high concentration of magnesium can affect water quality and increases the possibility of sediment formation in pipes. In the Owainat area, the lowest value of magnesium hardness was 87.7 mg/L, as shown in Table 4. This lower value indicates a lower concentration of magnesium compared to Tikrit, which makes the water in region Owainat more suitable for different uses and it’s indicated in Tigris effect in groundwater levels. It can be noted that increasing calcium and magnesium concentrations are accompanied by an increase in total hardness values, which reinforces the hypothesis that hardness is closely related to the concentrations of these minerals [2, 7]. The study showed that hardness removal rates vary based on operational conditions and chemical composition of the water. Tables 1-6 show the rates of hardness removal in the study areas after heat treatment by using the temperature 100℃ and pressure 2.5 bar with the addition of 150 mg/L sodium carbonate. Removal rates were as high as 92%, while the lowest removal rate was 80%. While it was the highest percentage of calcium hardness removal was 88%, while 89% of magnesium hardness was removed. This suggests that hardness removal techniques can be effective in reducing concentrations of these metals and improving water quality.
The percentages of hardness removal reached in the study areas after heat treatment at temperatures of 60℃. Adding sodium carbonate as a catalyst and a pressure of 2.5 bar led to achieving high total hardness removal rates 80%. Hardness was also removed at rates of 74% and 73%, the highest percentage for removing both calcium and magnesium respectively, which reflects great effectiveness in reducing of minerals causing hardness. The results show that temperature has a significant impact on the efficiency of removing hardness from groundwater; however, chemical reactions are more active at a temperature of 100℃ and a pressure of 2.5 bar, which increases the effectiveness of sodium carbonate in precipitating dissolved metals. The study confirms that increasing the temperature to 100℃ significantly improves the efficiency of removing total hardness and hardness of calcium and magnesium from groundwater when using sodium carbonate as a catalyst and a constant pressure of 2.5 bar. But when taking into account the difference in the energy cost used to carry out the treatment, we find that the efficiency of removing hardness in all its forms is very effective at a temperature of 60℃. This variation can be explained by the effect of temperature and pressure used in the removal process, as the results appear in the tables above have varying removal rates for each of the magnesium and calcium. Increasing temperature and pressure leads to improved removal. Analysis of the effect of temperature and pressure on hardness removal clearly shows how operational factors can improve treatment efficiency. By comparing the removal rates at different temperatures, it can be seen that increasing the temperature with the constant pressure used 2.5 bar has positive effects on the efficiency of hardness removal. High pressure enhances the interaction of ions in the treatment, leading to improved removal. At higher temperatures, chemical reactions between metal ions (such as calcium and magnesium) are more effective, as well as increased mobility and interaction of the ions leading to the formation of solid deposits that can be easily removed, which contributes to improving the removal process and pressure also accelerates chemical reactions and increases the effectiveness of physical processes such as sedimentation and filtration. Temperature plays an important role in increasing the speed of chemical reactions, also the high pressure helps speed up the deposition process and improve removal efficiency. The results also indicate that using sodium carbonate at a concentration of 150 mg/L under the mentioned conditions is effective in reducing water hardness, as it was able to remove a large portion of calcium and magnesium ions. This is due to the reaction of sodium carbonate with calcium and magnesium ions to form insoluble calcium carbonate and magnesium carbonate, which can be precipitated and removed from the water [29-31].
Table 1. Results of wells in Tikrit
|
|
No. of Well |
Well 1 |
Well 2 |
Well 3 |
Well 4 |
Well 5 |
Well 6 |
|
Before treatment mg/L |
Total hardness |
900 |
950 |
1010 |
920 |
1000 |
929 |
|
Ca. hardness |
750 |
790 |
820 |
810 |
1541.7 |
1133.3 |
|
|
Mg. hardness |
410 |
500 |
510 |
560 |
520 |
590 |
|
|
After treatment-rate of removalusing100℃ |
%Total hardness removal |
83% |
90% |
83% |
88% |
83% |
84% |
|
%Ca. hardness removal |
81% |
88% |
82% |
86% |
81% |
82% |
|
|
%Mg. hardness removal |
81% |
87% |
81% |
85% |
80% |
81% |
|
|
After treatment-rate of removal using 60℃ |
%Total hardness removal |
70% |
72% |
74% |
75% |
76% |
68% |
|
%Ca. hardness removal |
67% |
66% |
70% |
72% |
73% |
66% |
|
|
%Mg. hardness removal |
68% |
73% |
68% |
69% |
70% |
73% |
Table 2. Results of wells in Mukeshefa
|
|
No. of Well |
Well 1 |
Well 2 |
Well 3 |
Well 4 |
Well 5 |
Well 6 |
|
Before treatment mg/L |
Total hardness |
381.3 |
444.6 |
392.9 |
393.7 |
407.2 |
411.8 |
|
Ca. hardness |
290 |
452.5 |
371.3 |
282 |
275.8 |
276.4 |
|
|
Mg. hardness |
100 |
139 |
101.9 |
93.6 |
87.7 |
90.5 |
|
|
After treatment-rate of removalusing100℃ |
%Total hardness removal |
88% |
89% |
90% |
87% |
89% |
85% |
|
%Ca. hardness removal |
86% |
87% |
88% |
85% |
87% |
83% |
|
|
%Mg. hardness removal |
85% |
86% |
87% |
84% |
86% |
82% |
|
|
After treatment-rate of removal using 60℃ |
%Total hardness removal |
381.3% |
444.6% |
392.9% |
393.7% |
407.2% |
411.8% |
|
%Ca. hardness removal |
290% |
452.5% |
371.3% |
282% |
275.8% |
276.4% |
|
|
%Mg. hardness removal |
100% |
139% |
101.9% |
93.6% |
87.7% |
90.5% |
Table 3. Results of wells in Al-Shirkat
|
|
No. of Well |
Well 1 |
Well 2 |
Well 3 |
Well 4 |
Well 5 |
Well 6 |
|
Before treatment mg/L |
Total hardness |
615 |
684 |
604.5 |
684 |
544.1 |
462.7 |
|
Ca. hardness |
116 |
181 |
148.5 |
181 |
133.7 |
89.1 |
|
|
Mg. hardness |
170 |
168 |
158 |
166 |
149 |
180 |
|
|
After treatment-rate of removal using 100℃ |
%Total hardness removal |
90% |
91% |
85% |
87% |
88% |
92% |
|
%Ca. hardness removal |
80% |
84% |
78% |
79% |
83% |
84% |
|
|
%Mg. hardness removal |
81% |
83% |
79% |
78% |
82% |
83% |
|
|
After treatment-rate of removal using 60℃ |
%Total hardness removal |
68% |
69% |
68% |
72% |
66% |
65% |
|
%Ca. hardness removal |
65% |
66% |
67% |
73% |
65% |
70% |
|
|
%Mg. hardness removal |
63% |
64% |
70% |
72% |
65% |
67% |
Table 4. Results of wells in Owainat
|
|
No. of Well |
Well 1 |
Well 2 |
Well 3 |
Well 4 |
Well 5 |
Well 6 |
|
Before treatment mg/L |
Total hardness |
444.6 |
407.2 |
411.8 |
610 |
583.3 |
603.3 |
|
Ca. hardness |
452.5 |
275.8 |
276.4 |
420.8 |
411.7 |
412.5 |
|
|
Mg. hardness |
139 |
87.7 |
90.5 |
199.2 |
186.7 |
192.5 |
|
|
After treatment-rate of removal using 100℃ |
%Total hardness removal |
83% |
86% |
81% |
80% |
85% |
86% |
|
%Ca. hardness removal |
83% |
88% |
81% |
86% |
83% |
82% |
|
|
%Mg. hardness removal |
87% |
88% |
82% |
84% |
85% |
89% |
|
|
After treatment-rate of removal using 60℃ |
%Total hardness removal |
76% |
72% |
74% |
70% |
73% |
74% |
|
%Ca. hardness removal |
70% |
72% |
73% |
63% |
62% |
67% |
|
|
%Mg. hardness removal |
68% |
69% |
70% |
62% |
61% |
65% |
Table 5. Results of wells in Al-Ishaqi
|
|
No. of Well |
Well 1 |
Well 2 |
Well 3 |
Well 4 |
Well 5 |
Well 6 |
|
Before treatment mg/L |
Total hardness |
610 |
583.3 |
603.3 |
610 |
649.2 |
628.3 |
|
Ca. hardness |
420.8 |
411.7 |
412.5 |
415.8 |
400 |
415.8 |
|
|
Mg. hardness |
199.2 |
186.7 |
192.5 |
209.2 |
250 |
210.8 |
|
|
After treatment-rate of removal using 100℃ |
%Total hardness removal |
88% |
92% |
83% |
90% |
86% |
88% |
|
%Ca. hardness removal |
86% |
83% |
82% |
86% |
87% |
88% |
|
|
%Mg. hardness removal |
84% |
85% |
89% |
85% |
86% |
87% |
|
|
After treatment-rate of removal using 60℃ |
%Total hardness removal |
74% |
78% |
75% |
77% |
75% |
76% |
|
%Ca. hardness removal |
70% |
67% |
66% |
70% |
72% |
73% |
|
|
%Mg. hardness removal |
67% |
68% |
73% |
68% |
69% |
70% |
Table 6. Well results in Balad
|
|
No. of Well |
Well 1 |
Well 2 |
Well 3 |
Well 4 |
Well 5 |
Well 6 |
|
Before treatment mg/L |
Total hardness |
549 |
525 |
543 |
549 |
584.2 |
565.5 |
|
Ca. hardness |
378.8 |
370.5 |
371.3 |
374.3 |
360 |
374.3 |
|
|
Mg. hardness |
179.2 |
168 |
173.25 |
188.2 |
225 |
189.8 |
|
|
After treatment-rate of removal using 100℃ |
%Total hardness removal |
80% |
85% |
86% |
88% |
89% |
90% |
|
%Ca. hardness removal |
86% |
83% |
82% |
86% |
87% |
88% |
|
|
%Mg. hardness removal |
84% |
85% |
89% |
85% |
86% |
87% |
|
|
After treatment-rate of removal using 60℃ |
%Total hardness removal |
68% |
76% |
72% |
74% |
70% |
73% |
|
%Ca. hardness removal |
66% |
70% |
72% |
73% |
63% |
62% |
|
|
%Mg. hardness removal |
549% |
525% |
543% |
549% |
584.2% |
565.5% |
Search results show the efficiency of treating groundwater hardness by heating and pressure technology. Using high temperatures is more effective in treatment, but the energy used in this treatment must be taken into account. The decrease in dissolved oxygen concentrations in groundwater west study areas indicates the presence of Environmental challenges. Which requires a detailed study such as topography maps and effective measures to maintain groundwater quality and the health of aquatic ecosystems. This research recommends taking cautions around fertilization in farms and preform survey studies to locate the appropriate position for digging wells by authorities.
[1] Mohammed, S.J. (2023). Evaluation of water quality and efficiency to treat water pollution problem in two types of supply water distribution system: loop and, tree in Iraq: By using Water GEMS software. AIP Conference Proceedings, 2776(1): 040016. https://doi.org/10.1063/5.0135978
[2] Liu, Y., Wu, J., Chen, J., Liu, S., Xu, H., Yang, Q., Xu, F., Guo, Y., Jiang, B. (2023). Robust electrolysis system divided by bipolar electrode and non-conductive membrane for energy-efficient calcium hardness removal. Chemosphere, 331: 138797. https://doi.org/10.1016/j.chemosphere.2023.138797
[3] Knivsland, S.M. (2012). Water chemistry in the bahi-manyoni basin in Tanzania. Reprosentralen, University of Oslo.
[4] Boonpanaid, C., Piyamongkala, K. (2023) Using commercial resin for ion exchange to remove hardness from domestic water supply. Materials Today: Proceedings. https://doi.org/10.1016/j.matpr.2023.04.117
[5] Wang, J., Liu, Q., Xu, L., Siddique, M.S., Yu, W. (2023). Impacts of water hardness on coagulation-UF-NF process using aluminum salts. Separation and Purification Technology, 314: 123611. https://doi.org/10.1016/j.seppur.2023.123611
[6] Hamdona, S.K., Tadros, H.R., Mabrouk, D.M., Refaat, H.M. (2022). Removal of water hardness and some inorganic pollutants using nano marine algae extract embedded in waste polystyrene. International Journal of Scientific and Research Publications, 12: 67-75. http://dx.doi.org/10.29322/IJSRP.12.01.2022.p12111
[7] Marzouk-Trifi, I., Baklouti, L., Dammak, L. (2023). Investigation of calcium and magnesium removal by Donnan dialysis according to the doehlert design for softening different water types. Membranes, 13(2): 203. https://doi.org/10.3390/membranes13020203
[8] Ahn, M.K., Chilakala, R., Han, C., Thenepalli, T. (2018). Removal of hardness from water samples by a carbonation process with a closed pressure reactor. Water, 10(1): 54. https://doi.org/10.3390/w10010054
[9] Joshi, A., Hande, S., Chorghade, V., Devale, P., Gargade, P. (2023). Determination and removal of hardness of water. International Journal of Novel Research and Development (IJNRD), 8(10).
[10] Smith, E.J., Davison, W., Hamilton-Taylor, J. (2002). Methods for preparing synthetic freshwaters. Water Research, 36(5): 1286-1296. https://doi.org/10.1016/S0043-1354(01)00341-4
[11] Daoud, E.M.H., Abdul-Jabar, R.A., Mohammed, S.J. (2023). Physical and chemical properties of groundwater in Al-Dour district. AIP Conference Proceedings, 2593(1): 050016. https://doi.org/10.1063/5.0113416
[12] HAmmood, I.A., Farhan, M.G., Mohammed, S.J., Abdul-Jabar, R.A. (2023). Estimation of bacterial content of water from some wells south of Samarra City. HIV Nursing, 23(1): 494-498.
[13] Shenga, Z.D., Baroková, D., Šoltész, A. (2018). Modeling of groundwater extraction from wells to control excessive water levels. Pollack Periodica, 13(1): 125-136. https://doi.org/10.1556/606.2018.13.1.11
[14] Moges, S.S., Dinka, M.O. (2022). Assessment of groundwater vulnerability mapping methods for sustainable water resource management: An overview. Journal of Water and Land Development, 52: 186-198. http://dx.doi.org/10.24425/jwld.2022.140389
[15] Abasoh, M.E., Victor, K.J., Pierre, W., Anoh, N.O., Jude, P.N., Roosvelt, D.M.M., Tabod, T.C. (2022). Hydrogeological mapping from Landsat 8, SRTM images, vertical electrical soundings and hydraulic parameters of aquifers: Case study of the South Western part of Baleng Watershed. Results in Geophysical Sciences, 9: 100040. https://doi.org/10.1016/j.ringps.2022.100040
[16] Al-Kubaisi, Q.Y., Hussain, T.A., Rasheed, A.A. (2018). Hydraulic properties of the Bai-hassan aquifer in Tuz-Khurmatu, Salahaddin, Iraq. The Iraqi Geological Journal, 51: 113-129. https://doi.org/10.46717/igj.51.1.8Ms-2018-06-30
[17] Vincent, A., Daigre, C., Fischer, O., Aðalgeirsdóttir, G., Violette, S., Hart, J., Guðmundsson, S., Pálsson, F. (2023). A hydrogeological conceptual model of aquifers in catchments headed by temperate glaciers. EGUsphere, 2023: 1-26. https://doi.org/10.5194/egusphere-2022-1442
[18] Yadav, B., Malav, L.C., Jangir, A., Kharia S.K., Singh, S.V., Yeasin, M., Nogiya, M., Meena, R.L., Meena, R.S., Tailor, B.L., Mina, B.L., Alhar, M.S., Jeon, B., Cabral-Pinto, M., Yadav, K.K. (2023). Application of analytical hierarchical process, multi-influencing factor, and geospatial techniques for groundwater potential zonation in a semi-arid region of western India. Journal of Contaminant Hydrology, 253: 104122. https://doi.org/10.1016/j.jconhyd.2022.104122
[19] Olesea, C. (2022). Initial research using GIS to examine modified anthropogenic ecosystem. Natural Resources and Sustainable Development, 12(1): 173-188. https://doi.org/10.31924/nrsd.v12i1.098
[20] Omeiza, A.J., Adenlui, L.H., Shettima, N.M. (2023) Investigation of groundwater vulnerability to open dumpsites and its potential risk using electrical resistivity and water analysis. Heliyon, 9: 13265. https://doi.org/10.1016/j.heliyon.2023.e13265
[21] Yang, H., Xiao, Y., Hao, Q., Wang, L., Zhang, Y., Liu, K., Zhu, Y., Liu, G., Yin, S., Xie, Z. (2023). Geochemical characteristics, mechanisms and suitability for sustainable and agricultural water supply of confined groundwater in central North China Plain. Urban Climate, 49: 101459. https://doi.org/10.1016/j.uclim.2023.101459
[22] Roostaee, M., Deng, Z. (2023). Effects of digital elevation model data source on HSPF-based watershed-Scale flow and water quality simulations. Environmental Science and Pollution Research, 30(11): 31935-31953. https://doi.org/10.1007/s11356-022-24449-9
[23] Chow, H. (2021). The Treatment of high hardness waters by electrocoagulation: factors affecting contaminant removal, electrode fouling, and precipitate separation. UW Space Waterloo, Ontario, Canada. http://hdl.handle.net/10012/17761.
[24] Rajendiran, T., Sabarathinam, C., Panda, B., Elumalai, V. (2023). Influence of dissolved oxygen, water level and temperature on dissolved organic carbon in coastal groundwater. Hydrology, 10(4): 85. https://doi.org/10.3390/hydrology10040085
[25] Ogunbode, T.O., Oyebamiji, V.O., Aromolaran, O., Faboro, O.O., Ogunbode, I.R. (2023). Impact of human management of hand-dug well facility and its accessories on groundwater quality. Environmental Health Insights, 17: 11786302231190988. https://doi.org/10.1177/11786302231190988
[26] Gomboš, M., Pavelková, D., Kandra, B., Tall, A. (2019). Impact of soil texture and position of groundwater level on evaporation from the soil root zone. Water Resources in Slovakia: Part I: Assessment and Development, 167-181. https://doi.org/10.1007/698_2017_181
[27] Saleh, A., Gad, A., Ahmed, A., Arman, H., Farhat, H.I. (2023). Groundwater hydrochemical characteristics and water quality in Egypt’s Central Eastern Desert. Water, 15(5): 971. https://doi.org/10.3390/w15050971
[28] Al-Ansari, N., Saleh, S., Abdullah, T., Abed, S.A. (2021). Quality of surface water and groundwater in Iraq. Earth Sciences and Geotechnical Engineering, 11(2): 161-199. https://doi.org/10.47260/jesge/1124
[29] Usman, I.U., Abubakar, A.M., Askira, B.I., Arowo, M.N., Lawan, A.S., Saka, T. (2022). Artificial Water Hardness Removal-Modelling and Simulation in ASPEN Plus. DS Journal of Modeling and Simulation, 1(1): 1-8.
[30] Chen, H., Wang, K., Ming, X., Zhan, F., Muhammad, Y., Wei, Y., Li, W., Zhan, H. (2021). The efficient removal of calcium and magnesium ions from industrial manganese sulfate solution through the integrated application of concentrated sulfuric acid and ethanol. Metals, 11(9): 1339. https://doi.org/10.3390/met11091339
[31] Liu, W., Singh, R.P., Jothivel, S., Fu, D. (2020). Evaluation of groundwater hardness removal using activated clinoptilolite. Environmental Science and Pollution Research, 27: 17541-17549. https://doi.org/10.1007/s11356-019-06193-9