Warji Warji*![]() | Siti Suharyatun
| Siti Suharyatun![]() | Ahmad Tusi
| Ahmad Tusi![]() | Ardia B. Soma
| Ardia B. Soma![]()
© 2024 The authors. This article is published by IIETA and is licensed under the CC BY 4.0 license (http://creativecommons.org/licenses/by/4.0/).
OPEN ACCESS
Cultivating plants involves the process of watering from seedling to mature plants. Watering on a production scale or large area requires technological. Plants have specific environmental conditions for their growth; therefore, the utilization of technology is crucial specially to grow urban vegetables with microgreens. This research process involves the development of a small-scale watering system prototype. Electronic devices are interconnected into a single system where sensors read soil moisture values. The data is transmitted to a microcontroller, which generates outputs in the form of watering that can move towards the sensor coordinates with low humidity. This research aims to produce a tool that monitors and controls the moisture of the planting media on a prototype scale for microgreen. The prototype was successfully designed, as evidenced by the results of soil analyzer calibration, sensor validation, sensor on-off testing, and actuator timing. This prototype has been calibrated using a soil analyzer with a R2 of 0.984. Sensor validation is performed using previous calibration data, resulting in an R2 value of 0.999. The system's response from off to on state requires 2.02 seconds. Monitoring and activating the actuator have an average time of 5.43 seconds.
agricultural technology, Arduino Uno, control system, microcontroller, microgreens, sensor calibration, soil moisture monitoring, water irrigation
Plants are living creatures that need water to survive. Therefore, taking care of plants by watering them is important because plants need an adequate water supply so that the photosynthesis process can run well. The availability of sufficient water also plays an important role in plant growth, because water affects the moisture of the soil or planting medium [1, 2].
Along with the times and people's lifestyles are starting to adopt healthy lifestyles, many people are starting to consume fresh vegetables which are rich in nutrients [3, 4]. Urban gardening and microgreen innovations are solutions to meet vegetable needs in limited agricultural land due to increasing population [5-11].
Microgreens are a type of small, edible vegetable or young plant with a soft texture [6, 8, 12, 13]. This type of small vegetable comes from the seeds of various vegetable species, aromatic herbs, or edible wild species. The harvest time for microgreens depends on the species planted, but in general they can be harvested 7-21 days after germination when the cotyledons open and the first leaves fully grow [10]. Harvesting microgreens simply involves cutting the plant just above the surface of the growth medium to a length of around 3-9 cm without roots [14, 15].
A microgreen plant's environment significantly influences its growth through a number of important factors. Maintaining an environmental temperature within a comfortable range of 20-25℃ is necessary for most types of microgreens. Lighting is a vital element in this growth process; ideally, microgreens require 4-6 hours of direct sunlight per day, however, grow lights can be an alternative if natural sunlight is insufficient. The water used to water microgreens has a pH of between of 5.6-6.5 [16, 17].
The rapid development of technology makes human activities easier, especially in the agricultural sector. Therefore, the research aims to develop a prototype of an Arduino-based automatic plant watering system that can move according to coordinates. The advantages of using an Arduino based automated irrigation system include optimization of water use, precise application of water, and flexibility in operation. Arduino Uno R3 is a control board product under the Arduino brand which is basically an electronic board equipped with an ATMega328 microcontroller (a chip that functions like a computer in terms of functionality) [18-20].
This board can be used to design various electronic circuits, from simple to complex. One of them is controlling LED lights and controlling robots, all of which can be realized using this board, which is relatively small size. In fact, by adding certain additional components, developers can use this board to monitor and control temperature, humidity and light intensity conditions.
The essential role in urban gardening practices is irrigation and it can largely contribute to operation cost. Automatic irrigation can decrease water wastage and less human intervention. This tool was created to help farmers water their plants which previously had to be done manually to become automatic with soil moisture sensors, pumps and microcontrollers. So the measure of soil moisture is adjusted based on the plant's water needs. This tool is accompanied by an LCD which functions to monitor soil conditions, whether damp or barren according to the results of the sensor in the form of values on the LCD.
Automatic watering is a form of plant control in making the conventional watering process automatic with the help of several electronic components such as sensors, pumps and microcontrollers which are built into one unified system so that it can produce output in the form of watering plants.
One watering method that has quite high efficiency is the bulk irrigation method, where in this method the water discharge can be regulated and has pressure so that the water can spread over the planting medium. However, watering still cannot be spread widely if only using the bulk irrigation method because it only has certain coverage limits. Therefore, it is necessary to build a drive line to direct the nozzle on the sprinkler irrigation towards several coordinates of the planting media that you want to water.
The aim of this research is to build and test the performance of a prototype automatic watering system for pressure irrigation that can move according to the coordinates of the planting medium.
2.1 Tools and materials
The tools used in this research are the Arduino Uno R3 microcontroller, resistive type soil moisture sensor, RTC, MMC jumper cables, dht22, ln298n sensors, DC connector, stepper motor, and 16x2 i2c LCD. The materials used in this research were roasted husks, water and vegetable seeds.
This research was carried out at the Agricultural Power and Machine Tools Laboratory, Department of Agricultural Engineering, Faculty of Agriculture, University of Lampung. This research was conducted from September to November 2024.
2.2 Prototype design
The design criteria for this prototype is that it is able to measure the moisture content of the planting media by detecting trays that have moisture levels below the specified setting point, so that the microcontroller can provide output in the form of watering according to the water needs of the planting media using a pump. Detection is carried out in real time and watering data is stored on a memory card installed in the system circuit. The watering carried out can move in the direction of the sensor coordinates, so that automatic watering can increase the effectiveness and efficiency of the watering process. The planting medium used in collecting this prototype data was roasted husks and the vegetables used were green spinach using the sprinkler irrigation watering method. This prototype can be used in small-scale farming such as seeding and mini vegetables such as microgreens.
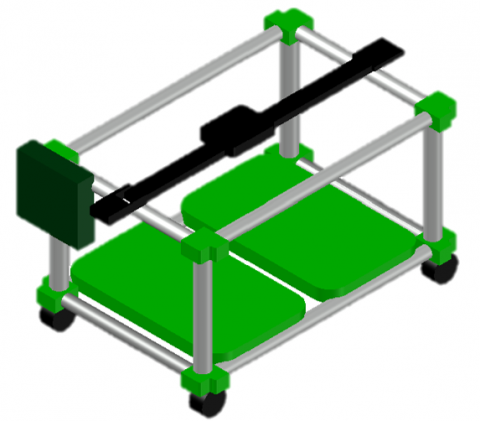
This research prototype design includes structural design at the implementation stage such as microgreens rack and tray design, watering system, equipment circuit schematics, program design, linear rail design and assembly of electronic components to the microcontroller, it shown in Figure 1.
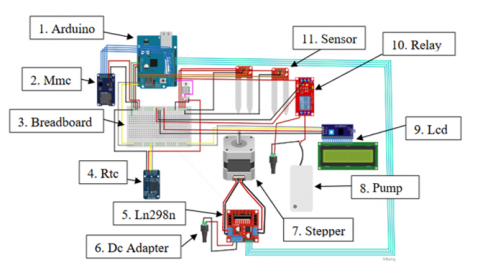
Design a watering rack with shelf dimensions of 38cm long and 57cm wide and 25cm for shelf height. The size of this shelf is adjusted for a prototype or small scale so it is hoped that it can be developed on a larger scale. The schematic layout of the electronic components used to build a watering system that can move according to the coordinates and setting points applied is made as shown in the schematic in Figure 2.
Figure 1. Network schematic
Figure 2. Design of the automatic moving irrigation system
2.3 Performance test
After the schematic has been installed according to the pins on the Arduino, the data is analyzed using Microsoft Excel software and the Arduino IDE application for system development. Then there are the parameters to observe:
2.3.1 Calibration and validation
Calibration is the process of determining the accuracy of the values indicated by measuring instruments and measuring materials by comparing them with measurement standards. Calibration and validation are used to evaluate the suitability of the built device to applicable standards. The use of a calibration method based on the comparison and interpolation method is to increase the accuracy of sensor measurements [21]. Sensors and electronic instruments such as temperature sensors, humidity sensors and pressure sensors need to be calibrated to ensure accuracy and consistency in providing measurement data [22, 23]. The result of these measurements is that researchers can find out the comparison of values between the designed tools and the specified values. This aims to increase the accuracy of a sensor to be able to measure the value of the sensor.
This research uses a linear regression calibration method where the values obtained from the sensor will be entered into Microsoft Excel. Data then processed into a regression graph so that the output obtained from processing the values or data become a mathematical variable for sensor readings. These variables are then entered into the Arduino syntax so that the sensor readings have a slight comparison with the calibrator. The calibration process in this research was carried out using variations in soil moisture by adding around 50 ml of water to the measuring instrument for 5 trials.
This research uses a linear regression [24-26] calibration method with a soil analyzer device. The equation used in this research is [27]:
$y=\beta_0+\beta_1 x+\epsilon$ (1)
The data is processed using the Microsoft Excel application and the variables obtained are entered into the syntax on the Arduino IDE. Comparison of values in the calibration process is used to determine the number of differences between sensors and calibrators, one of which is by using the correlation coefficient. A guide to interpreting correlation coefficients can be seen in Table 1 [28].
Table 1. Example of a Conventional Approach to Interpreting a Correlation Coefficient
|
Absolute Magnitude of the Observed Correlation Coefficient |
Interpretation |
|
0.00-0.10 |
Negligible correlation |
|
0.10-0.39 |
Weak correlation |
|
0.40-0.69 |
Moderate correlation |
|
0.70-0.89 |
Strong correlation |
|
0.90-1.00 |
Very strong correlation |
2.3.2 Accuracy
This research tested the level of accuracy in the moisture content values in the planting media. Sensor accuracy testing aims to determine the level of accuracy of the sensor in the prototype circuit to transmit data displayed by the tool. Taking reference data with 15 tests to determine the accuracy and reliability values of the tool. The equation used to determine the level of accuracy of this research is as follows:
$\left(1-\frac{\frac{\left(\sum_{i=1}^n|S P-N A i|\right.}{n}}{S P}\right) \times 100 \%$ (2)
where, SP, NAi, and n are Setting point value, first actual value, and number of data respectively.
2.3.3 System response
System response is a change in output behavior as a result of a change in the input signal. The system response test aims to determine the time required by the tool to process program data. The system response is expressed in the form of a curve which is used as a basis for analyzing system properties, in addition to using mathematical equations. There are two types of system response that can be distinguished, namely time response and frequency response. Time response is a response that determines system performance based on observations of how the form of system output changes over time. Meanwhile, frequency response is a response that measures system performance by paying attention to the magnitude and phase angle of the system's gain (output/input) to sine signals at various different frequencies.
System response can be used to identify stability, transient characteristics, steady state errors, and other aspects related to system quality and safety. To analyze the system response, various methods can be applied, including graphical methods, mathematical methods, and numerical approaches.
The system response can explain how quickly the tool works when faced with disturbances and changes in time. The response of this system generally consists of two types, namely transient response and steady state response. This transient response can indicate the duration of time from when the system is operated (at point 0) until it reaches steady state conditions. The response from the steady state condition can determine the length of time when the system has reached a state of balance up to an infinite time or a time that has been set on the tool.
This research tested the system response with several tests, namely the length of time to turn on the tool until the sensor can read stably, and the time required to carry out the close looping process on the prototype mechanism. After the system response for sending sensor data is obtained, the next step is testing the response when monitoring and controlling the actuator.
2.3.4 Sensor stability
Sensor stability testing is an evaluation process carried out to assess the extent of a sensor's ability to maintain consistent measurements of a parameter within a certain period of time. The purpose of testing the stability of the irrigation system prototype is to determine the level of stability of the prototype circuit built against the given setting point. This evaluation involves comparing sensor readings with values measured by more accurate measurement devices. The results of this evaluation are useful for determining whether the sensor can be used for data collection or not.
A monitoring tool can be said to be stable if the controlled variable is always at or close to a predetermined value or set point. The automatic watering system has a data collection process on the planting medium to obtain the humidity level, this is so that when the sensor data exceeds the set point, the pump will turn on to provide an adequate water supply to the plants.
This research carried out tool stability testing which was carried out over 5 trials. With differences in setting point sizes between 30%, 40%, 50%, 60%, and 70%, the data was taken at 3 minutes intervals in several tests.
2.3.5 Droplet uniformity
This research uses a sprinkler irrigation system or what is usually called bulk irrigation. This irrigation system is an irrigation system that has quite high efficiency and effectiveness. Therefore, it is very necessary to measure the uniformity of droplets on the planting medium to obtain water distribution values using the method of Christiansen [29-32].
$C U=100 \%\left(1+\frac{D}{\bar{y}}\right)$ (3)
$\mathrm{D}=\sqrt{\frac{\sum(y i-\overline{\mathrm{y}})^2}{n-1}}$ (4)
where, CU is the uniformity coefficient (%), D is standard deviation, $\overline{\mathrm{y}}$ is average observed, yi is observed value, and n is number of observations.
Collecting data on droplet uniformity in this study used 6 measuring cups with a diameter of 5.5cm which were placed under the microgreens tray. The nozzle is placed 16cm high from the planting medium. The planting medium used in collecting this data was burnt husks with a humidity setting point of 50%.
The nozzle is used to atomize or split water so that the water pushed by the pump becomes granules or what is usually called bulk irrigation (sprinkler). This research uses three types of nozzle variants to obtain a comparison of droplet uniformity values. The nozzle type can be seen in Figure 3.
The nozzle specifications used in this research have a working pressure of 1.5-3.0bar/kg, a watering radius of 0.7-0.9 meters with a flow of 8-10 liters per hour, is shown in Table 2. However, in this study the nozzle used had slight modifications, especially when watering [33].
Figure 3. Types of nozzles
Table 2. Nozzle specifications
|
Specification |
Type 1 |
Type 2 |
Type 3 |
|
Pressure (bar/kg) |
1.5-3.0 |
1.5-3.0 |
2-3 |
|
Spray radius (m) |
0.7-0.9 |
0.7-0.9 |
0.7-0.9 |
|
Flow (liters/hour) |
8-10 |
8-10 |
8-10 |
|
Nozzle size (mm) |
0.5 |
0.5 |
0.8 |
Table 3. Criteria for the level of drip uniformity of drip irrigation systems according to ASAE
|
Criteria |
Statistical Uniformity (SU) |
Coefficient of Uniformity (CU) |
|
Very good |
95%-100% |
94%-100% |
|
Good |
85%-90% |
81%-87% |
|
Fair |
75%-80% |
68%-75% |
|
Bad |
65%-70% |
56%-62% |
|
Not feasible |
<60% |
< 50% |
The method for collecting droplet uniformity data in this research is to design a watering prototype with a height of 16cm from the planting medium, then attach a nozzle to the end of the hose and then activate the pump to obtain uniformity values. In this study, researchers used 3 types of nozzles. Observations were carried out for 12 minutes with water discharge measurements every 2 minutes. Droplet uniformity shown in Table 3 [34].
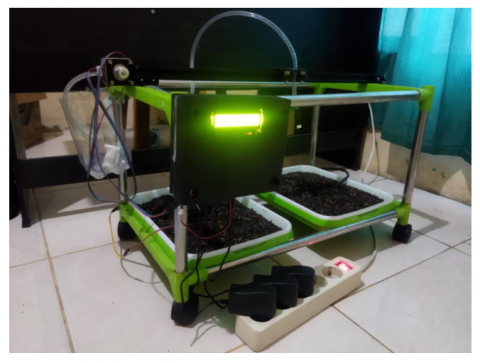
The results of this research's automatic watering system prototype design are in the form of a series of tools and components that are connected into one function, so that the process of monitoring and controlling the value of soil moisture or planting media and environmental temperature can be carried out. This design is an initial prototype of a tool that has an automatic watering function that follows a tray or container that has a humidity level in the planting medium below specified parameters. All components are placed in a plastic box with dimensions of 16cmx13cmx8cm to avoid water or factors that could disrupt the stability of the tool's performance. The results of the prototype design are shown in Figure 4.
The electronic components in this prototype are connected by jumper cables to each component. To connect parallel currents, a breadboard is used as a supporting component to conduct current to each electronic device installed. Using a breadboard also makes it easier to carry out try and error tests when designing this prototype. The first stage in installing components is reading each datasheet for each electronic component being installed. The components installed in this circuit function to create a unified function; an automatic watering process that can move.
Figure 4. Prototype of automatic moving irrigation system
3.1 Sensor calibration and validation
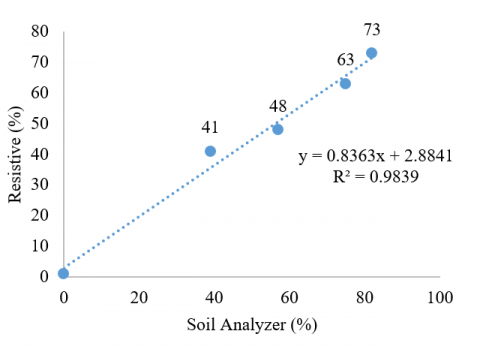
The first calibration process is calibrating the moisture sensor with a resistive type. This sensor has a performance system that conducts electricity into the planting medium to determine the level of moisture in the planting medium which has water content or humidity because water is a conductor or conducts current. The resistive type soil moisture sensor measures soil moisture by utilizing the principle of resistance. This sensor consists of two electrodes arranged in thin, parallel layers. When the sensor comes into contact with the soil, the resistance between the electrodes will change according to the water content of the soil. The higher the water content in the soil, the lower the resistance between the electrodes. Reading sensor data with a calibrator is shown in Figure 5.
Figure 5 shows the calibration data on the resistive type soil moisture sensor which results in a coefficient of determination (R²) value of 0.9839 or 98.39% with the equation value being y=0.8363x+2.8841. The coefficient of determination R² value produced at this calibration stage, it can be said that the relationship between the sensor and the calibrator is very strong because the resulting value is 0.984. The value read in the resistive sensor is close to the actual measurement value in the soil analyzer.
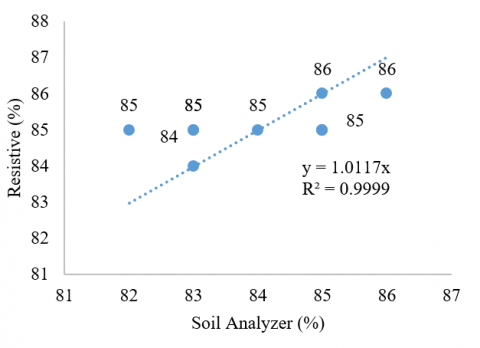
The coefficient obtained on this resistive type sensor is classified as very strong. Therefore, the next stage of sensor calibration in this research is carried out by sensor calibration testing or what can be called a validation test to determine the further coefficient determination from sensor value readings. Validation test data is shown in Figure 6.
Figure 5. Resistive type soil moisture sensor value
Figure 6. Validation test of resistive type soil moisture sensor values
3.2 Accuracy of sensor
Testing sensor accuracy in this research aims to determine the level of accuracy of sensors in a series of prototypes to transmit data displayed via the LCD on the tool. Testing the accuracy of the sensor is carried out by taking the value of soil moisture content in the planting media using a soil moisture sensor and an environmental temperature sensor.
Table 4. Tool accuracy analysis
|
Time (min) |
Reference (%) |
Sensor Value (%) |
Calibrator (%) |
Error (%) |
|Error| (%) |
Average |Error| (%) |
|
3 |
|
30.2 |
30.5 |
0.3 |
0.3 |
|
|
6 |
30.5 |
30.2 |
30.4 |
0.2 |
0.2 |
0.2 |
|
9 |
|
30.6 |
30.5 |
-0.1 |
0.1 |
|
|
12 |
|
40.1 |
40.1 |
0 |
0 |
|
|
15 |
40.1 |
40.4 |
40.2 |
-0.2 |
0.2 |
0.17 |
|
18 |
|
40.5 |
40.2 |
-0.3 |
0/3 |
|
|
21 |
|
55.9 |
55.7 |
-0.2 |
0.2 |
|
|
24 |
55.7 |
55.6 |
55.6 |
0 |
0 |
0.07 |
|
27 |
|
55.7 |
55.7 |
0 |
0 |
|
|
30 |
|
62.4 |
62.6 |
0.2 |
0.2 |
|
|
33 |
62.6 |
62.4 |
62.7 |
0.3 |
0.3 |
0.27 |
|
36 |
|
62.3 |
62.6 |
0.3 |
0.3 |
|
|
39 |
|
75.3 |
75.3 |
0 |
0 |
|
|
42 |
75.4 |
75.2 |
75.6 |
0.4 |
0.4 |
0.2 |
|
45 |
|
75.1 |
75.3 |
0.2 |
0.2 |
|
|
Averate of all |Error| (%) |
0.182 |
|||||
Figure 7. Advanced stage accuracy test reading
Accuracy of sensor testing was carried out using conventional measuring instruments. The results of this measurement, if the parameter value obtained is smaller in error value, the more accurate the sensor reading will be. The error value can be calculated by subtracting the value displayed on the LCD. This process to obtain the average value is carried out by means of the average error results obtained then raised to the power of two and then divided by the number of test data after rooting. The observation table for stage 1 analysis in collecting this data is presented in Table 4.
Follow-up observations from the first stage of data collection analysis, namely stage 2 analysis to determine and calculate the level of accuracy of the tool based on the accuracy equation.
The testing stage was carried out by taking data on the prototype design created and then carrying out data comparison testing using a soil analyzer. Based on the observation Figure 7, it is found that the data circuit accuracy level is 99.6% so it can be concluded that the circuit built has a good level of accuracy.
3.3 System response of sensor
System response testing is a testing stage for control and monitoring tools which aims to determine the time required by the tool to process program data. The system response testing process is carried out in several test mechanisms, namely the time needed to turn on the tool to the speed of the sensor measurement, the time needed to turn on the drive actuator and pump, and the time needed to turn on the tool and save the data on the SD card. The system response test functions to determine and determine the duration of controlling the monitoring tool or prototype so that the designed tool can be reviewed and classified to determine the specifications for the prototype being built.
Then, after the response for reading the monitoring data is obtained, proceed to the next stage of testing for the response when controlling the actuator using a pump and nozzle actuator. This test was carried out five times 16 times on the sensor value readings, then the tool and test results were recorded and the average results were searched for each system response. The results of testing the system response to turning on the tool and reading the values shown in Table 5.
Based on testing the system response to sensor readings, the average reading speed on the soil moisture sensor is 2.02 seconds with a standard deviation of 0.12027781. Observation of the system response test is needed to determine the duration of sensor value readings in the system circuit. The next stage of the system response test is taking control duration data on the actuator used, in this case the 5 V DC pump and stepper motor function as actuators for the automatic watering system.
The next stage of the system response test is to measure the response duration of an actuator in a series of automatic watering equipment systems that can move according to coordinates. The process of testing the system response is carried out using several test mechanisms, namely when turning on the tool until displaying the value indicator as output and operating the actuator in the prototype circuit. The data obtained for the average pump activation was 5.63 seconds, is shown in Table 6, and for the prototype response in activating the stepper motor, it was 3.3 seconds.
Table 5. Test results of system response
|
Time (minute) |
Sensor Value (%) |
Calibrator (%) |
Reading Speed (s) |
STDev.P |
|
3 |
30.2 |
30.5 |
1.42 |
0.063770422
|
|
6 |
30.2 |
30.4 |
1.56 |
|
|
9 |
30.6 |
30.5 |
1.55 |
|
|
12 |
40.1 |
40.1 |
1.64 |
0.095684667
|
|
15 |
40.4 |
40.2 |
1.46 |
|
|
18 |
40.5 |
40.2 |
1.68 |
|
|
21 |
55.9 |
55.7 |
1.86 |
0.078457349 |
|
24 |
55.6 |
55.6 |
1.79 |
|
|
27 |
55.7 |
55.7 |
1.98 |
|
|
30 |
62.4 |
62.6 |
2.15 |
0.020548047
|
|
33 |
62.4 |
62.7 |
2.17 |
|
|
36 |
62.3 |
62.6 |
2.20 |
|
|
39 |
75.3 |
75.3 |
2.95 |
0.342928564
|
|
42 |
75.2 |
75.6 |
2.53 |
|
|
45 |
75.1 |
75.3 |
3.37 |
|
|
Average |
2.02 |
0.120277810 |
||
Table 6. Prototype system response
|
No. |
Pump On (s) |
Stepper Motor (s) |
|
|
1 |
5.67 |
4.23 |
|
|
2 |
5.78 |
4.55 |
|
|
3 |
5.6 |
4.43 |
|
|
4 |
5.9 |
4.65 |
|
|
5 |
5.2 |
3.77 |
|
|
Average |
5.63 |
4.326 |
|
|
Total average |
4.978 |
||
3.4 Stability of sensor
The sensor stability test is needed to determine the level of stability of the sensor in reading the moisture content of the planting medium. With the time and error parameters obtained, researchers are able to define which components have high enough stability so that they can be used as a reference in further research.
This sensor stability data collection aims to measure the level of sensor stability in reading the moisture content of the planting medium, in this case the researcher used husk charcoal planting media and the data observed included the average sensor readings, standard deviation and reliability values. The test data for this sensor can be seen in Table 5.
Based on the data in Table 3, it can be concluded that the stability test on the resistive type soil moisture sensor has a very good value with an average all error 0.182% so it can be concluded that the resistive sensor can be used for application in the automatic watering process.
3.5 Uniformity of droplet
Using a nozzle to get the best sprinkler-based watering system design, the droplet uniformity coefficient must be close to or even up to 100%, so that plants get a uniform or equal amount of water for photosynthesis and consumptive processes. However, the reality is that it is difficult to get a coefficient that is close to 100% because there are many factors that influence the uniformity of the droplets to reach a perfect level.
Based on Table 7 and Eqs. (3) and (4), it is known that the best droplet uniformity coefficient is found in Type 1 nozzle with a uniformity value of 88%, then the lowest droplet uniformity is found in Type 3 with a uniformity value of only 84% and for Type 2, the nozzle has a value between Type 1 and Type 3 with a score of 87%. Based on the table of criteria for the level of droplet uniformity, it can be concluded that the Type 1 nozzle has good criteria.
Table 7. Level of droplet uniformity
|
Sample Glass |
Type 1 |
Type 2 |
Type 3 |
|
1 |
27 |
29 |
22 |
|
2 |
24 |
30 |
25 |
|
3 |
28 |
25 |
30 |
|
4 |
29 |
26 |
24 |
|
5 |
20 |
36 |
26 |
|
6 |
25 |
33 |
35 |
|
Average (m3) |
25.5 |
29.8 |
27.0 |
|
Standard deviation (m3) |
3.0 |
3.8 |
4.3 |
|
Droplet Uniformity (%) |
88% |
87% |
84% |
This research designs a prototype tool that can monitor and control the moisture content of planting media in the form of watering with a pressure irrigation system or sprinkler. The watering process carried out can move in the direction of the coordinates of sensor that have humidity levels below the specified parameters. This prototype can monitor in real time with the results of the monitoring data stored on the memory card. The sensor used in this research is a resistive type of soil moisture sensor. Sensor validation produces an average error value of 1.2% while the resulting average accuracy is around 98.8%. The stability test shows a stable condition because the tool can maintain the amount of plant water needed according to the readings on the sensor. The response results of this prototype system are able to provide output in the form of automatic watering that can move with a time span of 5 seconds. The droplet uniformity value obtained in this study was very good at 88%.
This work supported by Faculty of Agriculture, University of Lampung, Indonesia.
|
ASAE |
The American Society of Association Executives |
|
cm |
Centimeter |
|
CU |
Uniformity coefficient |
|
D |
Standard deviation (%) |
|
DC |
Direct Current |
|
IDE |
Integrated Development Environment |
|
LCD |
Liquid Cristal Display |
|
LED |
Light Emitting Diode |
|
MMC |
Multi Media Card |
|
n |
Number of data |
|
NAi |
First actual value |
|
RTC |
Real Time Clock |
|
SD |
Secure Digital |
|
SP |
Setting point value |
|
SU |
Statistical Uniformity |
|
V |
Volt |
|
y |
Dependent variable |
|
x |
Independent variable |
|
b0 |
Constant (intercept) |
|
b1 |
Regression coefficient (slope) |
|
$\epsilon$ |
Error |
[1] Xue, R., Shen, Y., Marschner, P. (2017). Soil water content during and after plant growth influence nutrient availability and microbial biomass. Journal of Soil Science and Plant Nutrition, 17(3): 702-715. https://doi.org/10.4067/S0718-95162017000300012
[2] Haj Sghaier, A., Tarnawa, Á., Khaeim, H., Kovács, G.P., Gyuricza, C., Kende, Z. (2022). The effects of temperature and water on the seed germination and seedling development of rapeseed (Brassica napus L.). Plants, 11(21): 2819. https://doi.org/10.3390/plants11212819
[3] Silva, P., Araújo, R., Lopes, F., Ray, S. (2023). Nutrition and food literacy: Framing the challenges to health communication. Nutrients, 15(22): 4708-4730. https://doi.org/10.3390/nu15224708
[4] Ridzuan, A.R. bin, Karim, R.A., Marmaya, N.H., Razak, N.A., Khalid, N.K.N., Yusof, K.N.M. (2018). Public awareness towards healthy lifestyle. International Journal of Academic Research in Business and Social Sciences, 8(10): 927-936.. http://dx.doi.org/10.6007/IJARBSS/v8-i10/4790
[5] Kariasa, I.G.K., Nengah, M.I., Yuli, M.S.Y. (2024). Microgreen as a minimalist vegetable cultivation innovation in supporting food security family in Urban Areas. Indonesian Journal of Agriculture and Environmental Analytics, 3(1): 13-22. https://doi.org/10.55927/ijaea.v3i1.8482
[6] Lone, J.K., Pandey, R. (2024). Microgreens on the rise: Expanding our horizons from farm to fork. Heliyon. 10(4): 25870. https://doi.org/10.1016/j.heliyon.2024.e25870
[7] Du, M., Xiao, Z., Luo, Y. (2022). Advances and emerging trends in cultivation substrates for growing sprouts and microgreens toward safe and sustainable agriculture. Current Opinion in Food Science, 46: 100863. https://doi.org/10.1016/j.cofs.2022.100863
[8] Amil, M.A., Saad, H.M., Tan, C.H., Sim, K.S. (2024). A review of microgreens in southeast Asia: Sustainable agriculture, phytochemicals, and biological activities. International Journal of Biotechnology and Biomedicine (IJBB), 1(1): 19-71. https://doi.org/10.31674/ijbb.2024.v01i01.003
[9] Tomatis, F., Egerer, M., Correa-Guimaraes, A., Navas-Gracia, L.M. (2023). Urban gardening in a changing climate: A review of effects, responses and adaptation capacities for cities. Agriculture, 13(2): 502-518. https://doi.org/10.3390/agriculture13020502
[10] Dewanggi, R.P., Irham, Perwitasari, H. (2022). The sustainability of vegetable urban farming in yogyakarta city. Journal of Agribusiness Management and Development, 3(1): 1-7. https://doi.org/10.22146/jamadev.v3i1.974
[11] Wahyuni, R., Sentana, J.T., Muhardi, M., Irawan, Y. (2021). Water level control monitoring based on Arduino Uno R3 ATMega 238p using Lm016l LCD at STMIK hang tuah pekanbaru. Journal of Robotics and Control (JRC), 2(4): 265-269. https://doi.org/10.18196/jrc.2489
[12] Zhang, Y., Xiao, Z., Ager, E., Kong, L., Tan, L. (2021). Nutritional quality and health benefits of microgreens, a crop of modern agriculture. Journal of Future Foods, 1(1): 58-66. https://doi.org/10.1016/j.jfutfo.2021.07.001
[13] Bhaswant, M., Shanmugam, D.K., Miyazawa, T., Abe, C., Miyazawa, T. (2023). Microgreens-A comprehensive review of bioactive molecules and health benefits. Molecules, 28(2): 867-891. https://doi.org/10.3390/molecules28020867
[14] Treadwell, D., Hochmuth, R., Landrum, L., Laughlin, W. (2020). Microgreens: A new specialty crop: HS1164, rev. 9/2020. Edis, 2020(5): 1164-1165. https://doi.org/10.32473/edis-hs1164-2020
[15] Boles, H.O., Poulet, L., Johnson, C.M., Torres, J.J., Koss, L.L., Spencer, L.E., Massa, G.D. (2023). Design, build and testing of hardware to safely harvest microgreens in Microgravity. Gravitational and Space Research, 11(1): 1-14. https://doi.org/10.2478/gsr-2023-0001
[16] Thepsilvisut, O. Sukree, N., Chutimanukul, P., Athinuwat, D., Chuaboon, W., Poomipan, P., Vachirayagorn, V., Pimpha, N., Chutimanukul, P., Ehara, H. (2023). Efficacy of agricultural and food wastes as the growing media for sunflower and water spinach microgreens production. Horticulturae, 9(8): 879-896. https://doi.org/10.3390/horticulturae9080876
[17] Alexopoulos, A.A., Marandos, A., Assimakopoulou, N., Vidalis, S.A., Petropoulos, E., Karapanos, I.C. (2021). Effect of nutrient solution pH on the growth, yield and quality of taraxacum officinale and reichardia picroides in a floating hydroponic system. Agronomy, 11(6): 1118-1133. https://doi.org/10.3390/agronomy11061118
[18] Erham, E., Markus, M., Sopianti, W.P. (2018). Design of a new on-off controller based on Arduino UNO R3 with application to Window A/C. IPTEK Journal of Proceedings Series, (3): 174-182. http://dx.doi.org/10.12962/j23546026.y2018i3.3726
[19] Sumarah, J., Wulandari, A.T., Tafrikhatin, A., Benedi, J., Pambudi, A.R. (2024). Making an Arduino Uno R3 trainer as a learning support tool in the electronics study program. Jurnal E-Komtek (Elektro-Komputer-Teknik), 8(1): 40-45. https://doi.org/10.37339/e-komtek.v8i1.1750
[20] Taufiq, A.J., Kurniawan, I.H., Nugraha, T.A.Y. (2020). Analysis of Arduino Uno application on control system based on industrial scale. IOP Conference Series: Materials Science and Engineering. IOP Publishing, 771(1): 012015. https://doi.org/10.1088/1757-899X/771/1/012015
[21] Ahmadi, A., Setiawan, A., Gunawati, G., Dewi, R. (2023). Calibration of arduino-based temperature sensors for parabolic solar collectors with phase change material. MOTIVECTION: Journal of Mechanical, Electrical and Industrial Engineering, 5(3): 547-556. https://doi.org/10.46574/motivection.v5i3.220
[22] Albrecht, S., Bakker, E.J., de Jong, J.A., Tubbs, R.N., Meisner, J.A., Le Poole, R.S. (2004). Calibration of temperature and relative humidity sensors for use on the VLT-Interferometer. In New Frontiers in Stellar Interferometry. SPIE, 5491: 1266-1273. https://doi.org/10.1117/12.561882
[23] Ladino, K.S., Sama, M.P., Stanton, V.L. (2022). Development and calibration of pressure-temperature-humidity (PTH) probes for distributed atmospheric monitoring using unmanned aircraft systems. Sensors, 22(9): 3261-3286. https://doi.org/10.3390/s22093261
[24] El Chaal, R., Aboutafail, M.O. (2022). Comparing artificial neural networks with multiple linear regression for forecasting heavy metal content. Acadlore Transactions on Geosciences, 1(1): 2-11. https://doi.org/10.56578/atg010102
[25] Yu, S.P., Mao, W.W. (2024). Microwave detection system for wheat moisture content based on metasurface lens antennas. Acadlore Transactions on AI and Machine Learning, 3(4): 193-201. https://doi.org/10.56578/ataiml030401
[26] Khairunnisa, A., Astuti, C.D., Hussein, M.M. (2024). The influence of board diversity and environmental committees on carbon emission disclosures in Southeast Asian corporations. Journal of Green Economy and Low-Carbon Development, 3(1): 26-35. https://doi.org/10.56578/jgelcd030103
[27] Theofani, G., Sediyono, E. (2022). Multiple linear regression analysis on factors that influence employees work motivation. Sinkron: Jurnal dan Penelitian Teknik Informatika, 6(3): 791-798. https://doi.org/10.33395/sinkron.v7i3.1145
[28] Schober, P., Boer, C., Schwarte, L.A. (2018). Correlation coefficients: Appropriate use and interpretation. Anesthesia & Analgesia, 126(5): 1763-1768. https://doi.org/10.1213/ANE.0000000000002864
[29] Maroufpoor, S., Shiri, J., Maroufpoor, E. (2019). Modeling the sprinkler water distribution uniformity by data-driven methods based on effective variables. Agricultural Water Management, 215: 63-73. https://doi.org/10.1016/j.agwat.2019.01.008
[30] Maroufpoor, E., Faryabi, A., Ghamarnia, H., Moshrefi, G.Y. (2010). Evaluation of uniformity coefficients for sprinkler irrigation systems under different field conditions in Kurdistan Province (Northwest of Iran). Soil Water Res., 5(4): 139-145. https://doi.org/10.17221/42/2009-SWR
[31] Clavitea, A., Mamani, J.A., Huaquisto, E., Alfaro-Alejo, R., Belizario, G. (2023). Uniformity of water distribution in sprinkler irrigation mini-cannons in a high Andean community in Peru. E3S Web of Conferences. EDP Sciences, 434: 03028. https://doi.org/10.1051/e3sconf/202343403028
[32] Elhussiny, K.T., Hassan, A.M., Habssa, A.A., Mokhtar, A. (2023). Prediction of water distribution uniformity of sprinkler irrigation system based on machine learning algorithms. Scientific Reports, 13(1): 20885. https://doi.org/10.1038/s41598-023-47688-3
[33] Chen, R., Li, H., Wang, J., Guo, X. (2020). Effects of pressure and nozzle size on the spray characteristics of low-Pressure rotating sprinklers. Water, 12(10): 2904-2925. https://doi.org/10.3390/w12102904
[34] Li, H., Ma, Z., Zhang, G., Chen, J., Lu, Y., Li, P. (2024). Performance of a drip irrigation system under the co-application of water, fertilizer, and air. Horticulturae, 10(1): 6-28. https://doi.org/10.3390/horticulturae10010006