Gunardi D. Winarno*![]() | Ricky Avenzora | Sambas Basuni
| Ricky Avenzora | Sambas Basuni![]() | M. Bismark
| M. Bismark
© 2024 The authors. This article is published by IIETA and is licensed under the CC BY 4.0 license (http://creativecommons.org/licenses/by/4.0/).
OPEN ACCESS
The importance of understanding elephant movement patterns in relation to vegetation conditions in their home range is for sustainable habitat management strategies. This study aims to map the movement patterns of elephants across different habitat vegetation within their home range and to correlate these patterns with vegetation metrics such as species richness, diversity, and the Importance Value Index, as well as elephant feeding preferences. The study was conducted by placing 100 plots in the home range based on the intensity of the movement of elephants in various types of vegetation; primary forest, secondary forest, shrubs, and gardens in Bukit Barisan Selatan National Park. Movement data of elephants taken from GPS Collars available in WWF Lampung. Non-parametric statistical analysis using SPSS to test the significant relationship between variables (χ2). The results showed that the value of species richness, diversity, and evenness in a primary forest is high. The intensity of elephant movement is lowest in primary forest when compared to secondary forest, shrubs and gardens. The implications of this research are the importance of maintaining forests for the protection and development of elephant populations and the need to map areas frequently visited by elephants.
elephant movement, vegetation analysis, home range, habitat use
The study of elephant movement patterns on various vegetation types is not only for describing the movement from one vegetation to another but also to discover when and why the elephant becomes more intensive in a vegetation and how the elephant uses its characteristic of it [1, 2]. Vegetation Examine individual polygons or contiguous cells [3]. Usually, there is a dominant vegetation in the landscape called Matrix. While the long ways vegetation is called a corridor. A vegetation is a homogeneous area that can be distinguished from the surrounding area, the matrix is the dominating fragment landscape. While the corridor is a vegetation elongated, as a connector connectivity between vegetation. Vegetation, matrix, and corridors have an important role as a habitat for organisms that live in inside [4].
African elephants seeking refuge in forest habitats had seen a huge decline in numbers, despite more than a century of legal protection [5]. This shows how the habitats of currently occupied species that are experiencing a decline in these ranges cannot be considered to represent optimal habitats for these species. This assumption could place these species at risk of extinction [6]. For this reason, it is necessary to prioritize strict protection for the remaining forests. Forest protection from forest fires and illegal logging as well as restoration efforts.
The global loss of vagility alters a key ecological trait of animals that affects population persistence and ecosystem processes such as predator-prey interactions, nutrient cycling, and disease transmission [7]. There were significant differences between the utilization of open canopy areas, canopy medium compared to closed canopies, open areas, and water habitats (χ2=21.512; df=4; α=0.05; P<0.001) [8]. Besides the extensive movement of elephants, this group is a mega-herbivore wildlife component as a part of a biotic component in various vegetation in forest areas. The study that conducted by Koirala et al. [9] showed Asian elephants in Nepal eat fifty-seven species of plants in 28 families, including 13 species of grasses, five shrubs, two climbers, one herb, and 36 species of trees.
The species that contributed the greatest proportion of the elephant’s diet were Spatholobus parviflorus (20.2%), Saccharum spontaneum (7.1%), Shorea robusta (6.3%), Mallotus philippensis (5.7%), Garuga pinnata (4.3%), Saccharum bengalensis (4.2%), Cymbopogan spp. (3.7%), Litsea monopetala (3.6%) and Phoenix humilis (2.9%). The preference index (PI) showed that browsed species were preferred during the dry season, while browsed species and grasses were both important food sources during the rainy season. Leaves and twigs are the most targeted parts by elephants (P<0.05) [9]. The amount and variety of species on plants feed in various vegetation (primary forest, secondary forest, gardens, and shrubs) is certainly related to biodiversity and environmental conditions that can affect it. The relationship between land cover, species diversity and elephant food availability Is important to understand.
So far, there are no studies on the intensity of utilization of elephant home ranges related to species diversity, types of elephant food and types of vegetation. Therefore, the results of this study can be a complement to research on elephant habitat in Bukit Barisan Selatan National Park. It is important to carry out studies related to this with the following objectives:
(a) Analyzing the movement of elephants;
(b) Analyzing species diversity and important value index;
(c) Analyzing elephant feed species in various vegetation types.
2.1 Time and location
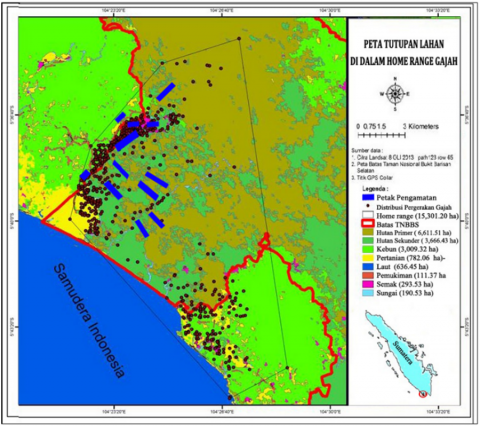
This research was conducted in 2010-2014 and the location in Bukit Barisan Selatan Bukit Barisan Selatan National Park (BBSNP) areas are located at 4°29'-5°57'S and 103°24'-104°44'E [10]. Generally, the BBSNP area consists of various ecosystems, such as swamps, estuaries, coastal forests, lowland rainforests, hill rainforests, low mountain rainforests, and high mountain rain. Research site on home range elephants located in Pemerihan-Way Haru Resort, BBSNP (Figure 1). The climate in this forest area is classified as humid months (100-200mm) to wet (>200mm). The lowest rainfall was 163mm in April, and the highest in October was 642.2mm. The average monthly rainfall is about 357.1mm. The annual rainfall is 2,500-3,000mm/year. The average altitude in the home range of elephants is about 115m above sea level, and the pitch temperature is between 26-37℃ [10].
Figure 1. Research location map
Three villages surround the research location; Pemerihan, Sumberejo and Way Haru Village, Bengkunat Belimbing Sub-District, Pesisir Barat District, Lampung Province. Generally, community work as a farmer. They plant corn and rice on rain-fed land. Yields of corn and rice are usually three times a year [10].
2.2 Materials and tools
The material used in this study generally consists of two parts: the elephant group and plant communities in various of vegetation. The movement of elephant groups has been recorded using GPS Collars, and data have already been available at WWF Lampung. The GPS collar used comes from the South African manufacturer Africa Wildlife Tracking (AWT).
GPS Collar data collection was conducted from January 2010 to December 2011 and continued from October 2012 to June 2013. GPS Collar records elephant movements every hour. Data gaps at time (2012) due to loss of GPS collar. But the 2013 data can be an accumulation to see elephant movement trends. It used to know the movement patterns of elephants and their home range. Data spatial of elephant movement pattern was processed by Erdas Imagine.
The plant community is determined by measuring plots. Data collections of vegetation were plotted in the elephant home range, which was distinguished based on vegetation types. It consists of primary forests, secondary forests, bushes, and gardens. Plot measurements placed on the various intensity of elephant movement known based on Kernel Method [11]. The tools used to invent tree species were work maps, GPS, rope, book, pens and roll meter.
The number of plots is 100 pieces spread over 8 lanes that are 1km long (10 plots/lane) and 4 lanes 500m long (5 plots/lane) which are spread within the elephant's roaming area. There are 30 plots in primary forest, 30 plots in secondary forest, 20 plots in shrubs and 20 plots in gardens. The number of plots spread across 4 types of vegetation shows the representation of vegetation dynamics. Changes in the number of species in each plot will be seen using the species area curve. The distance between the plots is 100m. It consists of 4 sub-plots, and its size is distinguished based on growth rates by the following information:
1) Seedling level: 2m×2m
2) Saplings level: 5m×5m
3) Pole level: 10m×10m
4) Tree level: 20m×20m
2.3 Data analysis
Elephant home range is obtained from the Minimum Convex Polygon or MCP method. The elephant movement intensity was using the Kernel method [11]. Data analysis included vegetation composition and structure, species richness, evenness, density, frequency, and dominance at the seedling, sapling, pole, and tree levels. The Importance Value Index (IVI) of each species is the sum of the relative density, relative frequency, and relative dominance of each species [12]. The IVI formula can be presented as follows:
IVI=RK+RF+RD (1)
where,
K (density) is the total individuals of species from all plots;
RK (Relative Density)=Kni/Ktotal×100%;
F (Frequency) is the number of plots found species;
RF (Relative Frequency)=Fni/Ftotal×100%;
D (Dominance) is the amount of basal area of species;
RD (relative dominancy)=Dni/Dtotal×100%.
Species richness (S) is the total of species in each vegetation type. Species richness is calculated based on 4 growth rates: trees, poles, saplings, and seedlings. The diversity of species was analyzed by using the Diversity Index (H’) [13], which is known as the Shannon-Weiner Diversity Index or known as the Shannon Index, using the following formula:
$\mathrm{H}^{\prime}=-\sum \frac{n i}{N} \operatorname{Ln} \frac{n i}{N}$ (2)
where,
H' is Shannon's diversity index and Pi is the proportion of the number of species i to the total number of species. The diversity index is a quantitative tool used to assess diversity in a specific community.
H’ values are categorized as follows [14]:
1) H' = 0 < 2: Low diversity;
2) H' = 2-3: Medium diversity;
3) H' ≥ 3: High diversity
Growth rate used the criteria as follows [15]:
1) Seedlings: species with height of ≤ 1.5m.
2) Saplings: species with height of > 1.5m, diameter < 10cm.
3) Poles: species with diameter 10-19cm;
4) Trees: species with diameter ≥ 20cm.
Species evenness (E’) is calculated to determine whether each plant species has the same number of individuals in the sample area. Analysis of species’ evenness is using Shannon’s Evenness or Equitability Index. The evenness of species ranges from 0 (uneven) to 1 (evenly distributed). Evenness index species (E') is calculated with the following formula [14]:
$E^{\prime}=\frac{H^{\prime}}{L \operatorname{n} S}$ (3)
where,
H' is Shannon’s diversity index, and S is the number of species. If the value of E=1 (maximum), it indicates that each species has the same number of individuals in a vegetation. The higher E value leads to more individuals in each species. The evenness index value ranges from 0-1. Furthermore, the evenness index based on Krebs [16] is categorized as follows:
1) 0<E≤0.5=Depressed community;
2) 0.5<E≤0.75=Unstable community;
3) 0.75<E≤1=Stable community.
Verification of species of elephant feed was conducted by checking the list for all species recorded by the reference of previous research. Observation in the field was conducted by directing notes of species that elephants ate. The density and distribution of feed species can be compared with the non-feed species on each type of vegetation on it. This condition is known as an important indication of anthropogenic and land degradation on feed species that may affect the intensity of elephant movement.
To determine the relationship between elephant movement variables and time period, spatial, H', vegetation type, proportion of elephant food variables, the chi square statistical test was used. Hypothesis 0 indicates there is no relationship between these variables. Hypothesis 1: There is a relationship between these variables. Non-parametric statistical tests using SPSS software.
3.1 Elephant movement pattern based on time
The movement of elephants during the day and night indicated a different tendency of mileage. Generally, the mileage of elephant movement during the day was higher than at night. The average mileage per hour during the day was 153m, while at night was 118m. The total mileage in a day was about 3,251m or 3.2km. The distance of elephant's movement per hour in day and night turned out to be significantly different (χ2count=204>χ2, tableα=0.05, df=11=19). The research that conducted by Mills et al. [17] reported that elephants moved faster near dawn (6:00±8:00) and dusk (17:00±20:00). However, hourly movement rates differ significantly with the season (significant interaction between time of day and season). Elephants visit grasslands at night, while in the daytime, they move into the forest to evade the sun and high temperatures in the grassland.
3.2 Elephant movement based on spatial
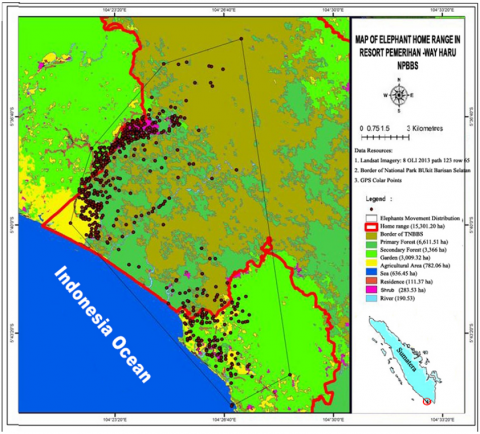
Elephant movements were monitored through GPS Collar to form a unique spatial pattern and size of the home range. Based on the MCP method or Minimum Covex Polygon, it is known that the elephant's home range at the Pemerihan-Way Haru Resort forms a pattern like an isosceles triangle with a large area was about 15,301.20 ha (Figure 2). The research that conducted by Sukmantoro et al. [18], in Riau Province that group of Angelina Elephant and group of Butet were monitored by GPS Collar for 336days (habitat area in MCP is 632.57km2) and 332days (the area of habitat in MCP is 701.60km2). The three elephants moved between 0 and 3km (87.6%). Desma’s movement is between 0 and 3km per day, 86.9% and 95.5% for Angelina and Butet, respectively). In the Seblat Elephant Conservation Center (SECC), Bengkulu Province of Sumatra, the home range size was 9,740 ha for the minimum convex polygon (MCP) and 9,500 ha for the 95% fixed kernel (FK), estimator [19]. There was no relation between average monthly elephant home range sizes or movement distances with rainfall.
Figure 2. The map of home range and vegetation variations on resort Pemerihan-Way Haru, BBSNP
In Gabon, forest elephants, on average, covered a distance of 2,840km each year and had a home range of 71,300 ha, with males covering a much larger home range than females [17]. Forest elephants showed daily and seasonal movement patterns. Every day, they move between forests and meadows at dawn and dusk. Seasonally, they spend more time in the meadow than in the forest during the short rainy season when the grass grows. Elephants traveled notably faster in grassland than in any other land cover type. Using 100% MCP, male elephants covered significantly larger home ranges than female elephants, but home ranges did not differ considerably between wet and dry seasons.
The research that conducted by Mills et al. [17] reported no support for sex differences in hourly movement rates. Elephants traveled obviously faster in grassland than in any other land cover type. Similarly, female and male elephants did not show significant differences in daily movement rates, although elephants traveled remarkably greater distances during the wet season than in the dry season. Forest elephants spent 62% of their time in forests and 33% in grasslands (males: 78% forest, 20% grassland; females: 68% forest, 30% grassland.
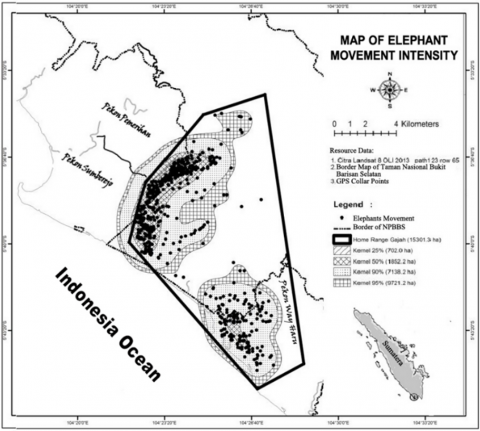
Then if it seems from the pattern of concentration on the elephant movement by using the Kernel method, it is known that the elephant group is centered near the village (Pemerihan, Sumberejo, and Way Haru) as shown in Figure 3. The convergence area consists of a combination of vegetation that are gardens, rice fields, rivers, bushes, and forests.
Figure 3. The map of elephant movement intensity based on kernel methods in the home range, BBSNP
The study that conducted by Sitompul et al. [19] also reported that elephants in Bengkulu make an average of 1.5km daily. The movement pattern of an elephant, when viewed from the slope condition, the elephant was more often in a lace slope. The area was rice fields, swamps, gardens, fields and bushes, and the coast. However, sometimes the elephants move to high-slope areas (24-45%). The movement was allegedly due to the presence of bamboo. Elephant feet are very adaptive to tread on high slopes because they are supported by nails that can press the ground to prop the body's weight properly and supported by ankle joints that can move to adjust the slope of the land.
Based on research results, vegetation characteristics in the elephant's home range analyzed are distinguished based on 4 vegetation types, namely primary forest, which is the dominant vegetation with a percentage of the area of about 43.21%, secondary forest (23.96%), gardens (19.67%), and shrubs (1.92%). Vegetation characteristics that will be described include species richness, species diversity index, and species evenness index.
The average daily mileage was about 3,251m or 3.2km. The observation that conducted by Sitompul et al. [19] also reported that elephants in Bengkulu make an average of 1.5km daily. The movement pattern of an elephant, when viewed from the slope condition, the elephant was more often in a lace slope. The area was rice fields, swamps, gardens, fields and bushes, and the coast. However, sometimes the elephants move to high-slope areas (24-45%). The movement was allegedly due to the presence of bamboo. Elephant feet are very adaptive to tread on high slopes because they are supported by nails that can press the ground to prop the body's weight properly and supported by ankle joints that can move to adjust the slope of the land.
3.3 Vegetation characteristics
Vegetation characteristics in the elephant's home range analyzed are distinguished based on 4 vegetation types, namely primary forest, which is the dominant vegetation with a percentage of the area of about 43.21%, secondary forest (23.96%), gardens (19.67%), and shrubs (1.92%). Vegetation characteristics that will be described include species richness, species diversity index, and species evenness index.
3.3.1 Tree species richness, diversity, and evenness
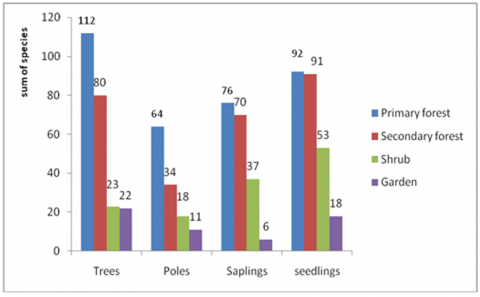
Species richness in the home range shows varying values, representing the changes in land cover due to human roles. Species richness in primary forests at the tree level shows the highest value for 112 species, whereas in secondary forests are 80 species, 23 species of shrubs, and 22 species of gardens. Data on the number of species at the growth rate, trees, saplings, and seedlings in 4 types of vegetation are presented in Figure 4.
Figure 4. Species richness at 4 vegetation of elephant home range in BBSNP
These conditions indicate the loss of tree species in secondary vegetation types, shrubs to gardens. On the other hand, suppose the regeneration process in the type of vegetation in primary, secondary, and bush forests naturally. In that case, the vegetation of the garden shows the lack of a regeneration process due to the role of humans in garden management. There is no difference between species in forests and gardens. It is not only because of tree-cutting activities but also the choice of tree species planted in gardens. This preference is related to economic value, which according to people's perceptions, is beneficial or valuable. This type of selection implies the inhibition of plant regeneration in the garden. In the National Way Kambas, Wardani et al. [20] found 31 species and covered 18 families. The number of species in the tropical forests of Nigeria is 50 species; in Ghana, 120 species; in India, 68 species [21]. The decline in this species is caused by human activities such as cutting trees for farming and gardening and illegal logging for timber.
Seedling regeneration and sapling growth are a big guarantee of sustainability in primary forests. At the pole level, the tree will provide up to two times, while at the sapling level, 10 times that of the pole, and at the seedling level also be 10 times the number of saplings Table 1. This regeneration trend also occurs in secondary forests and shrubs. In the garden, the number of individual saplings is only provided two times. This is because of the selection of seedlings and saplings by humans. Only tree species that are considered economical are allowed to grow large. According to DeWalt et al. [22], the vegetation structure in 70 years old secondary forests is very close to 100-year-old forests and old-growth forests or primary forests. This information shows that it takes at least 70 years to restore the damaged forest structure to approach the primary forest structure.
Table 1. Number of individuals/ha in 4 vegetation
|
Vegetation Type |
Tree |
Pole |
Sapling |
Seedling |
|
Primary Forest |
288 |
453 |
4107 |
39333 |
|
Secondary Forest |
218 |
240 |
2947 |
42083 |
|
Shrub |
61 |
210 |
1820 |
21000 |
|
Garden |
156 |
230 |
480 |
15875 |
The highest diversity value in the primary forest at the tree level is H’=4.3 and pole H’=3.7. Diversity in secondary forests is highest at sapling level H’=3.7 and seedlings H’=3.9. The value of species diversity in gardens is generally low compared to other vegetation types at various growth rates. At the pole and sapling level in the garden, the value of H’=1.5 (low). Only at the tree level the H’ value in the garden is still higher than in the bush. The species in the garden are controlled by humans. The selection of species and cleansing of plants that are considered weeds by humans is the key to the low value of species diversity in the garden.
Furthermore, the evenness value in the primary forest shows the highest value at the tree level (E’=0.92) compared to the secondary forest (E’=0.80), bush (E’=0.89), and garden (E’=0.64). This condition illustrates the distribution of each species number in the forest. Conversely, in the garden, the species' evenness value is smaller at all levels of growth compared to primary, secondary, and shrub forest types. This data shows that there is a predominance of numbers in certain species, and this is due to the preference for trees among local people.
The high number of feed species in primary forests compared to other vegetation types at various growth rates indicates the importance of forests as a source of elephant feed. According to DeWalt et al. [22], changes in the structure and composition of species in tropical forests during regeneration on different vegetation covers have an important influence on wildlife. The influence is mainly on the availability of animal feed.
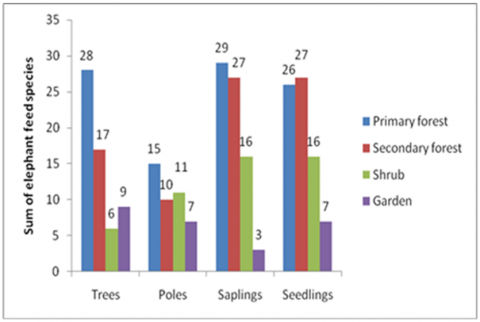
3.3.2 Species richness of elephants’ feed
Based on 100 observation plots, the number of elephant food species in the elephant's home range is 75 species. At the tree level in the primary forest, there are 28 species, then 17 species in the secondary forest, 6 species in the bush, and 9 species in the garden (Figure 5). According to Santosa and Thohari [23], explained the number of feed species in the North Bengkulu Production. Forest at tree level was 29 species, then 24 species at pole level, 26 species at the sapling level, and 29 species at seed level. The study that conducted by Tohir [24], the diversity of types of feed in Teso Nilo National Park and found as many as 110 species of elephant food belonging to 47 families. The Poaceae family has the highest number of feed species, namely 21 species, followed by the Leguminosae (Fabaceae) family, with 9 species. According to Sitompul et al. [19] stated that Sumatran elephants in Lampung eat five types of dominant families, namely Moraceae, Arecaceae, Leguminosae, Poaceae, and Euphorbiaceae.
Figure 5. The richness of elephant feed species in 4 vegetations
The number of elephant feed species at the growth rate shows a clear difference. At the sapling level in the primary forest, the highest number of feed species is found (29 species), and the lowest in the garden is 3 species. According to Mohapatra et al. [25], stated that the expending of tree species (56%) was the highest compared to shrubs (20%), herbs (14%), and climbers (10%). A high degree of variation in the dicot-monocot ratio (61:10) was described during the identification of elephant forage plants.
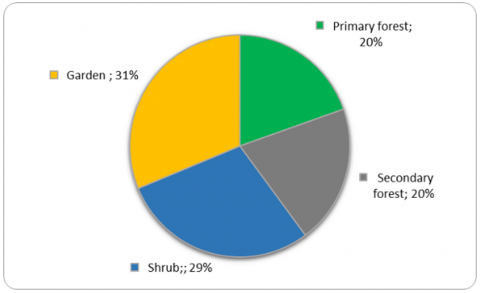
Figure 6. The proportion average of elephant feed species in 4 vegetations
This data shows that the higher utilization of elephant habitat by humans, the lower the number of species of elephant feed tends to be. Based on the comparison of the number of species of elephant feed with the total number of species, it turns out that in primary forests is less than in other vegetation types, so the average proportion of feed in the forest is lower than in shrubs and gardens (Figure 6). The small proportion of feed species in the forest, which is related to elephant feeding behavior, will impact the selection of feed to be carried out by elephants, which certainly requires special skills, knowledge, and experience.
The density of elephant feed species varies according to the type of vegetation. The average density of feed species in primary forests is smaller than the secondary forests, shrubs, and gardens. The proportion of feed species density in the garden at the tree level is highest compared to shrubs, secondary forests, and primary forests, either the proportion of the highest density of poles in the garden. However, the density of saplings and seedlings in secondary forests is highest compared to other vegetation types. Based on this data, it can be seen that the availability of feed at the tree and pole level is abundant in the garden and the level of saplings and seedlings are abundant in secondary forests compared to other vegetation types. According to Campos-Arceiz and Blake [26], it is reported that in African forests that 335 species out of 451 species are elephant feed or 74%.
If the proportion of types of feed and the proportion of elephant feed density in each type of vegetation is related to the eating behavior of elephants, then it is easier for elephants to get food in the garden type than in the forest. So that the plant species in the garden will have a greater and more intensive opportunity to be visited by elephants, especially at night. The study that conducted by Qomariah et al. [27] stated that monoculture plantations are preferable to elephants as the food source because monoculture plantation encompasses the huge area as food source hotspot which can suffice their feeding needs without having to go far.
3.4 Structure, composition, and Importance Value Index (IVI) species of vegetation types in home range
3.4.1 Primary forest
The composition of the primary forest at the tree level is dominated by Strombosia javanica or ‘terongan’, followed by Dillenia excelsa or ‘simpur’ and Dipterocarpus humeratus or ‘leeway’. The top 10 elephant feed species at the tree level are Dillenia excelsa, Saccopetalum horsfieldii or shoots, Dipterocarpus kunstleri, and Eugenia sp or guava. According to Susilowati et al. [28], it is reported that in Gunung Leuser National Park, at tree level, Koompassia malaccensis had the highest IVI. Scaphium macropodum ranked second in IVI value while in the dominance it ranked third of 57 species. The complete regeneration of the dominant species level of the tree is Eugenia sp, with IVI 24.91%, the level of the sapling is Dipterocarpus gracilis (IVI 35.95%), seedling (Dipterocarpus gracilis 15.65%) [20].
Furthermore, the result of research at the pole level, species composition with the highest IVI is Rhinorea lanceolata. Then the next two species, Strombosia javanica and Dillenia excelsa, which at the tree level also rank in the top 3. Regeneration of the 10 largest IVIs recorded, there were 5 species same as the tree level; Strombosia javanica, Dillenia excelsa, Ixonanthes icosandra, Aglaia sp, and Dipterocarpus humeratus. There are 5 species of elephant feed at the pole level, Dillenia excelsa, Polyalthia grandiflora (large leaf bandotan), Croton argyratus (thyma), Dipterocarpus humeratus, and Archidendron bubalinum (kuau). In Gunung Leuser National Park, Scaphium macropodum ranked 3nd in terms of IVI among 56 species at pole level. Species with the highest IVI was Gonystylus macrophyllus [28].
Although these feed species are not dominant at the pole level, they are still available and spread among other species in the primary forest. Environmental conditions and abiotic factors such as air, soil temperature and humidity, soil pH, altitude, and others play an important role in tree dynamics in primary or secondary forests [29].
If related to the movement of elephants, to get this type of feed, they must actively travel and recognize the distribution position of the feed in the forest. The introduction of species and their position in the elephant's home range will certainly be passed down from generation to generation as a way to be able to survive in the home range. Failure to recognize the type and position will impact the elephant group extinction.
Plant species at the sapling level are dominated by Popowia bancana or ‘bei wood’, Mallotus miquelianus, Popowia psocarpa or ‘geok’. Popowia bancana has a higher IVI compared to the others. It shows that the population is dominant at the sapling level in primary forests. The species at the pole level at the highest 10 IVI are Dillenia excelsa, Strombosia javanica, and Ixonanthes icosandra. There are 3 feed species of the sapling level at the 10 highest IVI; Popowia bancana, Pseuduvaria reticulate (long-leaf bandotan), and Saccopetalum horsfieldii. Popowia bancana species become abundant elephant feed in primary forests. The complete regeneration of the dominant species level of the tree is Eugenia sp, with IVI 24.91%, the level of the sapling is Dipterocarpus gracilis (IVI 35.95%), seedling (Dipterocarpus gracilis 15.65%) [20].
Plant species at the seedling level are dominated by Mallotus floribundus or ‘mara’, Strombosia javanica, Cleistanthus myrianthus or ‘punching Crushes’. IVI values at the seedling level do not differ greatly in the 10 largest species. At this seedling level, there are 5 species which is the same as the sapling level. This condition shows good regeneration at the seedling level. Strombosia javanica species are always present at the level of saplings, poles, and trees. The types of elephant feed at the seedling level recorded 3 species. Popowia bancana (bei wood), Saccopetalum horsfieldii, and Leea indica (old tree). Although Popowia bancana did not become dominant, IVI value is not greatly different from Mallotus floribundus, Strombosia javanica, and Cleistanthus myrianthus. At the seedling level there was ten highest IVI value trees were Gonystylus macrophyllus, Schapium macropodum, Dipterocarpus grandiflorus, Koompassia malaccensis, Cinnamomum cuspidatum, Nephelium cuspidatum, Hopea beccariana, Aromadendron sp., Ficus sp., and Myristica speciosa [28].
3.4.2 Secondary forest
Tetrameles nudiflora, Glochidion arborescens, and Cananga odorata dominate plant species at the tree level in secondary forests. If related to the primary forest at the tree level, the 3 species replace the positions of Strombosia javanica, Dillenia excelsa, and Dipterocarpus humeratus. The same number of species as primary forests in 10 species with high IVI are only two, namely Dillenia excelsa and Ixonanthes icosandra or ‘cloves medang’. Feed plants at the tree level recorded 4 species at the 10 highest IVI values. Glochidion arborescens and Cananga odorata are the dominant species of elephant feed. The availability of elephant feed in secondary forests is relatively high when viewed from its IVI value.
Species at the pole level are dominated by Bridelia monoica or ‘kelandri’, Calicarpa tomentosa, and Croton argyratus. Only Bridelia monoica rose to become the dominant species at the pole level. The other two species are not in the top 10 highest IVIs. Kelandri and mallotus are fast-growing plants pioneers in forests with human disturbance. The regeneration at the pole level shows 6 out of 10 species; it is the same as the tree level. Regeneration at the mast level takes place naturally. The composition of its species is naturally arranged closer to the primary forest. When humans open space, the ability of the sea to develop rapidly exceeds the other types.
Plant species at the sapling level are dominated by Leea indica, Croton argyratus, Dillenia excelsa, and Glochidion arborescens. The first four species are the dominant elephant-feed species. Other types of feed recorded 4 species, namely Pterospermum javanicum, Eugenis sp. Dillenia excels and Diospyros macrophylla. This condition shows that 6 of the 10 highest IVIs are elephant feed at the sapling level.
Stile level regeneration shows the same 3 types at the pole level. These species are Croton argyratus, Dillenia excels, and Glochidion arborescens. Croton argyratus species always occupy the top 3 positions from pole level to sapling. Dillenia excelsa and Glochidion arborescens species are always present from the tree, pole, and sapling level at the 10 highest IVIs.
The two species show the regeneration process at three growth levels in the secondary forest. Saplings in secondary forests are more numerous than in primary forests. This condition is affected by the role of higher sunlight in secondary forests compared to primary forests.
Seedling species in secondary forests are dominated by Leea indica, Croton argyratus, and Archidendron bubalinum. These types are species of feed. Croton argyratus is always present at the sapling and pole level. Leea indica always occupies the top position at the 10 highest IVIs. The same type with sapling levels recorded 3 types of Leea indica, Croton argyratus, and Pterospermum javanicum (bayur).
According to Sahoo and Lalfakawma [29], seedlings are more available in secondary forests than in primary ones. Environmental conditions and abiotic factors such as air, temperature and soil moisture, soil pH, and others have an important role in the dynamics of seedlings in both secondary and primary forests.
3.4.3 Shrub
In this type of shrub vegetation, Erythrina letosperm had emerged, which had never before existed in primary or secondary forests at 4 growth levels; tree level, pole, sapling, and seedling. This species is usually called ‘dadap’ by the local community. Dadap tree trunks are often used to propagate pepper and canopy as a shade coffee plant. Dadap is a sign of human activity managing the forest for farming, and then it is left so that the vegetation form shrubs. Anthropogenic stress and nutrient conditions caused changes in regeneration status and composition in forests [30]. According to Koirala et al. [9], it is stated that shrubs that had relatively high Preference Index (PI) scores been Hypericum uralum (1.18) and the palm Phoenix humilis (2.91).
Plants at the tree level in the bush are dominated by Cananga odorata, Erythrina letosperma, and Macaranga sp. Macaranga odorata appears in shrubs and became the top 3 highest IVI at the tree level. Macaranga is a pioneer plant that often grows in the open. Also, it was a species for elephant food and was dominant in the bush. Forage plants at the tree level were recorded for 4 species at the 10 highest IVI values. These species appear and spread naturally, usually through wildlife activities. There are 4 species of the same species at the tree level. These species are Cananga odorata, Macaranga sp., Pterospermum javanicum, and Croton argyratus. The process of natural plant regeneration occurs at this level. There will be a succession from the pole level to the tree if there is no human disturbance. In the dry season, fires sometimes occur in the bush. Fires are caused by human activities.
Plant species at the sapling level in shrubs were dominated by Piper anduncum, Leea indica, and Bridelia monoica. Leea indica was noted to dominate in secondary forests and shrubland at the sapling level. This condition is presumed to have occurred in the spread of seeds by wildlife, including elephants, in bush vegetation. Elephants come to the bush for food and simultaneously spread the seeds from the forest through their feces. So that the types that grow as elephant food also become abundant in the bush.
According to Campos-Arceiz and Blake [26], forest elephants in Africa maintain the diversity of several tree species within a wide area by spreading their feces along their journey. African elephants propagate the seeds of 355 species from 213 genera in 65 families. Meanwhile, Asian elephants spread the seeds of 122 species from 92 genera in 39 families. If the elephant goes extinct, it will have a very important negative impact on many species, as well as an impact on the whole ecological community.
The same species as the pole level are Bridelia monoica, Glochidion arborescens, Croton argyratus, and Pterospermum javanicum. This type will be the next generation to become pole-level. Type of feed at sapling level is recorded for 5 species at the 10 highest INO values (>50%). These 5 species are dominant at the sapling level.
Plant species at the seedling level in the bush vegetation type were dominated by Bridelia monoica, followed by Actinodaphne borneensis, Aglaia sp, and Cleistanthus myrianthus. The same type with sapling level, there are 2 species, namely Bridelia monoica and Actinodaphne borneensis. The first type includes elephant feed and dominates the seedlings in the bush. Three species were recorded at the 10 highest IVI values for age plants at the seedling level.
3.4.4 Garden
The number of species in the garden at the tree level is 23 species. Plant species at the tree level in the garden were dominated by Erythrina letosperm, Michelia champaca, and Ceiba pentrandra, or ‘randu’. Species at the tree level in the garden are generally considered of economic value by local communities. The wood from Michelia champaca, Swietenia mahagoni (mahoni), and Pterospermum javanicum are perfect for carpentry. Some of the species in the garden include alien species or foreign species planted by the community. Mahoni and randu are foreign plants. These plants will be ecologically detrimental to the garden vegetation if they enter the national park. The national park must intensively control these plants so they do not spread into the national park.
Compared with the tree level in the primary forest, not one species in the garden was the same as in the primary forest in the 10 highest IVI species. Meanwhile, in the secondary forest, 1 species were recorded, namely Cananga odorata, and 3 species in shrubs, namely Erythrina letosperma, Cananga odorata, and Anthocephalus chinensis. This condition showed that the species composition in primary forest, secondary forest, shrubs, and gardens was increasingly different due to human influence in forest management. Type of elephant feed at the tree level recorded 4 species at the 10 highest IVI values. Erythrina letosperm and Michelia champaca dominate at the tree level in the garden. This condition illustrates that elephant food is very dominant in the garden.
The plant species at the pole level are dominated by Erythrina letosperma, Theobroma cacao or cacao plant, and Michelia champaca. These three types are elephant food spread out over the pole level in the garden. The cacao plants are often destroyed and eaten by elephants, causing conflict with the community. Forage plants at the pole level were recorded for 6 species at the 10 highest IVI values.
The same species at the tree level as regeneration are Erythrina letosperm (dadap), Michelia champaca (cempaka), and Durio zibethinus (durian). These species are intentionally planted to be maintained as a tree because it is considered beneficial for their timber (cempaka), fruit (durian), and pepper vine (dadap). Meanwhile, the other types that grow naturally are Calicarpa tomentosa, Alstonia scholaris, and Morinda cotrifolia. The first two types are retained for wood use, and the last can be used as medicine.
There are 6 plant species recorded at the sapling level, and it is dominated by Coffea arabica, Theobroma cacao, and Havea braziliensis or rubber. Forage plants at sapling level 3 species of the 6 highest IVI values are recorded, including; chocolate, rubber, and Durio zibetinus or durian. The 6 plant species, namely; coffee, chocolate, rubber, durian, cinnamon (Cinnamomum burmanii), and mango (Mangifera odurata), have been planted by the community, and they are very helpful in fulfilling their daily needs. The same plants at the pole level are cacao, rubber, durian, and mango. Therefore, the plant is maintained to be at the sapling level.
Plant species at the seedling level are dominated by Coffea arbica or coffee, Ceiba pentandra, and Strombosia javanica. The variety of species at the seedling level comes not only from human plants but also strongly due to animal activities. Strombosia javanica species are the dominant species recorded at the tree level in primary forests and found in gardens. This species does not exist at the level of trees, poles, and saplings in the garden. This condition is due to the specific preference of the local community so that in the process of managing these types of gardens, they are cleared.
Meanwhile, elephant food plants at the seedling level were recorded as 3 species at the 10 highest IVI values. Based on the IVI value, the potential feed at the seedling level is much lower than the potential feed at the sapling, sapling, and tree levels. The same kind of brew level is only coffee. Many coffee plants are grown as seedlings from old parent plants. The spread of coffee seeds can occur through wildlife activities such as civets.
3.5 Movement patterns and their relationship to vegetation types
Suppose the intensity of elephant visits is related to vegetation types in primary and secondary forests. In that case, the number of visits by elephants is higher in secondary forests than in primary forests. This condition is presumed to be due to the availability of more types of food in secondary forests than in primary forests. As a result, the proportion of elephant forage species density in the secondary forest was higher than in the primary forest at all growth phases. Secondary forests that may contribute to high elephant visits, such as the type of food available or the density of these resources. According to Fisher et al. [31], the consequences of elephant behavior on vegetation structure in a short period have a significant effect on tree diversity (Table 2). During the day, elephants are always in secondary forests and close to rivers as a source of drinking water and close to corn plantations or rice fields which are also a source of food.
Table 2. Elephant movement relations with various vegetation in the home range of elephants, resort Pemerihan-Way Haru, BBSNP
|
Variable |
Primary Forest |
Secondary Forest |
Shrub |
Garden |
|
Movement distance at day (m) |
542.8 |
828.1 |
75.4 |
281.5 |
|
Movement distance at night (m) |
76.2 |
182.0 |
371.0 |
491.0 |
|
Visit frequency at day (%) |
27.9 |
46.2 |
8.7 |
17.3 |
|
Visit frequency at day (%) |
8.6 |
16.5 |
24.4 |
50.5 |
|
Tree diversity H’ |
4.3 |
3.5 |
2.8 |
2 |
|
Tree density (tree/ha) |
288 |
218 |
61 |
156 |
|
Free tree density (tree/ha) |
67 |
85 |
14 |
85 |
Furthermore, elephant visits the farm more intensively than in bushes. In this condition, the high tree density in the farm does not prevent elephants from traveling because the proportion of forage density in the farm at the tree and pole phases is higher than in the bush. Elephants like cacao, dadap, randu, durian and rubber, coconut, banana, and oil palm. According to Rohman et al. [32] stated that, the highest preference for land cover was in the form of shrubs and forest vegetation.
If the distance traveled by elephants was connected to the vegetation type, there would be differences in the distance traveled during the day and at night. The daytime distance of elephants in the secondary forest was higher than other vegetation types. Meanwhile, the distance traveled by elephants at night in the garden is higher than other vegetation types. The chi-square test showed a significant difference between the night and day distance traveled in the 4 vegetation types; (χ2 count=54, 3>χ2 tableα=0.05, df=3=9.5).
Furthermore, if the frequency of visits is connected to the vegetation type, it can be seen that primary and secondary forests are used more frequently during the day, while shrubs and gardens are used more often at night. Chi-square test results showed a significant difference in the frequency of visits to various types of vegetation (χ2 count=46, 9>χ2 tableα=0.05, df=3=9.5).
This difference was presumed because, during the day, elephants tend to avoid humans and sunburn. According to Stevenson and Walter [33] stated that elephants have physiological problems if they are too long in direct contact with sunlight. Natural forests and swamps were more likely to be used by an elephant during the day for shade from the sun and to get down body temperature or take water for elephant needs [18]. This condition can be used as an explanation for why conflicts between elephants and humans generally occur at night.
The ecological roles of Sumatran elephants and Arfika elephants are similar, namely as dispersers of plant seeds through their feces. Apart from that, elephants often tear down plants so that other herbivores can eat the leaves. The difference in movement patterns of Sumatran elephants is that their home range is smaller than that of African elephants. This condition is related to their habitat preferences which are influenced by different vegetation dynamics, climate and natural conditions.
For the optimization strategy, elephants and humans do not fight over resources (interspecific competition) [34], so elephant habitat selection is carried out selectively by reducing infrastructure and residential areas as locations visited. However, utilization of the location of human activity gave rise to human-elephant conflict. Therefore, the location of elephant habitat needs to be intensified in the habitat development program by increasing the carrying capacity of habitat for elephants and intensifying habitat development also in potential locations that are not chosen by elephants, such as water bodies, mixed gardens, open land and shrubs [18]. The habitat development program aims to increase the carrying capacity of elephants, such as restoration with types of elephant food. Specific actions taken to intensify habitat development in locations that elephants do not like, are carried out by planting pioneer plant species.
Von Gerhardt et al. [35] explained that elephants take place close to villages more frequently in the dry season than in the wet season, with bulls occurring more often around villages than cows. Furthermore, the bulls and the cows preferred to spend areas close to villages from early evening to midnight, moving closer to villages than the cows. These results recommend that elephants, especially the bulls, move through the studied villages in Mozambique and Zimbabwe at night and that these movements are most habitual during the drier months when resources are rare. Based on field observations, people are always on guard (patrolling) at the lookout tower at night, from sunset to sunrise. The study that conducted by Cook et al. [36] reported that 100% of the community has a positive perception by considering elephants as an endangered species and has the potential to become tourist attractions.
The results showed that high elephant visits did not follow high plant diversity in the primary forest. The primary forest has a high diversity value compared to the secondary forest, but elephant visits during the day in the secondary forest are higher than in the primary forest. Furthermore, diversity in shrubs was higher than in gardens, but elephant visits were more frequent in gardens. This phenomenon can explain the role of elephants in restoring forests after disturbance by human activities. During the trip, elephants spread the seed that was eaten from the forest, and then it spread through their feces in open areas.
Elephant releases 100kg of wet feces (dung) containing plant seeds daily. The distance between feces is estimated to be 118 meters at night and 153 meters during the day. The forest elephants in Africa also play a role in maintaining the diversity of several tree species over a wide area; through the spread of feces along their journey Wijeyamohan [37].
The movement patterns of groups of elephants show differences in concentration due to vegetation dynamics and changes in time. During the day, elephant movements tend to occur in secondary forest and primary forest vegetation. Meanwhile, at night groups of elephants are active in gardens and bushes. This condition can be used as a guide in managing elephant habitat, both for tourism, patrolling and conflict management.
The high number of elephant visits is not in line with the high diversity of plants. The Importance Value Index in gardens shows high values dominated by one or two species, for example Erythrina letosperma and Theobroma cacao which are food for elephants. There needs to be a change in planting patterns so that the species in gardens are not species that elephants like.
At night groups of elephants are more likely to be in the gardens because of the abundance of food. At that time there was interaction between people and elephants. They drove the group of elephants out of the garden. As long as there is plenty of elephant food in the garden, the elephants will always visit it, so conflict will always exist.
The limitation of this research is that it only lasted 2 years so there are weaknesses in the interpretation of movement patterns when compared to a 10 years period where movement patterns were more stable. Potential bias could occur due to the time lag caused by the removal of the GPS collar from the elephant's neck. However, this can be minimized by the visible difference in elephant intensity during the day and night.
[1] Duffy, K.J., Dai, X.H., Shannon, G., Slotow, R., Page, B. (2011). Movement patterns of African elephants (loxodonta africana) in different habitat types. South African Journal of Wildlife Research, 41(1): 21-28.
[2] Chan, A.N., Wittemyer, G., McEvoy, J., Williams, A.C., Cox, N., Soe, P., Grindley, M., Shwe, N.M., Chit, A.M., Oo, Z.M., Leimgruber, P. (2022). Landscape characteristics influence ranging behavior of Asian elephants at the human-wildlands interface in Myanmar. Movement Ecology, 10(1): 6. https://doi.org/10.1186/s40462-022-00304-x
[3] Paudel, S., Yuan, F. (2012). Assessing landscape changes and dynamics using patch analysis and GIS modeling. International Journal of Applied Earth Observation and Geoinformation, 16: 66-76. https://doi.org/10.1016/j.jag.2011.12.003
[4] Prasetyo, L.B. (2017). Landscape ecology approach for biodiversity conservation. Faculty of Forestry, IPB University, Bogor.
[5] Moolman, L., Ferreira, S.M., Gaylard, A., Zimmerman, D., Kerley, G.I.H. (2019). The decline of the Knysna elephants: Pattern and hypotheses. South African Journal of Science, 115(3-4): 1-7. https://doi.org/10.17159/sajs.2019/4805
[6] Kerley, G.I., Monsarrat, S. (2022). Shifted models cannot be used for predicting responses of biodiversity to global change: The African elephant as an example. African Zoology, 57(1): 70-73.
[7] Tucker, M.A., Böhning-Gaese, K., Fagan, W.F., et al. (2018). Moving in the anthropocene: Global reductions in terrestrial mammalian movements. Science, 359(6374): 466-469. https://doi.org/10.1126/science.aam9712
[8] Sitompul, A.F. (2011). Ecology and conservation of Sumatran elephants (elephas maximus sumatranus) in Sumatra, Indonesia. University of Massachusetts Amherst.
[9] Koirala, R.K., Raubenheimer, D., Aryal, A., Pathak, M.L., Ji, W.H. (2016). Feeding preferences of the Asian elephant (Elephas maximus) in Nepal. BMC Ecology, 16: 1-9. https://doi.org/10.1186/s12898-016-0105-9
[10] Balai Besar Taman Nasional Bukit Barisan Selatan. (2011). Zonasi taman nasional bukit barisan selatan. Kota Agung, Lampung (ID): TNBBS. https://programs.wcs.org/btnbbs/Profile/Zonasi-Kawasan.aspx, accessed on Feb. 23, 2024.
[11] Shawe-Taylor, J., Cristianini, N. (2004). Kernel Methods for Pattern Analysis. Cambridge University Press.
[12] Curtis, J.T., Mcintosh, R.P. (1950). The interrelations of certain analytic and synthetic phytosociological characters. Ecology, 31(3): 434-455. https://doi.org/10.2307/1931497
[13] Shannon, C.E., Weaver, W. (1949). The mathematical theory of communication, by CE Shannon (And recent contributions to the mathematical theory of communication). University of Illinois Press.
[14] Odum, E.P., Barrett, G.W. (1971). Fundamentals of Ecology, Third Edition. Philadelphia: Saunders.
[15] Soerianegara, I., dan Indrawan, A. (2008). Ekologi Hutan Indonesia. Institut Pertanian Bogor.
[16] Krebs, C.J. (1989). Ecological Methodology Harper-Collins Publishers. New York, 654.
[17] Mills, E.C., Poulsen, J.R., Fay, J.M., Morkel, P., Clark, C.J., Meier, A., Beirne, C., White, L.J. (2018). Forest elephant movement and habitat use in a tropical forest-grassland mosaic in Gabon. PloS One, 13(7): e0199387. https://doi.org/10.1371/journal.pone.0199387
[18] Sukmantoro, Y.W., Alikodra, H.S., Kartono, A.P., Efransjah, E. (2019). Distribution and habitat preferences of Sumatran elephant (Elephas maximus sumatranus) in Riau, Indonesia. Biodiversitas Journal of Biological Diversity, 20(1): 226-235. https://doi.org/10.13057/biodiv/d200126
[19] Sitompul, A.F., Griffin, C.R., Fuller, T.K. (2013). Sumatran elephant ranging behavior in a fragmented rainforest landscape. International Journal of Biodiversity and Conservation, 5(2): 66-72. https://doi.org/10.5897/IJBC12.040
[20] Wardani, M., Astuti, I.P., Heriyanto, N.M. (2017). Analisis vegetasi jenis-jenis Dipterocarpaceae di Kawasan Hutan Seksi 1 Way Kanan, Taman Nasional Way Kambas, Lampus. Buletin Kebun Raya, 20(1): 51-64.
[21] Giriraj, A., Murthy, M.S.R., Ramesh, B.R. (2008). Vegetation composition, structure and patterns of diversity: A case study from the tropical wet evergreen forests of the Western Ghats, India. Edinburgh Journal of Botany, 65(3): 447-468. https://doi.org/10.1017/S0960428608004952
[22] DeWalt, S.J., Maliakal, S.K., Denslow, J.S. (2003). Changes in vegetation structure and composition along a tropical forest chronosequence: Implications for wildlife. Forest Ecology and Management, 182(1-3): 139-151. https://doi.org/10.1016/S0378-1127(03)00029-X
[23] Santosa, Y., Thohari, M. (2011). Preferensi dan pendugaan produktivitas pakan alami populasi gajah sumatera (elephas maximus sumatranus temmick, 1847) di hutan produksi khusus (hpkh) pusat latihan gajah (plg) sebelat, bengkulu utara. Media Konservasi, 16(3).
[24] Tohir, R.K. (2018). Feed diversity, palatabiliti and carrying capacity of sumatran elephant (elephas maximus sumatranus) flying squad in Tesso Nilo National Park. Jurnal Pengelolaan Sumberdaya Alam dan Lingkungan (Journal of Natural Resources and Environmental Management), 8(3): 339-346. https://doi.org/10.29244/jpsl.8.3.339-346
[25] Mohapatra, K.K., Patra, A.K., Paramanik, D.S. (2013). Food and feeding behaviour of Asiatic Elephant (Elephas maximus linn.) in Kuldiha wild life sanctuary, Odisha, India. Journal of Environmental Biology, 34(1): 87-92.
[26] Campos-Arceiz, A., Blake, S. (2011). Megagardeners of the forest-the role of elephants in seed dispersal. Acta Oecologica, 37(6): 542-553. https://doi.org/10.1016/j.actao.2011.01.014
[27] Qomariah, I.N., Rahmi, T., Said, Z., Wijaya, A. (2019). Conflict between human and wild Sumatran elephant (Elephas maximus sumatranus Temminck, 1847) in Aceh Province, Indonesia. Biodiversitas Journal of Biological Diversity, 20(1): 77-84. https://doi.org/10.13057/biodiv/d200110
[28] Susilowati, A., Elfiati, D., Rachmat, H.H., Yulita, K.S., Hadi, A.N., Kusuma, Y.S., Batu, S.A.L. (2020). Vegetation structure and floristic composition of tree species in the habitat of scaphium macropodum in Gunung Leuser National Park, Sumatra, Indonesia. Biodiversitas Journal of Biological Diversity, 21(7): 3025-3033. https://doi.org/10.13057/biodiv/d210720
[29] Sahoo, U.K., Lalfakawma, L. (2013). Population dynamics of castanopsis tribuloides A.(DC) in an undisturbed and disturbed tropical forest stands of North-east India. Journal of Experimental Biology and Agricultural Sciences, 1(6): 455-463.
[30] Kumar, M., Joshi, M., Todaria, N.P. (2010). Regeneration status of a sub-tropical anogeissus latifolia forest in Garhwal Himalaya, India. Journal of Forestry Research, 21: 439-444. https://doi.org/10.1007/s11676-010-0094-z
[31] Fisher, J.T., Erasmus, B.F.N., Witkowski, E.T.F., Van Aardt, J., Asner, G.P., Wessels, K.J., Mathieu, R. (2014). Management approaches of conservation areas: Differences in woody vegetation structure in a private and a national reserve. South African Journal of Botany, 90: 146-152. https://doi.org/10.1016/j.sajb.2013.10.016
[32] Rohman, W.A., Wulandari, C., Darmawan, A., Sari Dewi, B. (2019). Preferensi jelajah harian gajah sumatera (elephas maximus sumatranus) di Taman Nasional Bukit Barisan Selatan Daily Range Preferences of Sumatran Elephant (elephas maximus sumatranus) in Bukit Barisan Selatan National Park. Jurnal Sylva Lestari, 7(3): 309-320. https://doi.org/10.23960/jsl37309-320
[33] Stevenson, M.F., Walter, O. (2006). Management guidelines for the welfare of zoo animals: Elephants: Loxodonta Africana and Elephas maximus. British & Irish Association of Zoos & Aquariums.
[34] Maple, T.L., Perdua, B.M. (2013). Zoo Animal Welfare. Springer, Berlin, Heidelberg. https://doi.org/10.1007/978-3-642-35955-2
[35] Von Gerhardt, K., Van Niekerk, A., Kidd, M., Samways, M., Hanks, J. (2014). The role of elephant Loxodonta africana pathways as a spatial variable in crop-raiding location. Oryx, 48(3): 436-444. https://doi.org/10.1017/S003060531200138X
[36] Cook, R.M., Parrini, F., Henley, M.D. (2015). Elephant movement patterns in relation to human inhabitants in and around the Great Limpopo Transfrontier Park. Koedoe: African Protected Area Conservation and Science, 57(1): 1-7. https://doi.org/10.4102/koedoe.v57i1.1298
[37] Wijeyamohan, S. (2003). Biogas from elephant dung: A means of mitigating human-elephant conflict. Gajah, 22: 62-64.