Evaluating torenia fournieri Flower Extract as a Natural Acid-Base Titration Indicator

Sitti Rahmawati*![]() | Nur Hikma
| Nur Hikma![]() | Sitti Aminah
| Sitti Aminah![]() | Anang Wahid Muhammad Diah
| Anang Wahid Muhammad Diah![]() | Magfirah
| Magfirah![]()
© 2024 The authors. This article is published by IIETA and is licensed under the CC BY 4.0 license (http://creativecommons.org/licenses/by/4.0/).
OPEN ACCESS
This research aims to evaluate the potential of torenia fournieri flower extract as an alternative acid-base indicator that is safe, cheap and environmentally friendly compared to synthetic indicators. Synthetic indicators commonly used today have several disadvantages, such as being dangerous for the environment and health, expensive, and not easily decomposed. torenia fournieri flower extract was obtained through a maceration process and tested in various solutions, including HCl, NaOH, CH3COOH, NH4OH, as well as in phosphate buffer with a pH range of 1-12. The results showed that torenia fournieri flower (TFF) extract was red in a strong acid solution, pink in a weak acid solution, green in a strong base solution, and yellow in a weak base solution. In tests with buffer solutions, there are four different color ranges: red at pH 1-6, colorless at pH 7, yellow at pH 8, and dark green at pH 9-12. In addition, in the titration of strong acids and strong bases, the color changes from pink to colorless in the pH range 5.41-7.03, while the reference indicator, phenolphthalein, changes from colorless to purple in the pH range 5.87-7.07. In the titration of a weak base and a strong acid, the color change occurs in the pH range 5.4-6.2, from pink-greenish yellow, while in the comparison indicator, methyl orange, the color change occurs in the pH range 3.2-4.3, from red-orange. In titrations of weak acids and strong bases, color changes occur in the pH range 5.41-8.22, from pink-yellow to greenish, while in the comparison indicator phenolphthalein, color changes occur in the pH range 5.39-8.20, from colorless to purple. It can be concluded that torenia fournieri flower (TFF) extract shows a color change ability similar to phenolphthalein (PP) and methyl orange indicators, but with a narrower color range. Therefore, torenia fournieri flower extract can be used as a safe, cheap and environmentally friendly alternative acid-base indicator, both for strong acid-strong base titrations and weak acid-strong base titrations. However, further research needs to be carried out to evaluate the reproducibility and stability of torenia fournieri flower extract as an indicator.
acid-base, torenia fournieri, extract, indicator
Acid-base indicators are needed for activities in chemical laboratories. Indicators are complex compounds that are able to react with acids or bases accompanied by a color change according to the concentration of hydrogen ions [1]. An acid-base indicator is a substance that is capable of giving a color change according to the pH of the identified solution. It can be also used to determine the acidity and basicity of a solution. A science experiment to test the properties of an acid-base solution is an important thing that is usually done in high schools and universities. Synthesis indicators that are often used in practical work usually use phenolphthalein, litmus paper, methyl red, and bromine thymol red. However, the use of synthetic indicators often becomes a problem in practice [2], this is because the price is relatively expensive and in some areas outside Java it is difficult to obtain them. To overcome this problem, an alternative replacement for the synthetic indicator is needed. Natural acid-base indicators can be a cheap and environmentally friendly alternative [3, 4].
Natural indicators are color pigments which comes from plant parts such as leaves, flowers, fruit, bark, and root bark which are striking in color [5]. Parts of plants that contain color pigments such as anthocyanins, flavonoids, tannins, saponins, and alkaloids. Anthocyanin is a type of polyphenol in the flavonoid group which is able to give color to plants such as red, purple and blue. These compounds are sensitive to both acidic and basic pH.
Anthocyanins are the basic building blocks of red pigments, purple and blue in plants [6]. Stable anthocyanin compounds will give a bright color at an acidic pH and will lose color as it increases [7]. The color stability of anthocyanin compounds is affected by pH or acidity and will be more stable in an acidic environment or at a low pH. Based on this, it can be assumed that plants containing anthocyanin compounds can be used as acid-base indicators. As for some plants that contain anthocyanins and are used as natural acid-base indicators, they include hibiscus flowers (hibiscus rosa_sinesi), purple cabbage (brassica oleracea), purple sweet potato (ipomea batatas), rosella flower (hibiscus subdariffa) [8, 9]. As with these colored plants, the torenia fournieri flower plant extract with a purplish tint on the petals, possibly contain anthocyanin pigments, which can be used as natural indicators. The torenia fournieri flower is a compound flower which so far has only been used as an ornamental plant and has not been used optimally.
Considering the existence of a raw material (torenia fournieri flower) that is easy to cultivate and contains anthocyanins, as well as the very interesting benefits and properties of anthocyanins, the isolation of anthocyanins and their application as acid-base indicators is very urgent to do. After knowing the type of anthocyanin from the flower and its color change in acid-base conditions, it is hoped that the anthocyanin from the torenia fournieri flower can be utilized into other products that can be commercialized, so that the economic value of the flower can be increased. Therefore, the selection of torenia fournieri as research raw material was based on several main reasons: high anthocyanin content, ease of cultivation, efficient extraction process, clear color changes under acid-base conditions, and great commercial potential.
The main aim of this research is to determine the potential of torenia fournieri flower extract as an alternative acid-base indicator. Apart from that, it aims to increase the economic value of the flowers. The success of this research can fundamentally help the chemistry learning process, especially acid-base material by utilizing surrounding natural materials as an alternative acid-base indicator in schools. The hypothesis of this research is that torenia fournieri flower extract can be used as a natural indicator because it contains antisionin compounds. The research questions to be answered include: Is torenia fournieri flower extract able to show clear color changes at various levels of acidity and alkalinity? How is the effectiveness of torenia fournieri flower extract as an acid-base indicator compared to commonly used synthetic acid-base indicators?
2.1 Chemical and materials
The tools used in this study were measuring cups, beakers, spatulas, pH meters, stirring rods, volumetric flasks, Erlenmeyer, burettes, dropping pipettes, shakers, drip plates, bucher funnels, digital balances, stopwatches, aluminum foil, spray bottles, test tubes, electric baths, mortar and pestle as well as statives and clamps.
The materials used in this study was torenia fournieri flower (torenia fournieri), distilled water, methanol, HCl 0.1 M, NaOH 0.1 M, NH4OH 0.1 M, CH3COOH 0.1 M, indicator methyl orange (MO), indicator phenolphthalein and filter paper.
2.2 Characterization methods
2.2.1 Torenia fournieri flower extract
As much as 3.87 grams of torenia fournieri flower, washed with distilled water until clean, cut into small pieces then put into Erlenmeyer plus 50 mL of methanol solvent then shaken (using shakers) and macerated for 2 hours at room temperature. The extract is then filtered. The filtering results are ready to be used as an acid-base indicator.
2.2.2 Color testing in acid and alkaline solutions
The torenia fournieri flower extract obtained was tested by dropping 3 drops into a 0.1 M CH3COOH acetic acid solution and a 0.1 M ammonium hydroxide (NH4OH) base solution. Then the color change was observed [10].
2.2.3 Testing color with a buffer solution
The buffer solution was put into the drip plate as much as 5 drops with different pH, namely pH 1 to pH 12. Then added 3 drops of torenia fournieri flower extract into each buffer solution. Next, record the color changes that occur [10].
2.2.4 Testing on acid-base titration
Strong acid-strong base titration. Measure 25 mL of standardized NaOH solution, then put it in an Erlenmeyer flask, then add 5 drops of torenia fournieri flower extract indicator. Before titrating the mixture, the pH value is first measured using a pH meter. Next, titrate with 0.1 M HCl solution until a color change occurs. During the titration process, for every 2 mL of titer, the pH value of the mixture is measured. Furthermore, this titration was replaced by replacing the torenia fournieri flower extract with a phenolphthalein indicator as a comparison.
Weak base titration with strong acid. Measure 25 mL of 0.1 M NH4OH solution, then put it in an Erlenmeyer flask, then add 5 drops of torenia fournieri flower extract indicator. Before titrating the mixture, the pH value is first measured using a pH meter. Next, titrate with 0.1 M HCl solution until a color change occurs. During the titration process, for every 2 mL of titer, the pH value of the mixture is measured. Furthermore, this titration was replaced by replacing the torenia fournieri flower extract with the indicator methyl orange as a comparison.
Titrate a weak acid with a strong base. Measure 25 mL of 0.1 M CH3COOH solution, then put it in an Erlenmeyer flask, then add 5 drops of torenia fournieri flower extract indicator. Before titrating the mixture, the pH value is first measured using a pH-meter. Next, titrate with 0.1 M NaOH solution until a color change occurs. During the titration process for every 2 mL of titer, the pH value of the mixture is measured. Furthermore, this titration was replaced by replacing the torenia fournieri flower extract with a phenolphthalein indicator as a comparison.
3.1 Extract of torenia fournieri flower
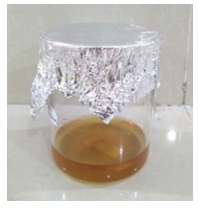
The maceration results obtained a brownish yellow extract, presented in Figure 1.
Figure 1. Maceration extract
Fresh and non-fresh TFF were washed and weighed as much as 3.87 grams and then macerated using 50 mL methanol solvent. Extraction using the maceration method is based on the solubility properties of the components in the solvent used [11]. The choice of methanol as a solvent is based on the polar nature of methanol which can dissolve flavonoid compounds which are also polar such as anthocyanins. That anthocyanin is a component that is polar so that the solvent used must also be polar [12]. Then the samples were macerated for 24 hours. Then the sample is filtered to separate the filtrate and residue.
3.2 Color testing in acid and alkaline solutions
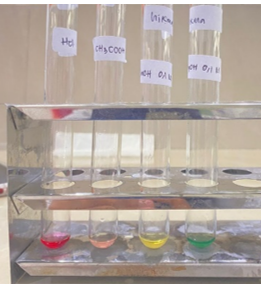
The results of the TFF extract indicator test presented in Figure 2, show that the color of the TFF extract tested in acid and alkaline solutions, namely in a strong acid (HCl 0.1 M) was red, in a weak acid (CH3COOH 0.1 M) it was pink, and in a strong base (NaOH 0.1 M) it was yellow, and in a weak base (NH4OH 0.1 M) it was dark green. The ability to change color of TFF extracts under acidic and basic conditions can be caused by changes in pH resulting in changes in the anthocyanin structure [13].
Figure 2. torenia fournieri flower indicator color in acid-base solution
1. HCl 0.1 M (Red); 2. CH3COOH 0.1 M (Pink); 3. NaOH 0.1 M (Yellow); 4. NH4OH 0.1 M (Green)
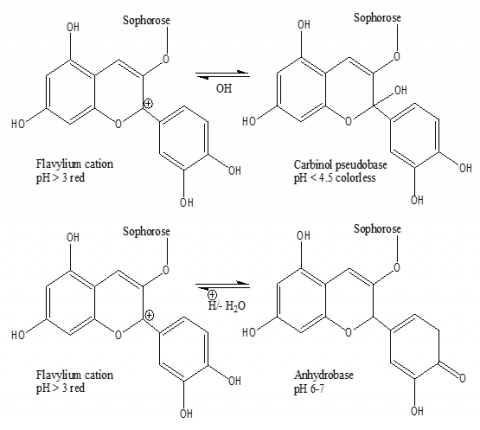
The ability to change color of TFF extracts under acidic and basic conditions can be caused by changes in pH resulting in changes in the anthocyanin structure [14]. The structure of anthocyanins in solution has four equilibrium forms, namely flavilium cations, quinoidal bases, carbinol (pseudobase) and chalcones [15]. Under low pH, anthocyanins are in the form of red flavilium cations [16]. When the pH is increased (> 5), it accelerates the loss of protons to form quinodal bases which tend to turn blue or purple, besides that the increase in pH causes the hydration of flavilium cations to form colorless carbinol or chalcone [17]. The shape of the equilibrium and changes in the structure of the anthocyanin compounds at various pH conditions can be seen in Figure 3.
Figure 3. Equilibrium of anthocyanins in solution [18]
3.3 Testing on phosphate buffers pH 1-12
The results showed that from a buffer solution of pH 1-12 presented in Table 1, the TFF extract showed various colors including a red solution of pH 1-2, indicating that the TFF extract turned red in a strong acid solution with a low pH, buffer solution pH 3-6 is pink, indicating that the TFF extract turns pink at a more neutral or slightly acidic pH. At a neutral pH of around 7, the TFF extract did not show any discoloration, so it remained colorless. At times the solution has a slightly alkaline pH (about 8). And at a higher pH (9-12), TFF extract turns dark green.
Table 1. Test results for TFF extract indicators in a buffer solution of pH 1-12
|
Solution Buffers |
Color Extract Solution TFF |
|
pH 1 |
Red |
|
pH 2 |
Red |
|
pH 3 |
Red Young |
|
pH 4 |
Red Young |
|
pH 5 |
Pink |
|
pH 6 |
Pink |
|
pH 7 |
No colored |
|
pH 8 |
Greenish Yellow |
|
pH 9 |
Green |
|
pH 10 |
Green Old |
|
pH 11 |
Green Old |
|
pH 12 |
Green Old |
This color change occurs due to the interaction between the anthocyanin molecules in the TFF extract and hydrogen ions (H+) or hydroxide ions (OH-) in solution, which changes the chemical structure of the anthocyanin molecules and causes observable color changes. The occurrence of color changes in various pH ranges is due to the main content of dyes in torenia fournieri flowers in the form of anthocyanin compounds. Anthocyanins are more stable in acidic media at low pH than in solutions with high pH [19]. The results obtained can be an indication that the TFF extract can be used to determine the pH value.
3.4 Tests on acid and base titrations
3.4.1 Tests on acid and base titrations
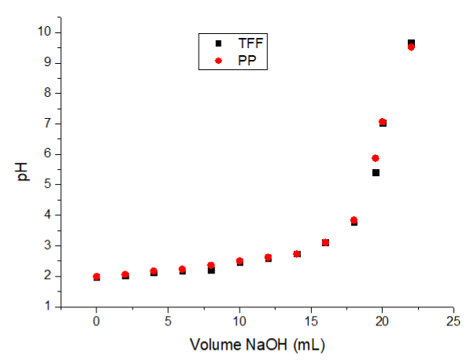
Data from the research results of strong acid and strong base titrations are presented in Tables 2 and 3. Based on the results of research on using the TFF indicator the end point of the titration was obtained by adding 20 mL of 0.1 M NaOH with an average pH of 7.03 and the color change that occurred from pink to colorless at the end point of the titration. The comparison indicator used was the phenolphthalein indicator, the end point of the titration was obtained by adding 20 mL of 0.1 M NaOH with an average pH of 7.07 and the color change that occurred from colorless to purple (Figure 3). This color change is a sign that the titration is stopped, namely at the equivalence point, because the addition of a small titrant will produce a sharp color [20].
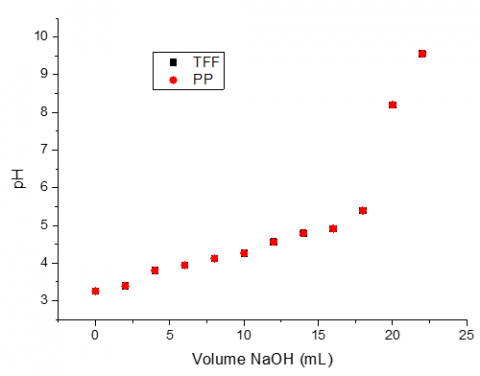
The results of using the TFF indicator and the phenolphthalein indicator as a comparison are presented in the curves in Figure 4. Curve between a strong acid (HCl) and a strong base (NaOH) with the TFF extract as an indicator (shown in the blue line) and phenolphthalein as a comparison indicator (shown with a blue line). Based on these curves it can be seen that the pH values of the two indicators are not too much different. The pH values of the two indicators on the addition of 0 mL to 22 mL of 0.1 M NaOH tend to coincide so that the results are not much different. This indicates that the TFF indicator can be used in weak acid-strong base titrations.
Figure 4. Strong acid (HCl)-strong base (NaOH) titration curve
Table 2. Data on the titration results of 25 mL of 0.1 M HCL and 0.1 M NaOH with torenia fournieri flower extract as an indicator
|
No. |
Volume NaOH (mL) |
pH Titration |
pH Average |
Change Color |
||
|
1 |
2 |
3 |
||||
|
1. |
0 |
1.97 |
1.97 |
1.98 |
1.97 |
Red Young |
|
2. |
2 |
2.00 |
2.03 |
2.04 |
2.02 |
Red Young |
|
3. |
4 |
2.10 |
2.11 |
2.15 |
2.12 |
Red Young |
|
4. |
6 |
2.18 |
2.19 |
2.20 |
2.19 |
Red Young |
|
5. |
8 |
2.22 |
2.22 |
2.24 |
2.22 |
Red Young |
|
6. |
10 |
2.46 |
2.44 |
2.49 |
2.46 |
Red Young |
|
7. |
12 |
2.59 |
2.60 |
2.63 |
2.60 |
Red Young |
|
8. |
14 |
2.73 |
2.74 |
2.76 |
2.74 |
Red Young |
|
9. |
16 |
3.12 |
3.13 |
3.15 |
3.12 |
Red Young |
|
10. |
18 |
3.79 |
3.78 |
3.81 |
3.79 |
Red Young |
|
11. |
19.5 |
5.01 |
5.58 |
5.66 |
5.41 |
Pink |
|
12. |
20 |
6.97 |
7.04 |
7.10 |
7.03 |
No colored |
|
13. |
22 |
9.47 |
9.77 |
9.80 |
9.68 |
No colored |
Table 3. Data on the titration results of 25 mL of 0.1 M HCL and 0.1 M NaOH with a phenolphthalein indicator
|
No. |
Volume NaOH (mL) |
pH Titration |
pH Average |
Change Color |
||
|
1 |
2 |
3 |
||||
|
1. |
0 |
1.98 |
1.97 |
2.00 |
1.99 |
No colored |
|
2. |
2 |
2.07 |
2.05 |
2.08 |
2.06 |
No colored |
|
3. |
4 |
2.17 |
2.16 |
2.19 |
2.17 |
No colored |
|
4. |
6 |
2.25 |
2.20 |
2.26 |
2.23 |
No colored |
|
5. |
8 |
2.38 |
2.32 |
2.40 |
2.36 |
No colored |
|
6. |
10 |
2.50 |
2.49 |
2.52 |
2.50 |
No colored |
|
7. |
12 |
2.62 |
2.60 |
2.65 |
2.62 |
No colored |
|
8. |
14 |
2.74 |
2.71 |
2.76 |
2.73 |
No colored |
|
9. |
16 |
3.11 |
3.09 |
3.14 |
3.11 |
No colored |
|
10. |
18 |
3.85 |
3.81 |
3.88 |
3.84 |
No colored |
|
11. |
19.5 |
5.88 |
5.86 |
5.89 |
5.87 |
No colored |
|
12. |
20 |
7.09 |
7.05 |
7.09 |
7.07 |
Purple |
|
13. |
22 |
9.53 |
9.49 |
9.54 |
9.52 |
Purple |
3.4.2 Weak base and strong acid titration
Data on the results of a weak base-strong acid titration using TFF extract can be seen in Tables 4 and 5. Based on these observations, the use of the TFF indicator for the end point of the titration obtained was the addition of 20 mL of 0.1 M HCl with an average pH of 2.5 and a color change from green to pink at the end point of the titration. The comparison indicator used was the methyl orange indicator, the end point of the titration was obtained by adding 20 mL of 0.1 M HCl with an average pH of 3.2 and the color change that occurred from orange to red.
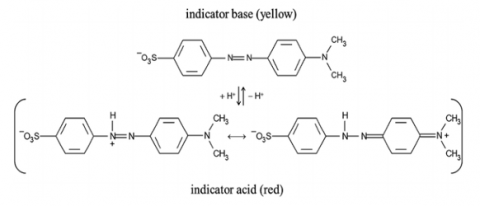
The color change occurs due to the process of balancing the molecular and ionic forms of the indicator compound. The methyl orange indicator undergoes a change in ion equilibrium followed by a color change from red in acidic conditions to yellow in alkaline conditions, with a transition interval from pH 3.0 to 4.4 (Figure 5) [21].
The weak base-strong acid titration curve using the TFF indicator with the comparison indicator, namely the methyl orange indicator, shows that the pH values of the two indicators are not too different. The resulting curve of the two indicators does not have a significant difference. This indicates that the use of TFF indicators can be used for weak base-strong acid titrations.
Figure 5. Equilibrium form of methyl orange [21]
Table 4. Data on the titration results of 25 mL of 0.1 M NH4OH and 0.1 M HCl with torenia fournieri flower extract as an indicator
|
No. |
Volume HCl (mL) |
pH Titration |
pH Average |
Change Color |
||
|
1 |
2 |
3 |
||||
|
1. |
0 |
9.8 |
9.7 |
9.8 |
9.7 |
Green |
|
2. |
2 |
9.3 |
9.6 |
9.4 |
9.4 |
Green |
|
3. |
4 |
9.1 |
9.1 |
9.2 |
9.1 |
Green |
|
4. |
6 |
8.4 |
8.2 |
8.3 |
8.3 |
Green |
|
5. |
8 |
8.0 |
7.9 |
7.9 |
7.9 |
Green |
|
6. |
10 |
7.6 |
7.5 |
7.5 |
7.5 |
Greenish yellow |
|
7. |
12 |
7.1 |
7.1 |
7.3 |
7.3 |
Greenish yellow |
|
8. |
14 |
6.2 |
6.4 |
6.2 |
6.2 |
Greenish yellow |
|
9. |
16 |
5.4 |
5.6 |
5.4 |
5.4 |
Pink |
|
10. |
18 |
4.1 |
4.5 |
4.2 |
4.2 |
Pink |
|
11. |
20 |
2.7 |
2.3 |
2.5 |
2.5 |
Pink |
Table 5. Data on the titration results of 25 mL of 0.1 M NH4OH and 0.1 M HCl with MO indicator
|
No. |
Volume HCl (mL) |
pH Titration |
pH Average |
Change Color |
||
|
1 |
2 |
3 |
||||
|
1. |
0 |
9.6 |
9.7 |
9.7 |
9.6 |
Orange |
|
2. |
2 |
9.4 |
9.4 |
9.3 |
9.3 |
Orange |
|
3. |
4 |
9.0 |
9.1 |
9.0 |
9.0 |
Orange |
|
4. |
6 |
8.4 |
8.5 |
8.5 |
8.4 |
Orange |
|
5. |
8 |
8.0 |
8.0 |
8.0 |
8.0 |
Orange |
|
6. |
10 |
7.5 |
7.4 |
7.3 |
7.4 |
Orange |
|
7. |
12 |
7.0 |
7.0 |
7.1 |
7.0 |
Orange |
|
8. |
14 |
6.3 |
6.2 |
6.2 |
6.2 |
Orange |
|
9. |
16 |
5.2 |
5.4 |
5.4 |
5.3 |
Orange |
|
10. |
18 |
4.2 |
4.2 |
4.3 |
4.3 |
Orange |
|
11. |
20 |
3.2 |
3.5 |
3.5 |
3.2 |
Red |
Table 6. Data on the titration results of 25 mL CH3 COOH 0.1 M and 0.1 M NaOH with the torenia fournieri flower indicator
|
No. |
Volume NaOH (mL) |
pH Titration |
pH Average |
Change Color |
||
|
1 |
2 |
3 |
||||
|
1. |
0 |
3.28 |
3.29 |
3.29 |
3.28 |
Pink |
|
2. |
2 |
3.40 |
3.42 |
3.42 |
3.41 |
Pink |
|
3. |
4 |
3.84 |
3.86 |
3.87 |
3.85 |
Pink |
|
4. |
6 |
3.96 |
3.97 |
3.97 |
3.96 |
Pink |
|
5. |
8 |
4.09 |
4.17 |
4.18 |
4.14 |
Pink |
|
6. |
10 |
4.27 |
4.30 |
4.32 |
4.29 |
Pink |
|
7. |
12 |
4.59 |
4.63 |
4.67 |
4.63 |
Pink |
|
8. |
14 |
4.78 |
4.80 |
4.80 |
4.79 |
Pink |
|
9. |
16 |
4.96 |
4.97 |
4.98 |
4.97 |
Pink |
|
10. |
18 |
5.40 |
5.42 |
5.42 |
5.41 |
Pink |
|
11. |
20 |
8.20 |
8.23 |
8.23 |
8.22 |
Yellow |
|
12. |
22 |
9.50 |
9.80 |
9.82 |
9.70 |
Greenish Yellow |
3.4.3 Weak acid and strong base titration
Data from observations of weak acid-strong base titrations using TFF extracts can be seen in Tables 6 and 7. Observation results from weak acid-strong base titration using phenolphthalein indicator. Based on these observations. the use of the TFF indicator for the end point of the titration was obtained by adding 20 mL of 0.1 M NaOH with an average pH of 8.22 and the color change from pink to yellow at the end point of the titration. The comparison indicator used was the phenolphthalein indicator, the end point of the titration was obtained by adding 20 mL of 0.1 M NaOH with an average pH of 8.20 and the color change that occurred from colorless to purple. The result of using the torenia fournieri flower indicator and the phenolphthalein indicator as a comparison are presented in the curve in Figure 6.
Table 7. Data of titration results of 25 mL CH3COOH 0.1 M and NaOH 0.1 M with phenolphthalein indicator
|
No. |
Volume NaOH (mL) |
pH Titration |
pH Average |
Change Color |
||
|
1 |
2 |
3 |
||||
|
1. |
0 |
3.25 |
3.26 |
3.26 |
3.25 |
Colorless |
|
2. |
2 |
3.38 |
3.40 |
3.40 |
3.39 |
Colorless |
|
3. |
4 |
3.79 |
3.82 |
3.81 |
3.80 |
Colorless |
|
4. |
6 |
3.91 |
3.95 |
3.97 |
3.94 |
Colorless |
|
5. |
8 |
4.02 |
4.15 |
4.20 |
4.12 |
Colorless |
|
6. |
10 |
4.23 |
4.26 |
4.29 |
4.26 |
Colorless |
|
7. |
12 |
4.55 |
4.57 |
4.57 |
4.56 |
Colorless |
|
8. |
14 |
4.73 |
4.77 |
4.79 |
4.79 |
Colorless |
|
9. |
16 |
4.91 |
4.93 |
4.91 |
4.91 |
Colorless |
|
10. |
18 |
5.36 |
5.41 |
5.42 |
5.39 |
Colorless |
|
11. |
20 |
8.17 |
8.20 |
8.24 |
8.20 |
Purple |
|
12. |
22 |
9.34 |
9.65 |
9.70 |
9.56 |
Purple |
Figure 6. Weak acid (CH3COOH) - strong base (NaOH) titration curve
Figure 7. Equilibrium form of phenolphthalein
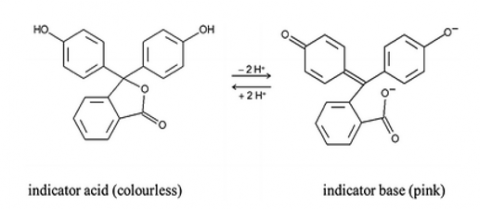
The color change that occurs at the equivalence point, the phenolphthalein indicator from colorless in acidic conditions to pink in alkaline conditions due to changes in ionic balance in its structure, phenolic compounds in ionic form experience delocalization to form red flavylium cations. The resonance structure of phenolphthalein can be seen in Figure 7, with the transition interval from pH 8.0 to 10 [21]. While the equivalence point of the TFF indicator on the acid turns pink and the base turns yellow because the extract contains anthocyanins which in their structure contain flavilium cations to form anhydrobase due to changes in pH to yellow chalcones. In slightly acidic aqueous solutions, anthocyanins exist essentially as four molecular species in chemical equilibrium: the red flavylium cation, the blue quinonial base, the colorless pseudo-base carbinol, and the yellow chalcone (Figure 3). A weak acid - strong base titration curve using torenia fournieri flower extract with a phenolphthalein indicator as a comparison indicator, that on the addition of a NaOH solution from 0 mL to 22 mL, the two curve lines tend to coincide indicating that the pH values obtained from the two indicators are not much different either. This indicates that the use of TFF extract indicators can be used for weak acid-strong base titrations.
torenia fournieri flower (TFF) extract shows a color change ability similar to phenolphthalein (PP) and methyl orange indicators, but with a narrower color range. Therefore, torenia fournieri flower extract can be used as a safe, cheap and environmentally friendly alternative acid-base indicator, both for strong acid-strong base titrations and weak acid-strong base titrations. However, further research needs to be carried out to evaluate the reproducibility and stability of torenia fournieri flower extract as an indicator.
The authors thanks to the Chemistry Laboratory of Teacher Training and Education Faculty, Tadulako University for the facilities during research and analysis of the samples.
[1] Apriyani, F., Idiawati, N., Destiarti, L. (2016). Ekstrak metanol buah lakum (Cayratia trifolia (L.) Domin) sebagai indikator alami pada titrasi basa kuat asam kuat. Jurnal Kimia Khatulistiwa, 5(4).
[2] Im, R., Iwayama, T., Osa, M. (2023). Development of acid–base indicators from natural pigments in Agar Gel. Journal of Chemical Education, 100(12): 4707-4713. https://doi.org/10.1021/acs.jchemed.3c00131
[3] Leshe, S., Baye, H. (2020). Extraction of green acid-base indicators from acanthus pubescens flower for use in the school laboratory. International Journal of Chemistry, 12(2): 35. https://doi.org/10.5539/ijc.v12n2p35
[4] Reyes, D., Santos, M., Cruz, J., Ascaño, F., Baldovino, B., Camarillo, B., Inoncillo, R., Saavedra, L.J., Dauz, C., Ducut, A., Guela, M.G., Lanuza, E., Nabor, R., Policarpio, J. R., Santos, D. Jr., Tolentino, K., Villanueva, M., Waje, S. (2022). Utilization of plant material extracts as natural acid-base indicators: An example of at-home lab experiment in the new normal learning set-up. The QUEST: Journal of Multidisciplinary Research and Development, 1(2). https://doi.org/10.60008/thequest.v1i2.14
[5] Nag, M., Paul, R.K., Biswas, S., Dasgupta, D., Roy, D., Bhattacharjee, P., Chattopadhyay, S., Mallick, A. (2023). A review on application of natural indicators in acid-base titration. Pharmacognosy Reviews, 17(34): 308-319. https://doi.org/10.5530/phrev.2023.17.10
[6] Harborne, J.B. (1958). Spectral methods of characterizing anthocyanins. Biochemical Journal, 70(1): 22-28. https://doi.org/10.1042/bj0700022
[7] Rahmawati, S, Aminah, S., Nuryanti, S., Sangkota, V. D. A., (2023). Flower extract tapak dara (Catharanthus roseus L) as acid–base indicator. Malaysian Journal of Chemistry. 25(5): 207-215. https://doi.org/10.55373/mjchem.v25i5.207
[8] Ainuna Rohma, S., Rohma, N., Shafira Rizky, A., Prestiani, P., Firmansyah, D., Kristianto, S. (2023). Comparison of butterfly pea extract and purple sweet potato as a natural indicator of acid-base solution. Journal of Natural Sciences and Learning, 2(1): 6-10. https://doi.org/10.30742/jnsl.v2i1.46
[9] Genevieve, O. (2020). Acid-base indicator properties of dye from local plant: The rosella calyces (Hibiscus Sabdariffa). Journal of Textile Science & Engineering, 10(4). https://doi.org/10.37421/jtese.2020.10.409
[10] Rahmawati, R., Nuryanti, S., Ratman, R. (2017). Indikator asam-basa dari bunga dadap merah (Erythrina crista-galliL.). Jurnal Akademika Kimia, 5(1): 29. https://doi.org/10.22487/j24775185.2016.v5.i1.7997
[11] Yara-Varón, E., Fabiano-Tixier, A.S., Balcells, M., Canela-Garayoa, R., Bily, A., Chemat, F. (2016). Is it possible to substitute hexane with green solvents for extraction of carotenoids? A theoretical versus experimental solubility study. RSC Advances, 6(33): 27750-27759. https://doi.org/10.1039/C6RA03016E
[12] Kowalska, G., Wyrostek, J., Kowalski, R.K., Pankiewicz, U. (2021). Evaluation of glycerol usage for the extraction of anthocyanins from black chokeberry and elderberry fruits. Journal of Applied Research on Medicinal and Aromatic Plants, 22, 100296. https://api.semanticscholar.org/CorpusID:233965456
[13] Ninan Lestario, L., Catur Yoga, M.K.W., Ignatius Kristijanto, A. (2015). Stabilitas antosianin jantung pisang kepok (Musa paradisiaca L) terhadap cahaya sebagai pewarna agar-agar (Anthocyanin stability of banana bract (Musa paradisiaca L) toward light for jelly colorant). Jurnal Agritech, 34(04): 374. https://doi.org/10.22146/agritech.9431
[14] Nuryanti, S., Matsjeh, S., Anwar, C., Raharjo, T.J. (2010). Indikator titrasi asam-basa dari ekstrak bunga sepatu (Hibiscus rosa sinensis L). AgriTECH, 30(3): 178-183. https://doi.org/10.22146/agritech.9671
[15] Amogne, N.Y., Ayele, D.W., Tsigie, Y.A. (2020). Recent advances in anthocyanin dyes extracted from plants for dye sensitized solar cell. Materials for Renewable and Sustainable Energy, 9(4): 23. https://doi.org/10.1007/s40243-020-00183-5
[16] Cruz, L., Basílio, N., Mateus, N., de Freitas, V., Pina, F. (2022). Natural and synthetic flavylium-based dyes: The chemistry behind the color. Chemical Reviews, 122(1): 1416-1481. https://doi.org/10.1021/acs.chemrev.1c00399
[17] Gençdağ, E., Özdemir, E.E., Demirci, K., Görgüç, A., Yılmaz, F.M. (2022). Copigmentation and stabilization of anthocyanins using organic molecules and encapsulation techniques. Current Plant Biology, 29: 100238. https://doi.org/10.1016/j.cpb.2022.100238
[18] Vankar, P.S., Shukla, D. (2011). Natural dyeing with anthocyanins from Hibiscus rosa sinensis flowers. Journal of Applied Polymer Science, 122(5): 3361-3368. https://doi.org/10.1002/app.34415
[19] Akther, S., Sultana, F., Badsha, M.R., Sultana Jothi, J., Alim, M.A. (2020). Anthocyanin stability profile of mango powder: Temperature, pH, light, solvent and sugar content effects. Turkish Journal of Agriculture - Food Science and Technology, 8(9): 1871-1877. https://doi.org/10.24925/turjaf.v8i9.1871-1877.3487
[20] Caraballo, R.M., Saleh Medina, L.M., Gomez, S.G.J., Vensaus, P., Hamer, M. (2021). Turmeric and RGB analysis: A low-cost experiment for teaching acid–base equilibria at home. Journal of Chemical Education, 98(3): 958-965. https://doi.org/10.1021/acs.jchemed.0c01165
[21] Kahlert, H., Meyer, G., Albrecht, A. (2016). Colour maps of acid–base titrations with colour indicators: How to choose the appropriate indicator and how to estimate the systematic titration errors. ChemTexts, 2(2): 7. https://doi.org/10.1007/s40828-016-0026-4