Umar Ode Hasani*![]() | Laode Sabaruddin
| Laode Sabaruddin![]() | Sitti Marwah
| Sitti Marwah![]() | La Baco Sudia
| La Baco Sudia![]() | Abdul Manan
| Abdul Manan![]()
© 2024 The authors. This article is published by IIETA and is licensed under the CC BY 4.0 license (http://creativecommons.org/licenses/by/4.0/).
OPEN ACCESS
The stewardship of water resources, a vital pillar of any ecosystem, underpins the evolution of sustainable socio-economic systems, particularly on islands. This study employs a dynamic system analysis to model sustainable water resource management on Wangi-Wangi Island in Wakatobi Regency, an area prone to raw water deficits. Four distinct scenarios have been constructed for this analysis: the existing 'Business as Usual' scenario (BAU), Scenario-1 (water conservation efforts and water-saving movements increased by 5%), Scenario-2 (an extension of Scenario-1 with a 7.5% increase in interventions and a 2.5% tourist growth rate control), and Scenario-3 (an expansion of Scenario-2 with an additional 5% increase in interventions). Preliminary system dynamic analysis outcomes indicate that, under the BAU scenario, the Wangi-Wangi Islands could face a raw water shortfall of -1,293,622 m3/year from 2016 through 2055. This underscores an urgent need for policy intervention to foster a sustainable water resource management system. Under Scenario-1, a modest improvement is predicted, with a small surplus of water availability (543,785 m3/year) projected. Scenario-2 anticipates a surplus of 1,690,506 m3/year until the period of 2044-2047, while Scenario-3 predicts a surplus of 1,085,029 m3/year through the end of the projection period. These projected surpluses, however, are contingent upon robust support from all stakeholders in terms of policy enforcement, financial investment, and public awareness. This study’s findings underscore the critical need for comprehensive, sustainable water resource management policies and practices in island settings to avert impending water crises.
dynamic system, island, sustainable, water resource management, Wangi-Wangi Island, Wakatobi
Water, an indispensable natural resource and fundamental human need [1, 2], is utilized for diverse purposes spanning domestic, agricultural, industrial, and tourism activities [3, 4]. In fact, the spatial and temporal distribution of a region's water resources is not uniform. Water scarcity has hampered both social and economic growth. Therefore, optimal water resource management emerges as a critical strategy for achieving water resource sustainability.
Water resource management significantly influences economic and social development, especially on islands such as the Wangi-Wangi Islands. Serving as the capital of Wakatobi Regency, the Wangi-Wangi Islands are currently undergoing substantial infrastructural development to support the burgeoning tourism industry. This development, however, is juxtaposed with the islands' limited land resources, leading to reduced soil infiltration [1, 5, 6]. The tourism industry, in turn, exacerbates water usage, thereby instigating an imbalance between demand and supply. This confluence of circumstances projects a looming water shortage in the future.
Water resources in the Wangi-wangi Islands face numerous challenges, such as decreasing water flow, seawater intrusion, and insufficient water resource management. Consequently, prioritization of intelligent, sustainable water resource management solutions becomes an imperative for the district government of Wakatobi.
The system dynamic method can be used to assess water resource management [4]. The formulation of dynamic system models is necessary for simplifying and comprehending complex conditions, thereby enabling control. A solid grasp of dynamic evolution enables decision makers to establish targeted policies and activities to promote the efficient use and sustainable development of water resources. This model is employed to predict water supply and demand in the forthcoming years, in addition to identifying variables that substantially impact the water balance.
Applications of dynamic systems in water resource management in island areas was carried out on Tarakan Island, East Kalimantan Province [7], and Tidore Island, North Maluku [8]. These studies affirm the efficacy of dynamic system applications in anticipation and mitigation of impending water resource crises. However, such an application has yet to be initiated on Wangi-Wangi Island, Wakatobi Regency. Therefore, the aim of the paper is to model sustainable water resource management on Wangi-Wangi Island in Wakatobi Regency.
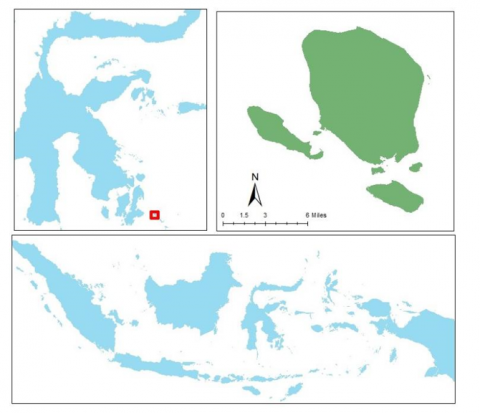
This research was carried out on Wangi-Wangi Island, Wakatobi Regency, in the south of Sulawesi. The overall area is 19.005.56 acres, stretching between 5°26'10.6" to 5°14'38.1" South latitude and 123°27'45.8" to 123°39'3.6" East longitude (Figure 1) [9]. The data used include land use, rainfall data, and literature review.
Water balance analysis is used in this region to assess the sustainability of water resources, namely water demand and supply. Domestic needs, public facilities, and tourists all contribute to total water demand. Residential and tourist water demand are determined by multiplying the number of residents and tourists by the average water consumption (Eq. (1)), whereas public facility water demand is calculated by multiplying 12.5% of residential water demand [10]. The number of people [4] and their growth rate have a substantial impact on an area's water consumption (Eqs. (2) and (3)).
DMI =Pn × Std × 365 (1)
Pn = P0 (1+r)n (2)
$r=\left(\frac{P t}{P_0}\right)^{1 / t}-1$ (3)
where, DMI is the domestic/tourist water demand, Pn is the amount of domestic/tourists, std is the standard individual water needs of 120 liters/person/day, P0 is the simulation's start year, r is the growth rate, Pt is the amount of domestic/tourists from year to year, and n is the amount of years.
The water availability analysis is based on Minister of Environment Regulation No. 17 of 2009 [11] concerning Guidelines for Determining Environmental Carrying Capacity in Regional Spatial Plans (Eqs. (4)-(6)).
$\mathrm{CRO}=\left(\sum(\mathrm{Ci} \times \mathrm{Ai})\right) /\left(\sum \mathrm{Ai}\right)$ (4)
$\mathrm{R}=\left(\sum(\mathrm{Ri})\right) / \mathrm{m}$ (5)
$\mathrm{SA}=10 \times \mathrm{CRO} \times \mathrm{R} \times \mathrm{A}$ (6)
where, SA is the water supply (m3/year), CRO is the coefficient of weighted runoff, and Ci is the coefficient of land use runoff, Ai represents the land use area, R is the algebraic average annual rainfall (mm/year) for the region, and Ri is the yearly rainfall at the station, m is mount of rainfall observation stations, A is the area (ha), and 10 is the conversion ratio from mm/ha to m3.
To determine the status of water resource sustainability, the relationship between supply and demand is examined using the status ratio (SR) limit (Eqs. (7) and (8)).
Water Balance=Supply-Demand (7)
SR=Supply/Demand (8)
This study employs four scenarios: the existing scenario, business as usual; scenario-1, the model was built by implementing a 5% water saving movement and efforts to conserve water resources with civil engineering (infiltration wells) in settlement areas and savanna as well as reforestation in forest areas and agroforestry in dry land agricultural areas, mixed gardens respectively by 5%; Scenario 2: the model was created by implementing water-saving movements of 7.5%, water-resource conservation efforts of 7.5%, and a controlled tourist growth rate of 2.5%; Scenario 3: the model was created by implementing 10% water-saving movements, 10% water-resource conservation efforts, and a controlled tourist growth rate of 5%.
Figure 1. Study site
Model validation is used to identify major flaws in a model's design. Model validation in this study employs a statistical test known as MAPE (Mean Absolute Percentage Error) using a 5% error percentage. The MAPE equation is shown below.
$\mathrm{MAPE}=\frac{1}{\mathrm{n}} \frac{\sum(\mathrm{St}-\mathrm{At})}{A t} \times 100 \%$ (9)
where, At represents the actual value. St represents the simulation outcome value, and n represents the amount of data (time/data).
3.1 Land use
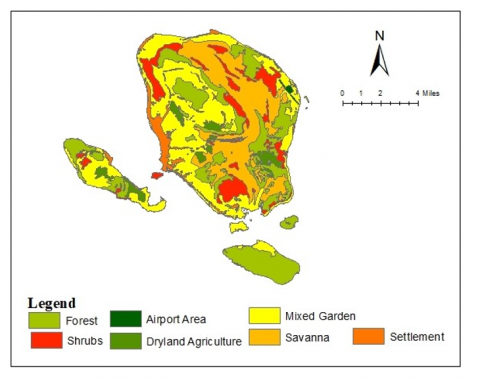
Remote sensing can help in land use identification [12]. This study makes use of Landsat 8 OLI satellite imagery in 2022. The analysis results show that Mixed Garden (33.21% or 6.284.52 ha) dominate the area's land use, then there is forest (25.49% or 4823.01 ha), dryland agriculture (22.46% or 4.249.98 ha), savanna (10.18% or 1.925.73 ha), settlement (4.59% or 868.14 ha), shrubs (3.82% or 722.25 ha), and airport area (0.26% or 49.68 ha) (Figure 2).
Land use change has an impact on hydrological processes [13], including increased runoff [14]. Vegetation land use has lower run off than non-vegetation land use. The denser the vegetation, the lesser the run off, and vice versa. The CRO value in this investigation is derived from a literature review [15] (Table 1).
3.2 Submodel of water demand
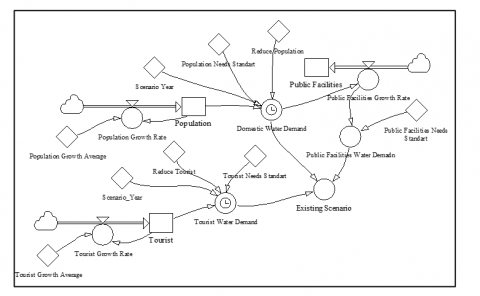
The water demand sub-model shows water demand for a variety of sectors, including domestic, public, and tourism (Figure 3). The amount and rate of population growth have an impact on domestic water needs [4]. This scenario also exists in the tourism sector, and the domestic demand variable of 12.5% affects public facilities [9]. The tourism industry's expansion has a considerable impact on water demand.
The total number of persons living and visiting Wangi-Wangi Island is predicted to grow every year between 2016 and 2055. At the start of the projected year, namely the 2016-2019 period, there were 94.985 and 3.500 people in each sector, respectively, while at the end of the year, there were 103.174 and 1.681.344 people (Table 2). The population and public facilities sectors both increased, but the tourist sector increased dramatically. This is because the Wakatobi Islands are a popular tourist attraction located in a coral triangle area [16] with 750 kinds of coral and 942 species of fish [17].
Table 1. Land use and CRO
|
Land Use |
Area (ha) |
% |
CRO |
|
Forest |
4.823.01 |
25.49 |
0.14 |
|
Airport Area |
49.68 |
0.268 |
0.85 |
|
Mixed Garden |
6.284.52 |
3.21 |
0.35 |
|
Settlement |
868.14 |
4.59 |
0.42 |
|
Dryland Agriculture |
4.249.98 |
22.46 |
0.32 |
|
Savanna |
1.925.73 |
10.18 |
0.35 |
|
Shrubs |
722.25 |
3.82 |
0.35 |
|
Total |
18.923.31 |
100 |
|
Figure 2. Land use Wangi-Wangi Islands
Figure 3. The water demand sub-model's structure
Table 2. Projection of the Wangi-Wangi Islands' population, tourism, and water demand
|
Period |
Population (persons) |
Tourist (persons) |
Water Demand (m3/years) |
|||
|
Population |
Tourist |
Public Facilities |
Total |
|||
|
2016-2019 |
94.985 |
3.511 |
4.160.343 |
153.781 |
520.042 |
4.834.167 |
|
2020-2023 |
95.681 |
6970 |
4.198.750 |
305.286 |
524.843 |
5.028.880 |
|
2024-2027 |
96.746 |
13.836 |
4.237.512 |
606.053 |
529.689 |
5.373.254 |
|
2028-2031 |
97.640 |
27.468 |
4.276.632 |
1.203.132 |
534.579 |
6.014.344 |
|
2032-2035 |
98.541 |
54.503 |
4.316.113 |
2.388.451 |
539.514 |
7.244.078 |
|
2036-2039 |
99.451 |
108.254 |
4.355.958 |
4.741.538 |
544.494 |
9.641.992 |
|
2040-2043 |
100.369 |
214.905 |
4.396.171 |
9.412.872 |
549.521 |
14.358.566 |
|
2044-2047 |
101.295 |
426.629 |
4.436.756 |
18.686.375 |
554.594 |
23.677.726 |
|
2048-2051 |
102.230 |
846.942 |
4.477.715 |
37.096.073 |
559.714 |
42.133.503 |
|
2052-2055 |
103.174 |
1.681.344 |
4.519.052 |
73.642.889 |
564.881 |
78.726.824 |
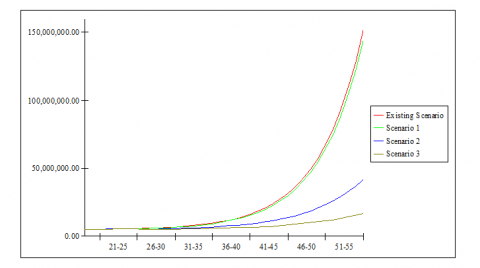
Figure 4. Water demand projections in multiple scenarios
Water demand forecasting research reveals an increase over time. The total water demand in each sector at the beginning of the 2016-2019 period is for domestic (4.160.343 m3/year), public facilities (520.042 m3/year) and tourists (153.781 m3/year) with a total water demand of 4.834.167 m3/year, while the overall water demand at the end of the period is 78.726.824 m3/year, consisting of domestic (4.519.052 m3/year), public facilities (564.881 m3/year) and tourists (73.642.889 m3/year) (Table 2). This shows that the tourism industry consumes more water than the people sector and government services.
The characteristics of the island area have challenges with clean water supply due to limited land resources and are prone to seawater intrusion [18], so a clean water crisis may emerge in the future. As a result, it is required to develop a model for the utilization of water resources based on the carrying capacity of the island [19] in order to ensure universal access to the clean water sector in accordance with the SDGs targets.
The concept of sustainable water resource management is executed by interfering in the water consumption behavior of each sector with water-saving movement guidelines and controlling the rate of tourism growth. This is done to enhance water efficiency.
The simulation results show that water demand increased by 4.834.167 m3/year at the start of the 2016-2019 period and by 78.726.824 m3/year at the end of the 2052-2055 period. However, if the water-saving movement is implemented without controlling the growth rate of tourists (scenario-1), water demand will decrease by 74.978.678 m3/year at the end of the 2052-2055 period. As a result, water usage will fall by 25.950.602 m3/year (scenario-2) and 12.219.608 m3/year (scenario-3) until the end of the 2052-2055 period (Figure 4).
3.3 Submodel of water supply
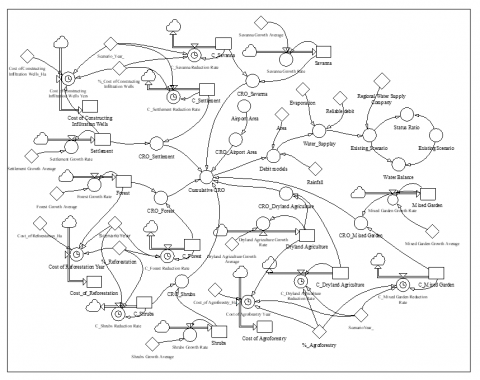
The water supply sub-model is conceptually governed by the supply-demand connection (Figure 5). Water supply is estimated using Minister of Environment Regulation No. 17 of 2009 and Regional Drinking Water Companies (PDAMs).
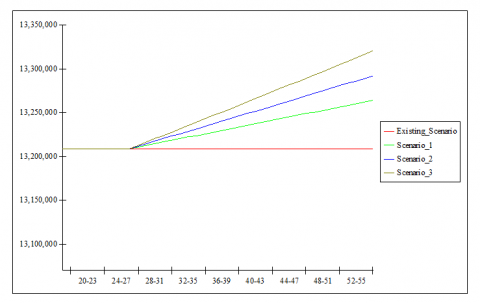
The water supply in this area is calculated to be 12.639.879 m3, and the PDAMs capacity is 56.881 m3, for a total supply of 13.208.696 m3. Based on the water balance value, the water supply in this area can only be sufficient until the 2040-2043 period if the future water supply is assumed to be the same as it is currently. This shows that water supply is restricted, yet water demand continues to rise in tandem with the rate of growth in many sectors in this region. The findings of the water balance analysis in this region show a water deficit of 1.293.622 m3/year with an SR value of 0.91 (1) in the 2040-2043 period and a deficit of 65.716.228 m3/year until the end of the 2052-2055 period with an SR value of 0.17 (Table 3). Water resource management, as well as vegetation conservation and civil engineering, should be prioritized in this regard. This lessens the likelihood of a future clean water crisis.
To increase water supply, various intervention models are utilized. Results from simulations suggest that when scenario-1 variables are employed beginning in 2026, the water deficit will decrease from 543,785 m3/year by an SR value of 0.96 for the 2040-2043 period. When the population's water needs are reduced by 5% from 14,502,319 m3 to 13,233,417 m3, the water supply increases in the 2040-2043 decade. Furthermore, conservation policies to enhance groundwater recharge through the construction of infiltration wells, reforestation, and agroforestry can increase water availability in this region, but this scenario is not substantial in terms of delivering water resources until the end of the period.
Figure 5. The water supply sub-model's structure
Figure 6. Water supply projections in multiple scenarios
Table 3. Projection of the Wangi-Wangi Islands' water supply-demand, water balance, and SR
|
Period |
Water Supply (m3/years) |
Water Demand (m3/years) |
Water Balance |
SR |
|
2016-2019 |
13.208.696 |
4.834.167 |
8.329.836 |
2.71 |
|
2020-2023 |
13.208.696 |
5.028.880 |
8.119.467 |
2.60 |
|
2024-2027 |
13.208.696 |
5.373.254 |
7.759.103 |
2.42 |
|
2028-2031 |
13.208.696 |
6.014.344 |
7.101.684 |
2.16 |
|
2032-2035 |
13.208.696 |
7.244.078 |
5.855.274 |
1.80 |
|
2036-2039 |
13.208.696 |
9.641.992 |
3.440.344 |
1.35 |
|
2040-2043 |
13.208.696 |
14.358.566 |
-1.293.622 |
0.91 |
|
2044-2047 |
13.208.696 |
23.677.726 |
-10.630.528 |
0.55 |
|
2048-2051 |
13.208.696 |
42.133.503 |
-29.104.419 |
0.31 |
|
2052-2055 |
13.208.696 |
78.726.824 |
-65.716.228 |
0.17 |
Table 4. The cost of constructing infiltration wells in multiple scenarios
|
Period |
Scenarios-1 (IDR) |
Scenarios-2 (IDR) |
Scenarios-3 (IDR) |
|
2028-2031 |
652.978 |
979.567 |
1.305.956 |
|
2032-2035 |
1.967.575 |
2.951.363 |
3.935.150 |
|
2036-2039 |
3.293.779 |
4.940.669 |
6.587.559 |
|
2040-2043 |
4.631.692 |
6.947.539 |
9.263.385 |
|
2044-2047 |
5.981.418 |
8.972.128 |
11.962.837 |
|
2048-2051 |
7.343.061 |
11.014.592 |
14.686.123 |
|
2052-2055 |
8.716.726 |
13.075.089 |
17.433.452 |
Water conservation policies and conservation efforts were increased to 7.5% in scenario-2, increasing the water surplus by 1,690,506 m3/year with an SR value of 1.15 until the 2044-2047 period, after that there will be a deficit until the end of the period. This suggests that implementing this scenario has the potential to enhance water supply, even if it is ineffective in practice.
In scenario 3, there is a surplus of 1,085,029 m3/year until the end of the 2052-2055 period, with an SR value of 1.09 (Figure 6), due to the policy of water-saving movement, making absorption wells, reforestation and agroforestry is increased to 10% and the rate of tourists is controlled by 5%. The effort has been successful in decreasing the need for water by the community and tourists while also enhancing water availability by minimizing run-off volumes. The lower the runoff coefficient, the lower the runoff flow and the greater the groundwater recharge. Conservation activities, both civil and vegetative, are undertaken to minimize the run off coefficient. This endeavor has been made to avoid a future water resource disaster. This might make it easier for stakeholders to make decisions on water resource management in the Wangi-Wangi Islands, Wakatobi Regency.
This strategy can be enhanced by providing financial support for conservation activities. Infiltration wells, a type of civil engineering, are used in residential areas and savannas. Infiltration wells can reduce runoff rates, raise groundwater reserves, and prevent lowering of groundwater levels and seawater intrusion on islands [4]. It costs IDR 735,000 [20] to construct an infiltration well. The simulation results show that the cost of making infiltration wells at the beginning of the conservation policy, namely the 2028-2031 period, is IDR 652.978 (scenario 1), IDR 979.467 (scenario 2) and IDR 1.305.956 (scenario 3) and has increased by IDR 8.716.726 (scenario 1), IDR 13.075.089 (Scenario 2) and IDR 17.433.452 (scenario 3) at the end of the 2052-2055 period (Table 4). Infiltration wells are very cheap and save a lot of water so it can be used a priority program in the Regional Revenues and Expenditures Budget for the fiscal year 2026.
Revegetation is a strategy to sustainable water resource conservation that involves the planting of trees to rehabilitate and restore vegetation. Revegetation includes reforestation in forest regions, agroforestry on dryland agriculture, and mixed gardens. The average cost of revegetation is IDR 1.500.000 per hectare [21]. The results of the analysis show that the cost of reforestation at the beginning of the scenario for the 2028-2031 period is IDR 6.705.957 (scenario 1), IDR 10.058.936 (scenario 2), and IDR 13.411.915 (scenario 3) and has increased by IDR 80.053.471 (scenario- 1), IDR 120.080.206 (Scenario 2) and IDR 160.160.942 (scenario 3) at the end of the 2052-2055 period. The cost of agroforestry is IDR 6.647.877, IDR 9.971.815 and IDR 13.295.754 at the start of the 2028-2031 period, rising to IDR 90.703.630, IDR 136.055.446 and IDR 181.407.261 at the end of the 2052-2055 period (Table 5).
3.4 Model validation
A good model a model that is accurate to the situation. Errors in model design have an impact on decision-making errors [4]. As a result, while modelling water resource management in this region, model fidelity is necessary. In this work, the model was validated by comparing actual population growth data to simulation results. The proportion of population growth has a large influence on population growth; the bigger the percentage of population growth, the greater the requirement for water. It is due to the population's reliance on water supplies to meet their high living needs. Population growth and water consumption follow a sigmoid curve growth pattern that will reach an equilibrium point at some point. The results of model validation reveal that the resulting model has a r value close to one and a MAPE value of 5%. As a result, the model (Table 6 and Figure 7) is quite valid in this scenario.
Table 5. The cost of reforestation and agroforestry in multiple scenarios
|
Period |
Reforestation (IDR) |
Agroforestry (IDR) |
||||
|
Scenarios-1 |
Scenarios-2 |
Scenarios-3 |
Scenarios-1 |
Scenarios-2 |
Scenarios-3 |
|
|
2028-2031 |
6.705.957 |
10.058.936 |
13.411.915 |
6.647.877 |
9.971.815 |
13.295.754 |
|
2032-2035 |
19.830.599 |
29.745.899 |
39.661.199 |
20.103.927 |
30.155.890 |
40.207.854 |
|
2036-2039 |
32.581.314 |
48.871.972 |
65.162.629 |
33.776.569 |
50.664.853 |
67.553.138 |
|
2040-2043 |
44.968.756 |
67.453.134 |
89.937.512 |
47.669.289 |
71.503.934 |
95.338.578 |
|
2044-2047 |
57.003.273 |
85.504.910 |
114.006.547 |
61.785.630 |
92.678.445 |
123.571.261 |
|
2048-2051 |
68.694.922 |
103.042.384 |
137.389.845 |
76.129.191 |
114.193.787 |
152.258.383 |
|
2052-2055 |
80.053.471 |
120.080.206 |
160.106.942 |
90.703.630 |
136.055.446 |
136.055.446 |
Table 6. Validation of models
|
Years |
Actual (At) |
Simulation (St) |
MAPE |
|
2014 |
94985 |
94985 |
(0.9459) |
|
2015 |
95209 |
95203 |
(0.5578) |
|
2016 |
95386 |
95422 |
0.0377 |
|
2017 |
95737 |
95641 |
0.4537 |
|
2018 |
95892 |
95861 |
0.9223 |
|
MAPE |
(0.02) |
||
|
r |
0.99 |
||
Figure 7. Validation of models
According to the dynamic model, the greater the population and tourist increase, the greater the demand for water resources, and the lower the supply, resulting in a water deficit. Furthermore, the higher the runoff flow, the lower the groundwater infiltration, and the lower the water availability in the soil. Water resource management efforts must be adopted to conserve water by implementing water-saving movement laws, reducing tourist growth rates, drilling absorption wells, and reforestation. This is seen in Scenario 3, where water is in surplus until the end of the period, preventing a future water crisis.
Increasing water availability comes at a high expense, and the Wakatobi Regency APBD budget for water resources is restricted. As a result, given that Wakatobi Regency is a Special Economic Zone for the Tourism Sector, the government should use Special Budget Funds sourced from the APBN and invite investors to engage in this area. Besides from that, community involvement with the Willingness to Pay (WTP) idea might be leveraged in attempts to offer water resources in this region.
To ensure the sustainability of water resources in the Island, more research is needed on increasing the production capacity and distribution of PDAM services, building Micro Clean Water Treatment Plants around settlements and water springs, and distilling sea water into clean water as an alternative water resource.
[1] Tuwu, E.R., Kete, S. (2017). Analisis kualitas air tanah berdasarkan variasi kedalaman muka air di daerah aliran sungai (DAS) wanggu kota kendari, Sulawesi Tenggara. Biowallacea, 4(1): 547-557.
[2] Mulyana, W., Prasojo, E. (2020). Indonesia urban water governance: The interaction between the policy domain of urban water sector and actors network. International Journal of Sustainable Development and Planning, 15(2): 211-218. https://doi.org/10.18280/ijsdp.150211
[3] Khashogji, M.S., El Maghraby, M.M. (2013). Evaluation of groundwater resources for drinking and agricultural purposes, Abar Al Mashi area, south Al Madinah Al Munawarah City, Saudi Arabia. Arabian Journal of Geosciences, 6: 3929-3942. https://doi.org/10.1007/s12517-012-0649-8
[4] Kete, S.C.R. (2018). Model pengelolaan air tanah berkelanjutan di kota kendari. Doctoral dissertation, IPB University.
[5] Selvakumar, S., Chandrasekar, N., Kumar, G. (2017). Hydrogeochemical characteristics and groundwater contamination in the rapid urban development areas of Coimbatore, India. Water Resources and Industry, 17: 26-33. https://doi.org/10.1016/j.wri.2017.02.002
[6] Al-Ansari, N. (2013). Management of water resources in Iraq: Perspectives and prognoses. Engineering, 5(6): 667-684. https://doi.org/10.4236/eng.2013.58080
[7] Azmanajaya, E. (2012). Sustainable Water Supply Modelling in Small Island (Case Study: Tarakan Island, East Kalimantan). Bogor, IPB University.
[8] Malaka, H. (2015). Model of Water Demand and Groundwater Availability at Tidore Island. Bogor, IPB University.
[9] BPS Kabupaten Wakatobi. https://wakatobikab.bps.go.id/, accessed on Dec. 6, 2023.
[10] Penyusunan neraca sumber daya Bagian 1: Sumber daya air spasial. https://www.big.go.id/assets/download/sni/SNI/SNI%2019-6728.1-2002.pdf, accessed on Sep. 25, 2023.
[11] KLHK. (2009). Peraturan menteri negara lingkungan hidup nomor 17 tahun 2009 tentang pedoman penentuan daya dukung lingkungan hidup dalam penataan ruang wilayah. Jakarta (Id): Klh.
[12] Kete, S.C.R., Tarigan, S.D., Effendi, H. (2019). Land use classification based on object and pixel using Landsat 8 OLI in Kendari City, Southeast Sulawesi Province, Indonesia. IOP Conference Series: Earth and Environmental Science, 284(1): 012019. https://doi.org/10.1088/1755-1315/284/1/012019
[13] Ahmadi-Sani, N., Razaghnia, L., Pukkala, T. (2022). Effect of land-use change on runoff in Hyrcania. Land, 11(2): 220. https://doi.org/10.3390/land11020220
[14] Atharinafi, Z., Wijaya, N. (2021). Land use change and its impacts on surface runoff in rural areas of the upper citarum watershed (case study: Cirasea subwatershed). Journal of Regional and City Planning, 32(1): 36-55. https://doi.org/10.5614/jpwk.2021.32.1.3
[15] Asdak, C. (2023). Hidrologi dan pengelolaan daerah aliran sungai. UGM PRESS.
[16] Purbani, D., Ramdhan, M., Arifin, T., Salim, H., Novianti, N. (2014). Karakteristik Pantai Taman Nasional Wakatobi dalam Mendukung Potensi Wisata Bahari: Studi Kasus Pulau Wangi-Wangi. Jurnal Depik, 3(2): 137-145. https://doi.org/10.13170/depik.3.2.1539
[17] Pet-Soede, L., Erdmann, M. (2003). Rapid ecological assessment Wakatobi National Park. In TNC-WWF Join Program Wakatobi-Indonesia. WWF Indonesia Marine Program, Denpasar.
[18] Kete, S.C.R., Suprihatin, S., Tarigan, S.D., Effendi, H. (2019). Identification and distribution of sea water intrusion to shallow groundwater in Kendari City, Southeast Sulawesi. Jurnal Teknik Lingkungan, 21(2): 174-182.
[19] Sudia, L.B., Kahirun., Kete, S.C.R., Erif, L.M. (2023). Watershed management performance assessment based on land condition indicators (Laeya Watershed Case, Southeast Sulawesi Province. ASTONJADRO, 12(2): 583-590. https://doi.org/10.32832/astonjadro.v12i2.10834
[20] Bahunta, L., Waspodo, R.S.B. (2019). Rancangan Sumur Resapan Air Hujan sebagai Upaya Pengurangan Limpasan di Kampung Babakan, Cibinong, Kabupaten Bogor. Jurnal Teknik Sipil dan Lingkungan, 4(1): 37-48. https://doi.org/10.29244/jsil.4.1.37-48
[21] Dennis, R. (1999). A Review of Fire Projects in Indonesia, 1982-1998. Center for International Forestry Research, Bogor, Indonesia.