Ainur Sagynbayeva*![]() | Bulkair Mambetov
| Bulkair Mambetov![]() | Andrey Kalachev
| Andrey Kalachev![]() | Zhumagul Boranbay
| Zhumagul Boranbay![]() | Yelena Borissenko
| Yelena Borissenko![]() | Zhadyra Baigazakova
| Zhadyra Baigazakova![]() | Karshyga Turlybekov
| Karshyga Turlybekov![]()
© 2023 IIETA. This article is published by IIETA and is licensed under the CC BY 4.0 license (http://creativecommons.org/licenses/by/4.0/).
OPEN ACCESS
This study addresses the pressing and pertinent issue of establishing a space-based monitoring system to track forest condition changes. Utilizing geographic information system technologies and the Normalized Difference Vegetation Index (NDVI), it examines the evolution and dynamics of pine forest regeneration in the Semey Ormany State Forest Natural Reserve (Zhanasemey branch), Kazakhstan. Landsat-5 satellite data were employed to map and identify terrestrial vegetation changes within the Zhanasemey branch. Satellite imagery for June 2007 and September 2008 were specifically utilized for this investigation. Post-acquisition, the satellite images were subjected to corrections, followed by radiometric adjustments to minimize atmospheric interference. Subsequently, NDVI classifications, an established method for plant classification, were applied to each image. The study focused on a 15-year timespan (2008 to 2022) to monitor changes in vegetation intensity, classified according to NDVI, and to track the reforestation process in areas affected by fire. Analysis of the regeneration of the pine forest post the 2008 fire, conducted at five-year intervals, revealed an increase in the restored forest area from 6,773.49 ha in 2013 to 10,721.07 ha in 2018, and finally to 14,742.54 ha in 2022. In 2008, the fire-impacted area with reduced vegetation spanned 7,015.41 ha, while by 2022, the restored area encompassed 14,742.54 ha, indicating a significant enhancement in the pine forest restoration process. The findings underscore the critical role of remote sensing in forest fire modelling and identifying areas at risk, suggesting its potential utility in large-scale monitoring and management efforts. The study demonstrates the feasibility and efficiency of using space-based technologies to monitor long-term changes in forest conditions and to track reforestation dynamics in fire-affected regions.
forest fires, GIS, Normalized Difference Vegetation Index (NDVI), remote sensing, restoration
1.1 Forest fire monitoring: An urgent challenge
Forests, as vital environmental resources, play a significant role in soil and water conservation, climate regulation, habitat creation, and environmental sanitization [1]. Monitoring and mapping of forest lands is necessary to protect and preserve this important natural resource. The issue of timely forest fire detection and mitigation remains a contemporary challenge. Existing monitoring systems, typically reliant on singular or dual monitoring mechanisms, exhibit limited efficacy in safeguarding forest plantations. Therefore, it is necessary to take measures to improve the existing monitoring system.
1.2 Current techniques and limitations
Remote sensing (RS) and geographic information systems (GIS) have emerged as prevalent tools for natural resource analysis and associated planning efforts [2]. Employed across various scientific fields, RS and GIS data provide valuable insights [2]. Efforts to predict forest fire behaviors have been ongoing for some time, with RS and GIS playing pivotal roles globally in studying forest fires and associated risk zones [3-5]. The advantages of these methods include their rapid, non-invasive nature and their ability to offer expansive coverage, thereby surpassing traditional field observations [6-8].
High-resolution satellite imagery, potent software, and GIS are harnessed for computational modeling, driven by the imperative for precise and dependable tools for controlling forest fires. These tools enable the monitoring of resource states, rational resource use, planning, forecasting, and safety assurance. A more sophisticated GIS, combined with multi-criteria decision analysis, has facilitated rapid and effective resolutions to intricate geographical issues [9-11].
Identifying fire-prone areas is crucial, not only because these areas are ignition points, but also because they contribute to fire propagation [9]. Fire risk maps, generated by merging multiple data layers associated with fire triggers, are instrumental in evaluating fire prevention shortfalls. Over the last decade, researchers have utilized vegetation indices, such as the Normalized Difference Vegetation Index (NDVI) and enhanced vegetation index (EVI), for large-scale monitoring of evergreen forests [12-14]. The NDVI, owing to its minimal dependence on soil properties and ease of calculation, has proven to be a preferred method for ecosystem monitoring [15-17].
There are three such indices: simple vegetation indices (SVI), rational vegetation indices (RVI), and NDVI. On a regional scale, seasonal weather conditions and the green effect of logging were the main driving force behind the observed increase in NDVI values [18]. The main source of information is RS data, which is widely used for accurate measurement and monitoring of vast forests.
1.3 Aim of the Study
The Semey Ormany State Forest Natural Reserve (Zhanasemey branch), Kazakhstan, characterized by pine forests and a dry climate, is frequently afflicted with forest fires. In an effort to enhance early fire detection, this study employs GIS technologies.
The objective of this paper is to ascertain alterations in the condition and dynamics of pine forest regeneration in the aforementioned reserve, utilizing GIS and the NDVI as investigative tools.
2.1 Location
The territory for the study was the Zhanasemey branch of the GLPR Semey Ormany. The GLPR Semey Ormany is located in the Beskaragai, Borodulikhinsky, Zharma, Abay, Ayagoz, and Kokpekti districts of the Abay region of Kazakhstan and in the city of Semey.
The research began in the spring of 2021. As part of the work, we conducted a study using the NDVI to determine the condition of the territory of the Zhanasemey branch where the fire had occurred. The study period included June 2007 (before the fire) and September 2008 (after the fire). To determine the process of pine forest restoration for 15 years, studies were conducted every five years, namely in 2013, 2018, and 2022.
2.2 Climate
The climate of the territory is continental due to its remoteness from the oceans and seas. It is characterized by the aridity of the spring and summer, high summer and low winter temperatures, insufficient and unstable precipitation over the years, and strong winds throughout the year. The coldest month is January with an average temperature of -15.1℃. In summer, the average temperature reaches +21.7℃ [19]. The average duration of the heat period is about 180 days, and the frost-free period is about 110 days. The first autumn frosts are observed on September 9-14, and the last spring frosts on May 23-24.
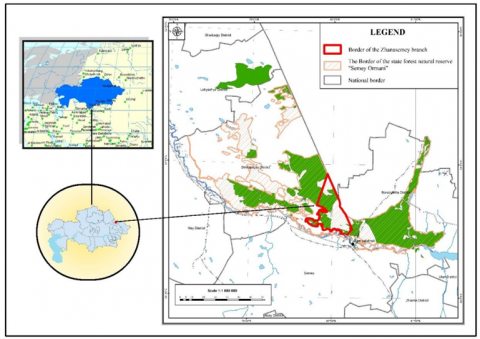
Figure 1. Study area: The RSU GLPR Semey Ormany, geographical location of the Zhanasemey branch (compiled by us in the ArcMap 10.8.2 software)
The Semey forest is located in the north at 79º25`21 east longitude, 51º35`41 north latitude and in the south at 81º21`09 east longitude, 50º29`17 north latitude. The total area is 6,440 km2. The Zhanasemey branch is located in the north 79º56`17 east longitude, 50º56`15 north latitude and in the south 80º9`17 east longitude, 50º27`30 north latitude. The total area is 793 km2. The figure below shows a map of the study area developed in ArcMap 10.8.2 (Figure 1).
2.3 Soil and relief
Large areas of the Irtysh plain are occupied by ribbon forests on soddy pine forest soils and sands. There are significant areas of carbonate-free layered soils in the floodplain of the Irtysh River in the riverbed strip. Carbonate, brackish, and saline soils are common in the central floodplain. Soddy pine forest soils are developed mainly in automorphic conditions and are confined to the tops and upper parts of the slopes of sandy mounds with a depth of groundwater of more than 3 m.
The modern relief in the ribbon forests is complex. Its origin is associated with alluvial and aeolian processes, and the following basic forms are clearly distinguished in the structure of the relief:
-The most complex alluvial-accumulative forms with aeolian surface processing;
-Alluvial-erosive landforms.
In total, Semey Ormany is divided into 10 branches. Table 1 shows the area of land occupied by each branch.
Table 1. Branches of the GLPR Semey Ormany
|
Item Number |
Name of the Branch |
Plains, Ha |
Mountainous Area, Ha |
|
1 |
GLPR Semey Ormany, Begen branch |
76,843 |
24,068 |
|
2 |
GLPR Semey Ormany, Borodulikha branch |
52,767 |
36,752 |
|
3 |
GLPR Semey Ormany, Bokebay branch |
64,541 |
50,993 |
|
4 |
GLPR Semey Ormany, Dolon |
96,796 |
49,908 |
|
5 |
GLPR Semey Ormany, Zhanasemey branch |
77,746 |
31,617 |
|
6 |
GLPR Semey Ormany, Kanonerka branch |
45,931 |
36,129 |
|
7 |
GLPR Semey Ormany, Morozov branch |
30,507 |
15,653 |
|
8 |
GLPR Semey Ormany, Novaya Shulba branch |
46,616 |
36,705 |
|
9 |
GLPR Semey Ormany, Semipalatinsk branch |
103,378 |
69,780 |
|
10 |
GLPR Semey Ormany, Tau-Dala branch |
61,270 |
61,223 |
|
|
TOTAL |
656,395 |
412,828 |
2.4 Object
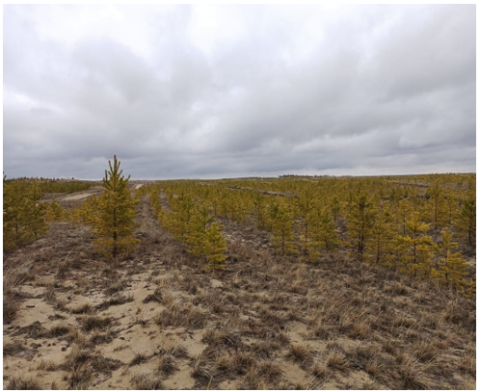
Figure 2. Zhanasemey branch, Akulsky forestry, plantings of 2013
The main type of plant in the Zhanasemey branch was the common pine (Pínus sylvéstris L.). In areas with a drier climate, where forest fires may occur, the bark of pine has a greater thickness, and its volume is much higher. Pine buds are tarred, reddish-brown, elongated-ovate, sharp, their length is 6-12 mm, located at the ends of the shoots in knot clusters. The needles are bluish-green, located spirally on the shoots in bundles of two. The length of the needles of the common pine varies from 2 to 8 cm. Within the crown of one tree, the difference in the length of the needles is 2-3 cm; the greatest length of the needles is found on the shoots of the last 6 years and on the axial shoot. On the northern part of the crown, the length of the needles is less than on the southern one. Pine seeds have a very high germination rate (90%), which, with proper seed storage, persists for 3-6 years. The largest number of them usually grow into a forest stand of II and III age classes. The territory of the Zhanasemey branch, where we conducted the study, is shown in Figure 2.
2.5 Materials
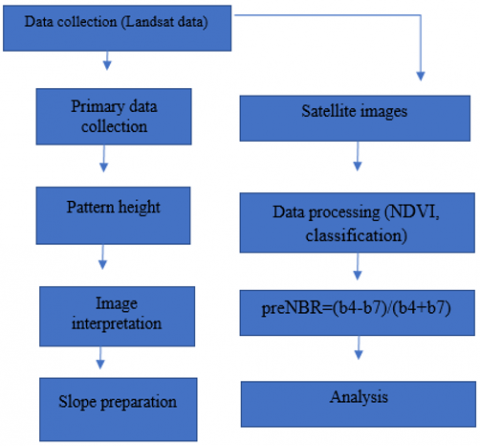
To assess the state of forest vegetation on damaged lands, high-resolution satellite images for the growing season of 2007-2008 were used. Landsat images with a spatial resolution of 30×30 m, covering the Zhanasemey branch, were obtained for 2007 and 2008 using Landsat 5 (TM). These images were obtained from the United States Geological Survey (USGS) website (https://earthexplorer.usgs.gov), as of June 2007 and September 2008. Cloudless Landsat images were selected for data collection to ensure accuracy. If the clouds completely or partially covered the field, the data would be incorrect.
To determine the vegetation condition of the study area, we determined the NDVI, a relative indicator of the amount of photosynthetic active biomass, which is used in modern research in the field of agriculture [1, 6, 17]. The state of vegetation was determined by remote methods based on the NDVI. During the study, we performed processing, decoding, normalization, and calculation of satellite image quality indicators in the ENVI 5.2 and ArcGIS 10.8.1 software. Pretreatment included atmospheric correction using the ENVI software with the FLAASH tool. After performing all corrections on the images, the obtained reflectivity values of channels 3 and 4 were recalculated.
To obtain the NDVI, a series of images from the Landsat 5 spacecraft for the time from June to September 2007-2008 was used in the Zhanasemey branch. To calculate the NDVI, three (near-infrared, NIR) and four (red, RED) channels with a spatial resolution of 30 m2 per pixel were used. This is one of the most common indices for solving various problems of assessing the state of vegetation cover and its dynamics.
The description of the Landsat 5 TM spectral channels used to determine the NDVI is presented in the table below (Table 2).
Table 2. Description of the spectral channels of Landsat 5 TM used to determine the NDVI
|
Landsat 5 Channels |
Spectral Range, Microns |
Spatial Resolution, m2 |
|
Band 3 Red |
0.63-0.69 |
30 m2 |
|
Band 4 NIR |
0.76-0.90 |
30 m2 |
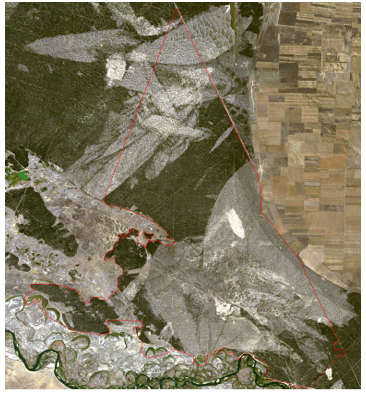
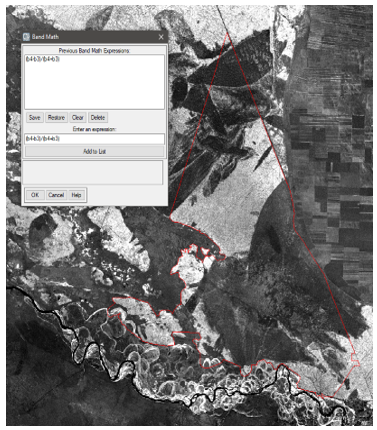
Atmospheric corrections of the obtained images were carried out using the FLAASH tool in the ENVI software. After atmospheric corrections, the process of calculating the NDVI was carried out, using the calculation formula preNBR=(b4-b7)/(b4+b7) and postNbr=(b4-b7)/(b4+b7). The process of work is shown in Figures 3, 4, and 5.
Figure 3. Atmospheric correction of the image (2007)
Figure 4. Atmospheric correction of the image (2008)
Figure 5. The process of the NDVI calculation
The scale of the vegetation density map in the Zhanasemey branch of the GLPR Semey Ormany is 1:200 000.
The ArcGIS free GIS was used to create cartographic material and subsequent spatial analysis. The full scheme of the procedure of the proposed methodology is shown in the figure below (Figure 6).
Figure 6. Block diagram of the methodology [20]
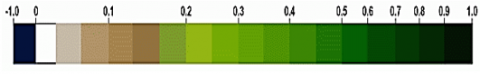
The NDVI allows one to see the difference in the intensity of reflected light in the red and infrared ranges for a certain period of time. For the correct visualization of the NDVI map, a special discrete scale of values is used, the purpose of which is to distinguish between organic and inorganic nature, as well as to determine the density of vegetation. As described earlier, the range of negative numbers tending to 0 are objects of inorganic nature. Positive numbers ranging from 0 to 1 are objects of organic nature [21]. More detailed information about the correspondence of values to object types is shown in Table 3.
Table 3. Correspondence of object types to the NDVI values
|
Item Number |
Object Name |
NDVI Value |
|
1 |
Dense vegetation (forest) |
0.7-1.0 |
|
2 |
Rare plants (shrubs, pastures) |
0.2-0.5 |
|
3 |
Open ground |
0.025-0.2 |
|
4 |
Clouds |
0 |
|
5 |
Snow, ice, sand, rocks |
-0.1-0.1 |
|
6 |
Water |
-0.42-0.33 |
|
7 |
Artificial materials |
-0.5 |
Values from -1 to 0 are assigned to inanimate objects and infrastructure, such as water, rocks, sand, snow, etc. Wildlife objects, such as plants, are characterized by values ranging from 0 to 1 [21].
The closer the value is to one, the denser vegetation prevails in the area. An example of a discrete NDVI scale is shown in Figure 7.
Figure 7. Discrete NDVI scale [21]
After determining the density map before and after the fire of the territory of the RGU GLPR Semey Ormany of the Zhanasemey branch, we used data from the optical satellites Landsat 5, Landsat 7 Enhanced Thematic Mapper (ETM+), and Landsat 8 OLI to study the process of forest restoration for 15 years of the existence of the forest territory, that is, from 2008 to 2023 (Table 4).
Table 4. Data set used for the study
|
Data |
Distance |
Source |
Years |
|
Landsat 5 |
30m |
U.S. Geological Survey |
2008 |
|
Landsat 7 (ETM+) |
30m |
U.S. Geological Survey |
2008 |
|
Landsat 8 OLI |
30m |
U.S. Geological Survey |
2013, 2018, 2022 |
The differenced normalized burn ratio (dNBR) was used to determine the territory where a fire occurred 15 years ago in the Zhanasemy branch. The preNBR was designed to determine the pre-fire condition, and the postNBR to determine the post-fire condition. Formulas for determining the indices:
preNBR $=(b 4-b 7) /(b 4+b 7)$ (1)
postNBR $=(b 4-b 7) /(b 4+b 7)$ (2)
$d N B R=$ preNBR - postNBR (3)
As a result of the study, changes in the state and dynamics of pine forest restoration in the GLPR Semey Ormany (Zhanasemey branch) were identified using a GIS system and the NDVI.
The use of the NDVI was effective for analyzing the state of vegetation in the forest area. As a result of the study, by processing Landsat 5 TM data on the Zhanasemey branch of the GLPR Semey Ormany using aerial photographs for June 2007 and September 2008, a grid coverage density map was formed.
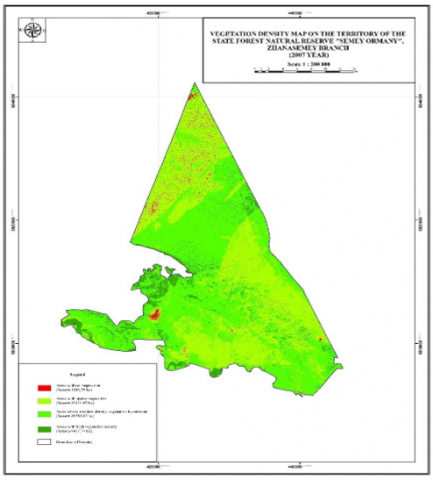
According to the data obtained, the image result for June 2007 showed zones with a high density of vegetation distribution (5,451.75 ha), zones with a medium density of vegetation distribution (39,785.67 ha), zones with sparse vegetation (33,211.62 ha), and zones without vegetation (1,146.78 ha) (Figure 8). Accordingly, the discrete NDVI vegetation scale was an interval from 0.2 to 1, as shown in Table 5.
Table 5. Comparison of object types with the NDVI values
|
Object Type |
NDVI Range |
Reflection Value in the Red Range |
Reflection Value in the Infrared Range |
|
Water, snow, clouds |
-1-0 |
0.02-0.375 |
0.01-0.35 |
|
Open ground |
0-0.2 |
0.25 |
0.3 |
|
Vegetation cover |
0.2-1 |
0.1 |
0.3-0.5 |
Figure 8. Map of vegetation density before the fire in the Zhanasemey branch of the GLPR Semey Ormany (June 2007)
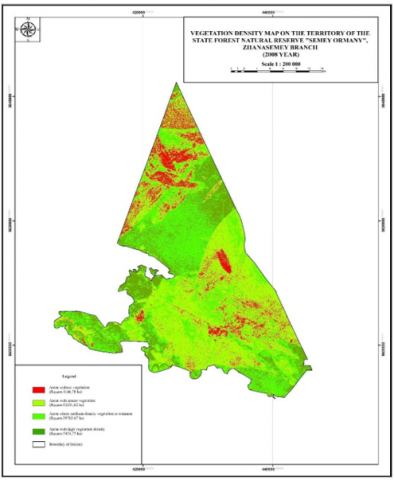
According to the vegetation density map from the image for September 2008 in the Zhanasemey branch of the GLPR Semey Ormany after the fire, zones with high density of vegetation distribution equaled 12,300.57 ha, zones with a medium density of vegetation distribution 24,006.96 ha, zones with sparse vegetation 35,126.1 ha, and zones without vegetation 8,162.19 ha (Figure 9).
Figure 9. Vegetation density map in the Zhanasemey branch of the GLPR Semey Ormany, after the fire (September 2008)
By determining the density map of the pine forest using the NDVI, one can observe changes in vegetation before and after the fire (Figure 10).
Figure 10. Vegetation changes in the Zhanasemey branch before the fire (June 2007) and after the fire (September 2008)
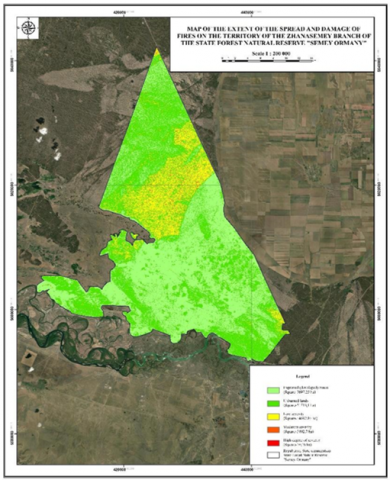
Figure 11. Map of the extent of the spread and damage from wildfire in the Zhanasemey branch (2008)
Figure 11 shows the boundaries and extent of the spread and damage of fires in the Zhanasemey branch; the well-forested territory of the branch accounts for 36,590.58 ha, unaffected land equals 33,398.55 ha, low severity damage is observed in 8,585.01 ha, medium severity damage in 758.7 ha, and high severity damage in 0.09 ha.
Having determined the boundaries of the fire of 2008 in the Zhanasemey branch, we found how the process of restoring vegetation cover in the area had changed over the period of 5, 10, and 15 years, that is, in 2013, 2018, and 2022 (Figures 12-14).
The total area of the 2008 fire in the Zhanasemey branch was 8,585.01 ha in areas with low severity damage, 758.7 ha in areas with medium severity damage, and 0.09 ha in areas with high severity damage.
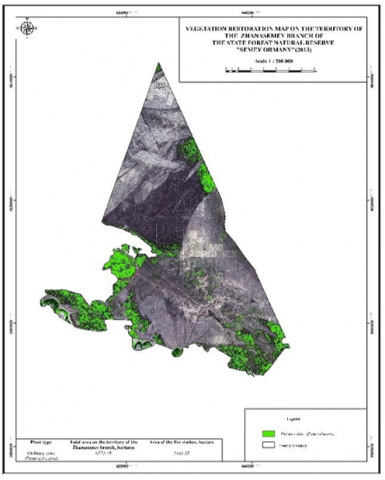
Figure 12. The process of forest restoration in the Zhanasemey branch, ha (2013)
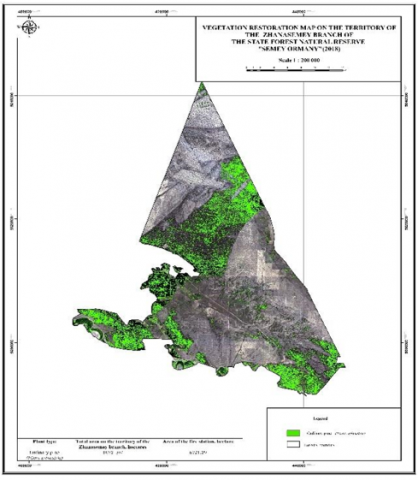
Figure 13. The process of forest restoration in the Zhanasemey branch, ha (2018)
Figure 14. The process of forest restoration in the Zhanasemey branch, ha (2022)
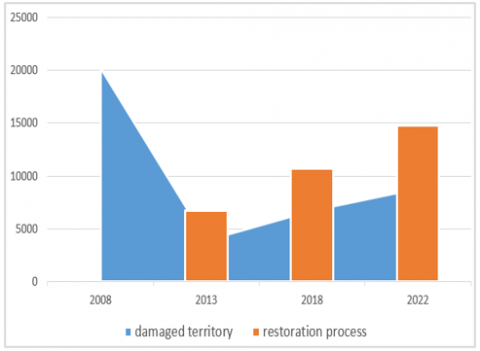
The following shows the process of restoration every 5 years (2008, 2013, 2018, 2022) after the fire in pine forests that occurred 15 years ago (April 2008) (Table 6, Figure 15).
Figure 15. Forest restoration progress in the Zhanasemey Branch: 2008-2022
Table 6. The process of forest restoration in the Zhanasemey branch in 2008-2022
|
Year |
Burnt Area, ha |
Restored Forest Area (Common Pine), ha |
|
2008 |
20,185.83, including: low severity damage: 8,585.0 medium severity damage: 758.7 high severity damage: 0.09 |
- |
|
2013 |
3,883.32 |
6,773.49 |
|
2018 |
6,721.29 |
10,721.07 |
|
2022 |
8,781.21 |
14,742.51 |
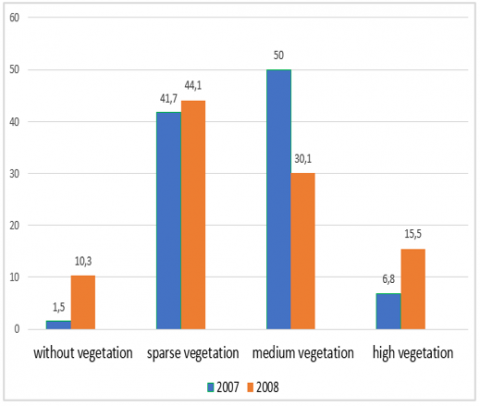
The results of the study showed that RS was an important tool for modeling forest fires and hazardous areas. According to the process of monitoring the state of forests in the Zhanasemey branch of the RGU GLPR Semey Ormany with the help of the dNBR and NDVI technology, vegetation-free zones before the fire in 2007 amounted to 1.5% and after the fire in 2008 to 10.3%. That is, it increased by 7,015.41 ha. Areas with sparse vegetation accounted for 41.7% in 2007 before the fire and 44.1% in 2008 after the fire. Areas with medium vegetation accounted for 50% in 2007 and 30.1% in 2008. Areas with high vegetation showed an increase of 6.8% in 2007 and 15.5% in 2008.
The restoration of the pine forest after the 2008 fire recorded every 5 years, that is, in 2013, amounted to 6,773.49 ha, in 2018, 10,721.07 ha, and in 2022, 14,742.54 ha (Table 6). In 2008, the area of reduced vegetation caused by fires amounted to 7,015.41 ha, and in 2022, the restored area amounted to 14,742.54 ha. That is, the process of restoring the pine forest has increased significantly.
Based on the results obtained, we can draw the following theoretical and practical conclusions. The main available source of information for monitoring the forest fund is data from the RS of the Earth. When carrying out RS work, various methods are used [22]. As one of these methods, we used the NDVI to determine the plant index in our study. With this method, it was easier to determine vegetation density compared to other field studies. As a result of our research, we came to the conclusion that for a qualitative assessment of the vegetation of a particular area, it is recommended to use the NDVI. The undoubted advantage of using this index is its ease of calculation and the feature of using it for processing high, medium, or low-resolution images, provided there are spectral channels in the red and infrared range. With all the advantages, the main disadvantages of using the NDVI are also observed, such as the inability to use data that has not passed the stage of radiometric correction and errors introduced by weather conditions, heavy clouds, and haze.
In our study, we used the dNBR to assess vegetation restoration after damage caused by forest fires, as other researchers have done [23, 24]. Our results confirm that the dNBR provided a better distinction of burnt areas compared to other spectral indices due to the inclusion of a NIR spectral band in its calculation. This spectral band is very effective for recognizing areas affected by forest fires, since chlorophyll strongly reflects sunlight at this wavelength, and sparse/absent vegetation makes the reflection weak/absent. When the region burns out, there is a sharp decrease in the reflection in the NIR range, accompanied by an increase in the reflection in the middle infrared spectrum of most satellites [25].
In the process of restoring the pine forest it is necessary to use GIS technologies, as GIS and RS are currently valuable tools for managing, analyzing, and displaying large volumes of various data related to many local and regional plans.
Using the ENVI 5.2 and ArcGIS 10.8.1 software and data from the optical satellites Landsat 5, Landsat 7 Enhanced Thematic Mapper (ETM+), and Landsat 8 OLI to determine changes in the fire zone of pine forests, observations were made of changes in the vegetation restoration process 5, 10 and 15 years after the fire. Maps of the density of the pine forest and the state of recovery after the fire were compiled using GIS technologies and satellite images.
The focus of our research was limited to the methodology and did not affect the effectiveness of the measures taken to restore pine forests. In further research, we believe that monitoring should be carried out more often so that it is possible to more effectively carry out forest restoration activities using various vegetation indices, for example, GNDVI to study the photosynthetic activity of vegetation cover.
[1] Spadoni, G.L., Cavalli, A., Congedo, L., Munafò, M. (2020). Analysis of Normalized Difference Vegetation Index (NDVI) multi-temporal series for the production of forest cartography. Remote Sensing Applications: Society and Environment, 20: 100419. https://doi.org/10.1016/j.rsase.2020.100419
[2] Ozyavuz, M., Bilgili, B.C., Salici, A. (2015). Determination of vegetation changes with NDVI method. Journal of Environmental Protection and Ecology, 16(1): 264-273.
[3] Bouakkaz, F., Ali, W., Derdour, M. (2021). Forest fire detection using wireless multimedia sensor networks and image compression. Instrumentation Mesure Métrologie, 20(1): 57-63. https://doi.org/10.18280/i2m.200108
[4] Podawca, K., Pawłat-Zawrzykraj, A. (2021). Spatial variability of forest fires in the Polish voivodeships in the period of 2009-2018. Journal of Ecological Engineering, 22(3): 266-274. https://doi.org/10.12911/22998993/132433
[5] Fadjarajani, S., Zid, M., Ahmad Shaari, M.Z.B., Meylani, V. (2023). Urban spatial management strategy: Transforming slums into tourist attractions in Bantarsari Bungursari Village, Tasikmalaya District. International Journal of Sustainable Development and Planning, 18(11): 3459-3465. https://doi.org/10.18280/ijsdp.181111
[6] Laiskhanov, S.U., Poshanov, M.N., Smanov, Z.M., Karmenova, N.N., Tleubergenova, K.A., Ashimov, T.A. (2021). A study of the processes of desertification at the modern delta of the Ili River with the application of remote sensing data. Journal of Ecological Engineering, 22(3): 169-178. https://doi.org/10.12911/22998993/132546
[7] Baibussenov, K., Bekbayeva, A., Azhbenov, V. (2022). Simulation of favorable habitats for non-gregarious locust pests in North Kazakhstan based on satellite data for preventive measures. Journal of Ecological Engineering, 23(7): 299-311. https://doi.org/10.12911/22998993/150043
[8] Yesmagulova, B.Z., Assetova, A.Y., Tassanova, Z.B., Zhildikbaeva, A.N., Molzhigitova, D.K. (2023). Determination of the degradation degree of pasture lands in the West Kazakhstan region based on monitoring using geoinformation technologies. Journal of Ecological Engineering, 24(1): 179-187. https://doi.org/10.12911/22998993/155167
[9] Erten, E., Kurgun, V., Musaoglu, N. (2004). Forest fire risk zone mapping from satellite imagery and GIS: A case study. In Congress of the International Society for Photogrammetry and Remote Sensing, Istanbul, Turkey, pp. 222-230. https://www.isprs.org/proceedings/xxxv/congress/yf/papers/927.pdf.
[10] Carmel, Y., Paz, S., Jahashan, F., Shoshany, M. (2009). Assessing fire risk using Monte Carlo simulations of fire spread. Forest Ecology and Management, 257(1): 370-377. https://doi.org/10.1016/j.foreco.2008.09.039
[11] Kumari, B., Pandey, A.C. (2020). Geo-informatics based multi-criteria decision analysis (MCDA) through analytic hierarchy process (AHP) for forest fire risk mapping in Palamau Tiger Reserve, Jharkhand state, India. Journal of Earth System Science, 129(1): 204. https://doi.org/10.1007/s12040-020-01461-6
[12] Xiao, X., Boles, S., Liu, J., Zhuang, D., Frolking, S., Li, C., Salas, W., Iii, B.M. (2005). Mapping paddy rice agriculture in southern china using multi-temporal modis images. Remote Sensing of Environment, 95(4): 480-492. https://doi.org/10.1016/j.rse.2004.12.009
[13] Qin, Y., Xiao, X., Dong, J., Zhang, G., Roy, P.S., Joshi, P.K., Gilani, H., Murthy, M.S.R., Jin, C., Wang, J., Zhang, Y., Chen, B., Menarguez, M.A., Biradar, C.M., Bajgain, R., Li, X., Dai, S., Hou, Y., Xin, F., Moore, B. (2016). Mapping forests in monsoon asia with alos palsar 50-m mosaic images and modis imagery in 2010. Scientific Reports, 6: 20880. https://doi.org/10.1038/srep20880
[14] Kou, W., Liang, C., Wei, L., Hernandez, A.J., Yang, X. (2017). Phenology-based method for mapping tropical evergreen forests by integrating of MODIS and Landsat Imagery. Forests, 8(2): 34. https://doi.org/10.3390/f8020034
[15] Xiao, X., Boles, S., Liu, J., Zhuang, D., Liu, M. (2002). Characterization of forest types in Northeastern China, using multi-temporal SPOT-4 VEGETATION sensor data. Remote Sensing of Environment, 82(2-3): 335-348. https://doi.org/10.1016/S0034-4257(02)00051-2
[16] Mohammed, A.A., Khamees, H.T. (2021). Categorizing and measurement satellite image processing of fire in the forest Greece using remote sensing. Indonesian Journal of Electrical Engineering and Computer Science, 21(2): 846-853. https://doi.org/10.11591/ijeecs.v21.i2.pp846-853
[17] Essaadia, A., Abdellah, A., Ahmed, A., Abdelouahed, F., Kamal, E. (2022). The Normalized Difference Vegetation Index (NDVI) of the Zat valley, Marrakech: Comparison and dynamics. Heliyon, 8(12): e12204. https://doi.org/10.1016/j.heliyon.2022.e12204
[18] Morawaitz, D.F., Blewett, T.M., Cohen, A., Alberti, M. (2006). Using NDVI to assess vegetation land cover change in Central Puget Sound. Environmental monitoring and Assessment, 114(1-3): 85-106. https://doi.org/10.1007/s10661-006-1679-z
[19] Makhanova, N., Berdenov, Z., Wendt, J.A., Sarsekova, D., Mursalimova, E., Sansyzbayeva, A., Nurtazina, N., Safarov, R. (2022). Biogeographic potential of the North Kazakh Plain in the perspective of health tourism development. GeoJournal of Tourism and Geosites, 40(1): 253-258. https://doi.org/10.30892/gtg.40130-826
[20] Gandhi, G.M., Parthiban, S., Thummalu, N., Christy, A. (2015). Ndvi: Vegetation change detection using remote sensing and gis – A case study of Vellore District. Procedia Computer Science, 57: 1199-1210. https://doi.org/10.1016/j.procs.2015.07.415
[21] Savchenko, Y.Y., Goleva, O.G., Korchagina, I.A., Lobanova, Y.S., Borzhikov, T.S. (2020). GIS approaches to creating maps based on vegetation indices for forest management. IOP Conference Series: Materials Science and Engineering, 828: 012021. https://doi.org/10.1088/1757-899X/828/1/012021
[22] Kaldybayev, S., Bekmukhamedov, N., Smailov, K., Еrzhanova, K., Abdirahymov, N. (2020). Satellite-based monitoring of territory using vegetation indices and their correlation with ground data. Journal of Theoretical and Applied Information Technology, 98(24): 4158-4168. http://www.jatit.org/volumes/Vol98No24/17Vol98No24.pdf.
[23] Brown, A.R., Petropoulos, G.P., Ferentinos, K.P. (2018). Appraisal of the Sentinel-1 & 2 use in a large-scale wildfire assessment: A case study from Portugal's fires of 2017. Applied Geography, 100: 78-89. https://doi.org/10.1016/j.apgeog.2018.10.004
[24] Nasery, S., Kalkan, K. (2020). Burn area detection and burn severity assessment using Sentinel 2 MSI data: The case of Karabağlar district, İzmir/Turkey. Turkish Journal of Geosciences, 1(2): 72-77. https://dergipark.org.tr/en/pub/turkgeo/issue/56822/770803.
[25] Atak, B.K., Tonyaloğlu, E.E. (2020). Evaluating spectral indices for estimating burned areas in the case of Izmir/Turkey. Eurasian Journal of Forest Science, 8(1): 49-59. https://doi.org/10.31195/ejejfs.657253