Ni Made Trigunasih*![]() | I Wayan Narka
| I Wayan Narka![]() | Moh Saifulloh
| Moh Saifulloh![]()
© 2023 IIETA. This article is published by IIETA and is licensed under the CC BY 4.0 license (http://creativecommons.org/licenses/by/4.0/).
OPEN ACCESS
Soil fertility plays a pivotal role in agricultural productivity, with its status largely determined by essential nutrients, including cation exchange capacity, base saturation, phosphorus, potassium, and soil organic matter. Insufficient nutrient supply often results in suboptimal agricultural productivity, particularly in agrarian nations. This study aimed to address this challenge by quantifying soil properties and fertility, with a case study from the Unda watershed in Bali Province, Indonesia. The objective was to analyze the soil's chemical properties to provide a foundation for assessing soil fertility status. The adopted methodology integrated spatial analysis with Geographic Information Systems (GIS), coupled with field-based soil surveys and laboratory analysis of soil samples. The findings revealed a range of soil fertility statuses within the Unda watershed, classified as low, medium, and high. A common limiting factor identified across these statuses was the low content of soil organic matter. To address this deficiency, it is recommended that balanced, location-specific fertilization strategies be implemented on agricultural land. Such an approach could ensure the effective and efficient availability of soil nutrients, thereby potentially enhancing agricultural productivity.
soil fertility, soil chemical, watershed, agriculture land management, spatial analyst
Soil fertility is a critical determinant of agricultural productivity [1-3], and its maintenance is a priority for countries whose economies are predominantly reliant on agriculture, such as Indonesia [4, 5]. Indonesia, a global rice producer, depends heavily on its agricultural sector for livelihood and sustenance [6, 7]. While the country also cultivates a variety of plantation and horticultural commodities, these activities often face challenges related to fertilization [8, 9].
Fertilizer is a principal production factor alongside land, labor, and capital, and plays a crucial role in enhancing agricultural yields [8, 9]. Fertilization supplements soil with nutrients to boost or maintain soil fertility. However, excessive fertilizer use can diminish fertilization efficacy and environmental quality. Thus, location-specific balanced fertilization, which ensures appropriate dosage, timing, and type of fertilizer based on soil fertility status, is vital for efficient agricultural production.
Agricultural land use frequently encounters issues such as soil acidity, nutrient availability, and low soil organic matter content. These problems are compounded by the limited application of organic fertilizers and the rapid natural decrease of soil organic matter content in the tropics, which can reach 30-60% within ten years [10]. Further, the excessive and inappropriate use of fertilizers or chemicals to increase production can lead to soil degradation, including a decrease in soil fertility [11-14].
Soil fertility, defined as the soil's ability to provide essential nutrients for plant growth, influences the productivity of agricultural commodities [15, 16]. Soil testing, which evaluates soil fertility status based on parameters such as cation exchange capacity (CEC), base saturation, phosphorus, potassium, and soil organic matter, is crucial to implement site-specific balanced fertilization [17-19]. Previous studies have primarily focused on small-scale soil chemical properties and fertility measurements [3, 20, 21], which may not be representative of larger agricultural areas.
Measuring soil chemical properties over expansive areas presents several challenges, including the need for a large number of samples, high laboratory analysis costs, potential non-representative results, and inefficiency [3, 20, 21]. The integration of Geographic Information Systems (GIS) can enhance the efficiency and effectiveness of soil property measurement. Prior to field soil sampling, base maps can be utilized to estimate the number of samples required and facilitate the determination of soil sample coordinates. This approach allows the integration of field data and laboratory soil analysis results into a single geospatial database, providing both attribute and spatial location information.
This study focuses on the Unda watershed in Bali Province, an area characterized by complex agricultural activities and varied biophysical and hydrological conditions that greatly influence soil fertility. The aim is to analyze the soil's chemical properties, measure soil fertility status, and map its spatial distribution within the Unda watershed.
2.1 Research site
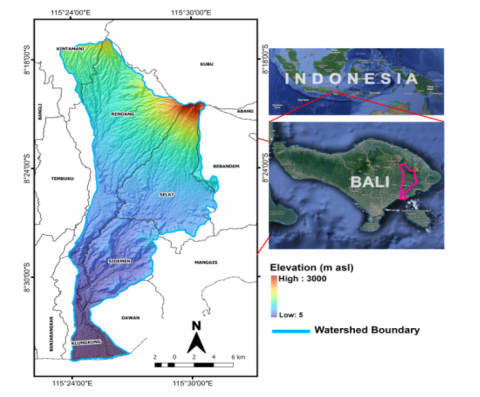
The research was carried out in the Unda watershed of Bali Province, geographically located at 115°24'00"-8°16'00" in the north and 115°30'00"-8°30'00" in the south (Figure 1). The Unda watershed has the characteristics of an area with gentle to very steep slopes, with elevations ranging from 5-3000m above sea level. The Unda watershed has an area of 238.47km2 administratively located in Klungkung, Dawan, Sidemen, Selat, Rendang, and Kintamani Districts. Based on the Oldemen climate classification, the Unda watershed has B, C, and D climate types. The Oldemen climate type represents the division of the consecutive wet months that occur in a year. Climate type D is found in the Unda watershed’s downstream area, so it correlates with water availability and soil fertility conditions. Climate Type B has the characteristic of having 7-9 consecutive wet months, Climate Type C has 5-6 consecutive wet months, and Climate Type D has 3-4 consecutive wet months.
2.2 Land unit mapping
In this preliminary study, we only utilized three variables for the mapping units (the basis for soil sampling in the field). We did not incorporate dynamic environmental variables such as temperature variations, rainfall patterns, humidity levels, and other related factors. These parameters tend to fluctuate on a monthly basis and are closely linked to atmospheric conditions. On the other hand, soil type and slope are land resource variables that undergo changes over hundreds of years. Soil type represents the geological and geomorphological conditions of a region, forming the basis for land formation. Therefore, the spatial information obtained at present can still be utilized as a guideline for future agricultural land management. The thematic maps used to determine the mapping units map of slope gradient (Figure 2a), soil type (Figure 2b), and land use (Figure 2c). Spatial analysis was performed with ArcGIS 10.8 software, which resulted in a total of 28 units. We used those 28 units to take soil samples in the field (Figure 2d and Table 1).
Figure 1. Research location
Figure 2. Spatial distribution of thematic maps: (a) slopes, (b) soil types, (c) land use and (d) unit mapping
The slope data is derived from the generalization of the SRTM DEM with a spatial resolution of 30m. The slopes in the Unda watershed are dominated by the 8-15% class, followed by other classes successively, namely 25-40%, 0-8%, and > 40%. Soil type comes from secondary data on a regional scale for the Province of Bali, namely 1:250,000. The dominant soil type in the study area is regosol. Specifically, it is divided into five successively: gray regosol, gray-brown regosol, humus regosol, and yellowish-brown regosol. Forests and shrubs dominate land use in the upstream area. The middle area is mixed gardens and fields, while the downstream area is paddy fields.
Each unit is assumed to have the same biophysical conditions and land characteristics as the basis for soil sampling. Recent studies have used the mapping unit as a guide for surveying land characteristics and taking soil samples in the field [22-25]. Land characteristics play a crucial role in determining the agricultural potential of an area. To make informed decisions about land suitability, it is necessary to integrate the information obtained from soil analysis, slope evaluation, and land use assessment. By considering these parameters collectively, farmers and land managers can identify areas with favorable soil conditions, suitable slopes, and compatible land uses for optimal agricultural productivity. This integration allows for more sustainable land management practices, improved resource allocation, and enhanced agricultural sustainability.
Each land unit has distinct spatial information compared to other land units. This difference is influenced by soil type, slope, and land use. For example, within land units of the same soil type (Table 1), differentiates them because there is a differentiating factor, which is the slope gradient. Areas with the same slope and soil type but different units are separated by land use types. For example, the upstream part of the watershed, in unit 2, is composed of a 25-40% slope, gray regosol soil type, and forest land use with a spatial distribution of 30.78 km2. We provide an example of the central part of the watershed in unit 13 with a slope of 8-15%, gray regosol soil type, and mixed garden land use with an area of 9.41 km2. In the downstream area, there are 13 units with yellowish brown regosol soil type, a slope of 0-8%, and the use of paddy fields of 5.84 km2.
Table 1. Unit mapping data in Unda watershed
|
Unit |
Soil Types |
Slopes |
Land Use |
Area (km2) |
Area (%) |
|
1 |
Humus regosol |
15-25% |
Forest |
18.76 |
8.04 |
|
2 |
Gray resol |
25-40% |
Forest |
30.78 |
13.19 |
|
3 |
Yellowish brown regosol |
8-15% |
Dryland farming |
1.51 |
0.65 |
|
4 |
Humus regosol |
15-25% |
Dryland farming |
6.70 |
2.87 |
|
5 |
Humus regosol |
8-15% |
Dryland farming |
2.57 |
1.10 |
|
6 |
Gray regosol |
15-25% |
Dryland farming |
14.96 |
6.41 |
|
7 |
Gray regosol |
25-40% |
Dryland farming |
1.52 |
0.65 |
|
8 |
Gray regosol |
8-15% |
Dryland farming |
8.72 |
3.74 |
|
9 |
Reddish brown latosol and litosol |
15-25% |
Dryland farming |
1.23 |
0.53 |
|
10 |
Reddish brown latosol and litosol |
25-40% |
Dryland farming |
1.66 |
0.71 |
|
11 |
Yellowish brown regosol |
25-40% |
Mixed dryland/plantation |
4.84 |
2.07 |
|
12 |
Yellowish brown regosol |
8-15% |
Mixed dryland/plantation |
9.76 |
4.18 |
|
13 |
Gray regosol |
8-15% |
Mixed dryland/plantation |
9.40 |
4.03 |
|
14 |
Gray regosol |
15-25% |
Mixed dryland/plantation |
6.77 |
2.90 |
|
15 |
Gray regosol |
8-15% |
Mixed dryland/plantation |
12.79 |
5.48 |
|
16 |
Reddish brown latosol and litosol |
25-40% |
Mixed dryland/plantation |
10.13 |
4.34 |
|
17 |
Reddish brown latosol and litosol |
8-15% |
Mixed dryland/plantation |
9.63 |
4.13 |
|
18 |
Gray brown regosol |
0-8% |
Ricefield |
1.40 |
0.60 |
|
19 |
Yellowish brown regosol |
0-8% |
Ricefield |
5.84 |
2.50 |
|
20 |
Yellowish brown regosol |
25-40% |
Ricefield |
1.84 |
0.79 |
|
21 |
Yellowish brown regosol |
8-15% |
Ricefield |
6.90 |
2.96 |
|
22 |
Gray regosol |
0-8% |
Ricefield |
2.13 |
0.91 |
|
23 |
Gray regosol |
8-15% |
Ricefield |
16.24 |
6.96 |
|
24 |
Reddish brown latosol and litosol |
0-8% |
Ricefield |
1.64 |
0.70 |
|
25 |
Reddish brown latosol and litosol |
8-15% |
Ricefield |
3.63 |
1.56 |
|
26 |
Humus regosol |
15-25% |
Shrubs |
3.46 |
1.48 |
|
27 |
Gray regosol |
8-15% |
Shrubs |
1.61 |
0.69 |
|
28 |
Reddish brown latosol and litosol |
25-40% |
Shrubs |
1.28 |
0.55 |
|
Other |
Yellowish brown regosol |
25-40% |
Settlement |
30.39 |
13.02 |
|
Yellowish brown regosol |
25-40% |
Water body |
3.27 |
1.40 |
|
|
Gray regosol |
>40% |
Bare land |
2.02 |
0.87 |
2.3 Field survey
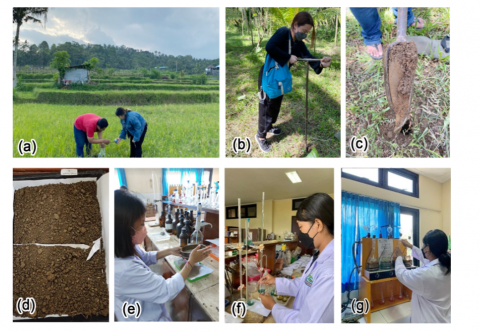
Collecting data in the field was carried out in 28 locations from mapping units that had been analyzed previously. The field survey was carried out on 29-31 May 2022 in the Unda watershed area. The equipment used includes a belgi drill and a GPS Montana type 680. Field survey work can be seen in Figure 3a. Soil sampling was carried out in a composite manner at each observation unit. Composite soil samples are a mixture of several individual or combined soil samples from one soil sampling area. Soil samples were taken at a depth of 0-30cm using a belgi drill (Figure 3b). The results of the soil at that depth can be seen in Figure 3d. The soil sample that has been taken is then brought to the laboratory for soil testing. At the field survey stage, field conditions were observed based on a map of the research location. Interviews with farmers who know land use and land management were carried out so that these data could be collected and adapted to the secondary data obtained.
2.4 Laboratory analyst
Before the soil samples were analyzed in the laboratory, we wind-dried the soil samples for two weeks (Figure 3d). We did this in order to reduce the water content in the soil, thereby facilitating the process of detecting chemicals contained in soil samples. Furthermore, the soil sample was sieved using granulometric equipment with a 0.5mm sieve size (Figure 3c). Work in the laboratory using chemicals as reagents for soil analysis carried out at the Laboratory of Soil and Environmental Sciences, Faculty of Agriculture, Udayana University. The materials used for analysis in the laboratory include 25% HCl, NH4OAc pH 7 1N, 80% alcohol, 50% NaOH, concentrated H2SO4, liquid paraffin, concentrated H3PO4, K2Cr2O7, 1N FeSO4, DPA, Whatman 42 filter paper, indicator methyl red and distilled water.
Laboratory equipment includes an oven, pH meter, erlenmeyer, pipette, burette, Kjeldahl flask, and Kjeldahl distiller device. One example of laboratory activities is the titration of chemical solutions (Figure 3d) and the distillation of soil CEC (Figure 3e). Laboratory work to collect parameters for soil chemical properties following the guidelines in Table 2. Evaluation of the accuracy status is determined based on the chemical properties of the soil matched with the criteria of soil fertility status of the Center for Soil Research in Indonesia. The concept of this method is to combine the parameters of the chemical properties of the soil, so that the status of soil fertility is obtained. Recent research uses this method to measure the fertility of paddy soil [25, 26].
Table 2. Laboratory method for soil chemical analyst
|
No. |
Parameters |
Method |
|
1 |
Cation exchange capacity (CEC) |
Determined by saturating with 1 N ammonium acetate pH 7.0 (standard) |
|
2 |
Base saturation |
Calculated based on the number of bases divided by CEC multiplied by 100 |
|
3 |
Total phosphorus (P2O5) |
Total phosphate (mg/100g) was determined using 25% HCl extraction |
|
4 |
Total potassium (K2O) |
Total potassium was determined using 25% HCl extraction |
|
5 |
Organic carbon (C org) |
Determined using wet digestion using potassium chromate and sulfuric acid according to the walkley and black method [27] |
Figure 3. The work of collecting data in the field (a, b, c) and in the soil laboratory (d, e, f, g)
Based on the criteria for assessing soil fertility status and the results of soil analysis in the laboratory on the parameters of cation exchange capacity (CEC), base saturation, C-organic, P-total and K-total, the status of soil fertility in the Unda watershed was obtained. The status of soil fertility in each mapping unit in the Unda watershed is presented in Table 3.
3.1 Cation exchange capacity (CEC)
Cation exchange capacity is one of the determining indicators of soil fertility status that can exchange cations in soil colloids. Soil CEC is the amount of negative charge in the soil, originating from the surface of inorganic colloids (clay) and organic colloids (humus), which are a place for the exchange of cations [21, 28]. Besides that, CEC is also closely related to the availability of nutrients for plants and as an indicator of soil fertility. Soils with high CEC can trap and provide nutrients better than soils with low CEC. The CEC value indicates that the CEC is classified as moderate, namely 23.55 me/100g to very high, 50.15 me/100g. The lowest CEC value is found in Unit 15, and this is because this location is classified as gray regosol soil. This soil type has poor physical properties such as crumbly structure, high porosity, low water holding capacity, and low C-organic content. This is due to the low organic acids produced, affecting the soil’s CEC content. This is supported by the low C-organic and clay content, so the CEC is also low.
3.2 Base saturation
Base saturation is the ratio between the number of base cations and the sum of all cations (acids and bases) present in the soil adsorption complex. These basic cations include: Ca2+, Mg2+, K+, Na+, and acidic cations, namely H+ and Al3+ [29]. Soils with low base saturation content mean that soils with more soil adsorption complexes are filled with acid cations. Alkaline cations are generally the nutrients needed for plant growth and development [30]. Based on data from the chemical analysis of soil samples at the study site, the base saturation values are low to very high. The lowest base saturation value is 21.78%, and the highest is 97.30% (Table 4). The lowest base saturation value is found in Unit 15, and the highest base saturation value is found in Unit 4. Soils with low base saturation are soils with more soil adsorption complexes filled with acidic cation Al3+ and H+.
Besides that, the low base saturation is caused by the parent material of the soil in the research location, including the regosol soil type. The high base saturation value in Unit 4 was due to the high CEC at the study site and the moderate C-organic content, thus affecting the high Base Saturation value because many base cations were adsorbed on soil colloids and were not easily leached. Recent studies [31, 32] found that CEC reflects the soil’s ability to exchange cations or provide nutrients for plants and the percentage of base saturation. The higher the two soil chemical properties, the better the soil fertility level. The high content of base saturation in soil indicates the availability of sufficient base cations for plant needs in terms of soil nutrients.
Table 3. Results of soil chemical analysis in the laboratory and measurement of soil fertility status
|
Unit |
CEC |
Base Saturation |
C-Organic |
P-Total |
K-Total |
Soil Fertility Status |
|
(me/100g) |
(%) |
(%) |
(me/100g) |
(me/100g) |
||
|
1 |
36.82(H) |
96.92(VH) |
3.21(H) |
16.00(L) |
10.71(L) |
M |
|
2 |
31.06(H) |
96.73(VH) |
0.40(VL) |
10.37(L) |
6.62(VL) |
L |
|
3 |
47.05(VH) |
90.83(VH) |
2.44(M) |
31.27(M) |
20.39(M) |
H |
|
4 |
35.87(H) |
97.30(VH) |
2.82(M) |
41.68(H) |
7.23(VL) |
M |
|
5 |
40.00(H) |
48.49(M) |
2.01(M) |
25.99(M) |
7.73(VL) |
M |
|
6 |
34.88(H) |
89.41(VH) |
2.00(M) |
29.68(M) |
12.46(L) |
M |
|
7 |
35.44(H) |
78.11(VH) |
1.23(L) |
25.72(M) |
6.73(VL) |
L |
|
8 |
38.04(H) |
71.85(VH) |
1.59(L) |
38.81(M) |
7.03(VL) |
L |
|
9 |
25.48(H) |
90.00(VH) |
3.35(H) |
11.27(L) |
22.76(M) |
M |
|
10 |
31.67(H) |
84.35(VH) |
3.45(H) |
10.79(L) |
10.81(L) |
M |
|
11 |
28.72(H) |
78.20(VH) |
1.26(L) |
20.53(M) |
14.88(L) |
L |
|
12 |
42.01(VH) |
84.66(VH) |
2.60(M) |
19.01(L) |
9.95(VL) |
L |
|
13 |
47.08(VH) |
58.41(H) |
2.84(M) |
77.04(VH) |
24.10(M) |
H |
|
14 |
44.19(VH) |
80.00(VH) |
2.46(M) |
41.18(H) |
10.03(L) |
M |
|
15 |
23.55(M) |
21.78(L) |
1.64(L) |
34.47(M) |
8.84(VL) |
L |
|
16 |
34.44(H) |
83.95(VH) |
2.07(M) |
28.30(M) |
48.05(H) |
H |
|
17 |
39.60(H) |
62.83(H) |
1.62(L) |
25.22(M) |
30.50(M) |
M |
|
18 |
50.15(VH) |
53.78(H) |
2.05(M) |
20.25(M) |
23.12(M) |
H |
|
19 |
47.37(VH) |
46.22(M) |
2.05(M) |
10.33(L) |
15.07(L) |
L |
|
20 |
32.04(H) |
95.24(VH) |
2.97(M) |
3.17(VL) |
10.81(L) |
L |
|
21 |
28.13(H) |
60.15(H) |
2.47(M) |
16.20(L) |
22.92(M) |
M |
|
22 |
33.56(H) |
82.0(VH) |
2.10(M) |
19.28(L) |
20.82(M) |
M |
|
23 |
41.68(VH) |
64.00(H) |
2.84(M) |
12.52(L) |
8.18(VL) |
L |
|
24 |
28.86(H) |
91.85(VH) |
2.50(M) |
43.76(H) |
22.44(M) |
H |
|
25 |
29.81(H) |
81.16(VH) |
1.26(L) |
29.95(M) |
22.51(M) |
M |
|
26 |
38.22(H) |
36.56(M) |
3.60(H) |
22.53(L) |
6.31(VL) |
L |
|
27 |
23.99(M) |
50.00(M) |
1.25(L) |
51.06(H) |
6.90(VL) |
L |
|
28 |
46.53(VH) |
85.85(VH) |
2.90(M) |
27.86(M) |
29.29(M) |
H |
Note: very low (VL); low (L); moderate (M); high (H); very high (VH).
Table 4. Soil chemical properties assessment criteria
|
Soil Chemical |
Very Low |
Low |
Moderate |
High |
Very High |
|
CEC (me/100g) |
<5 |
5-15 |
17-24 |
25-40 |
>40 |
|
Base saturation (%) |
<20 |
20-35 |
36-50 |
51-70 |
>70 |
|
P2O5 (HCl 25%) (mg/100g) |
<10 |
10-20 |
21-40 |
41-60 |
>60 |
|
K2O (HCl 25%) (mg/100g) |
<10 |
10-20 |
21-40 |
41-60 |
>60 |
|
C-organic (%) |
<1.00 |
1.00-2.00 |
2.01-3.00 |
3.01-5.00 |
>5.00 |
3.3 C-organic
C-organic soil is part of soil organic matter, which is essential in determining soil’s physical, chemical, and biological properties [33]. Land with dominant sand texture generally has low productivity. The low productivity of sandy land is caused by limiting factors such as the low ability to hold and store water, high infiltration, and evaporation, very low fertility and organic matter, and water use efficiency [34-37]. C-organic soil at the study site is included in the very low criteria, namely 0.40% too high, 3.60%. The lowest C-organic value was found in Unit 2, and the highest C-organic was found in Unit 26. The C-organic content of the soil was relatively low at the study site because the research location was in a hilly and undulating topography with a slope of 25-40% (steep-very steep).
Land with steep to very steep slopes generally have tremendous erosion [38-40], which causes the drift of nutrients and organic matter carried by erosion and surface runoff so that the C-organic content of the soil becomes low [41, 42]. Besides that, the research location has a type of gray regosol soil that is sensitive to erosion because it has unfavorable physical properties, such as the dominant texture of sand. The soil is porous and has low water-holding capacity and high evaporation, thus accelerating the drying and oxidation of organic matter. Agricultural activities influenced the high C-organic content in Unit 26 by returning crop residues to the soil. Adding organic matter to the soil will add nutrients that plants can utilize. Therefore, the organic matter content in the soil at the study site increased with increasing post-harvest time due to the increasingly active process of decomposition of crop residues both above and below the soil surface. Tisdall and Oades [33] state that the soil organic matter is fundamental to maintaining soil productivity in a sustainable manner.
3.4 Phosphorus
Phosphorus is the second macronutrient after nitrogen needed by plants. This element is essential in the process of cell division, formation of fat, albumin, root development, and formation of fruit and seeds. The physical and chemical properties of the soil determine the availability of phosphate in the soil. Plants in the form of primary and secondary orthophosphate ions absorb phosphorus (H2PO4- and HPO42-) [20, 43, 44]. Phosphorus values are classified as very low to very high. The lowest Phosphorus-Total content was found in Unit 19 of 3.17 me/100g. The low phosphorus content at the study site was caused by the influence of the yellowish-brown regosol soil dominated by sand texture. If it rains, the nutrients will be easily washed away and carried away by erosion. The high content of P-total in the study area, based on interviews with farmers at the study sites, indicated that farmers always use SP36 fertilizer to fertilize their plants. This causes the P-Total content in the soil to be high. Soil P levels are classified as very high due to residual effects due to the continuous use of Phosphate fertilizer (SP 36), so many P elements are still present in the soil but cannot be fully utilized by plants. Soil P-Total content, which is relatively high, especially in paddy fields, can be reused by dry land plants after rice plants. Therefore, when cultivating dry land crops after rice, there is no need to apply P fertilization. Regosol soil has a neutral pH, but from a chemical aspect, it is relatively poor in nutrients. This is because the soil colloids and nutrients are easily lost through leaching. Generally, this soil has a sandy texture, loose structure, low water holding capacity, and nutrients.
3.5 Potassium
Potassium is absorbed by plants, usually in the form of soluble K (K+). The availability of Potassium for plants depends on aspects of soil, plants, and climate variables [45-47]. Soil aspects include the amount and type of clay minerals, CEC, soil buffering capacity against K, moisture, temperature, aeration, and soil pH. The availability of K in the soil depends on the processes and dynamics of Potassium in the soil, especially the adsorption and release processes. Suppose the concentration of nutrients in the soil solution increases (for example, due to the application of fertilizers). In that case, the nutrients are immediately absorbed by the soil into a form that is not available (temporarily). This process is referred to as adsorption.
On the other hand, if the concentration in the soil solution drops (e.g., due to nutrients being absorbed by plants or being washed away), the absorbed nutrients are immediately released into the solution so that they can be absorbed by plants (desorption). The soil analysis results in the laboratory showed that the K-Total content of the soil at the study site was classified as very low (6.31 me/100g) to high (48.05 me/100g). The lowest K-total content was in Unit 26, and the highest total K-value was in Unit 16. The K-total content was very low at the study site because farmers rarely used KCl fertilizer to fertilize their crops. The high value of K-Total at the research location was caused by several factors. Namely, the CEC was classified as high, the base saturation was classified as very high. The CEC value can affect the soil solution to release Potassium slowly and reduce the potential for Potassium leaching in the soil. If the CEC value is high, then the amount of K+ base cations adsorbed on the soil colloid is high. Conversely, if the CEC value is low, the K+ base cations adsorbed on the soil colloid are small.
3.6 Soil fertility status
Soil fertility evaluation is the process of diagnosing nutrient problems in the soil and making fertilization recommendations [48, 49]. One way that is often used in assessing the fertility of the soil is through an approach to soil analysis or soil testing. Determination of soil fertility status is carried out through two stages; namely, the first stage begins with an assessment of the measurement of each soil fertility parameter, including CEC, base saturation, P-total, K-total, and C-organic.
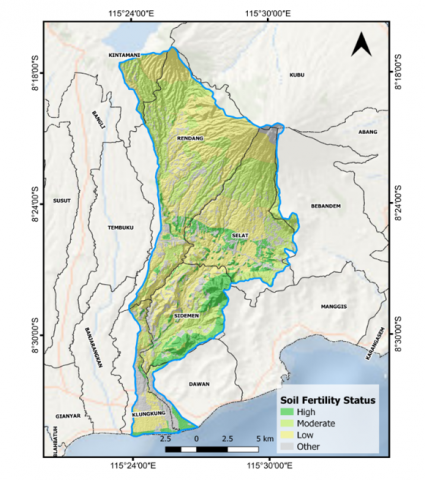
Figure 4. Spatial distribution of soil fertility status in Unda watershed
The results of the evaluation between the chemical properties of the soil and the criteria for soil fertility status will get the soil fertility status. Based on the soil fertility status assessment results in the Unda watershed research location, soil fertility status was classified as low, medium, and high. Low soil fertility status was found in Units 2, 7, 8, 11, 12, 15, 19, 20, 23, 26, and 27, respectively. This unit’s lower soil fertility status is caused by soil types, namely gray regosol, yellowish brown regosol, and humus regosol, whose texture is dominated by sandy loam. As a result, in this type of soil, the organic matter content is low, with this type of soil drying quickly and oxidation of organic matter occurs. Moderate soil fertility status was found in Units 1, 4, 5, 6, 9, 10, 14, 17, 21, 22, and 25, respectively. Spatially, relatively low soil fertility dominates the Unda watershed (Figure 4).
Moderate soil fertility status because one of the parameters determining soil fertility status is classified as low/very low. High soil fertility status was found successively in Units 3, 13, 16, 18, 24, and 28. The Unda watershed research location showed high soil fertility status due to the high value of cation exchange capacity, base saturation, C-organic, P-total, and K-total. This is because this location has a high ability to exchange cations, so a high CEC causes more availability of nutrients needed by plants. Data on the percentage distribution of soil fertility status in the Unda watershed the research location is classified as low as 39.29%, with moderate soil fertility status is spread as much as 39.29%, and high soil fertility status is as much as 21.43%.
Generally, the research area is dominated by low soil fertility status, which is caused by the soil type in the region, namely regosol. Regosol soils are shallow and often lack well-defined horizons. They are typically found on steep slopes and are characterized by limited water and nutrient-holding capacity. Due to their inherent limitations, regosol soils require careful management to support optimal crop growth and productivity. Slope gradient plays a significant role in the development and erosion susceptibility of regosol soils. Steeper slopes are more prone to soil erosion, leading to the loss of topsoil, organic matter, and essential nutrients. Soil erosion on slopes can significantly impact soil fertility, reducing the productive capacity of agricultural lands.
Regosol soils often exhibit low nutrient content and poor cation exchange capacity (CEC). Their shallow depth limits the accumulation of organic matter and nutrient reserves [50]. Consequently, the soil chemical properties, including pH, nutrient availability, and soil fertility, are directly influenced. Proper management practices, such as the addition of organic amendments and targeted nutrient application, are essential to enhance soil fertility and support crop growth in regosol soils. Regosol soil types are characterized by soil fraction composition dominated by the sand fraction.
The texture of the soil, particularly its sand content, influences the availability of water and nutrients to plants. Sandy soils drain quickly, which can lead to water stress for crops, especially during dry periods. These soils also have a lower ability to retain nutrients, requiring more frequent fertilization [51, 52]. However, certain agricultural commodities, such as root vegetables and some fruit crops, can thrive in well-drained sandy soils.
The preliminary study in this research did not include climate variables in the creation of land units, resulting in the omission of impacts for climate variability in soil fertility estimation. This is a limitation of the study that needs to be addressed for future researchers. Previous researchers [53-56] state that climate variability can alter the pH levels of soil, impacting nutrient availability and microbial activity. Increased rainfall can cause leaching of basic cations, leading to soil acidification.
Subsequent researchers should develop a model with more complex thematic maps that incorporate climate, anthropogenic factors, geology, geomorphology, soil types, and existing field management as the basis for land unit mapping. As a consequence, more detailed data would be generated, allowing for implementation in specific regions (small scale).
Maintaining soil fertility is critical for achieving sustainable agricultural production in high land farming [57]. Adequate nutrient availability and balanced soil chemical properties are essential for supporting plant growth, maximizing yields, and minimizing environmental impacts [58-61]. Implementing soil conservation measures, erosion control techniques, and appropriate nutrient management strategies are vital to ensuring long-term soil fertility and agricultural sustainability in high land farming areas [62, 63]. To optimize agricultural productivity in regosol soils on high land, a holistic approach to soil management is required. This includes conservation practices such as contour plowing, terracing, and mulching to prevent soil erosion. Additionally, soil fertility can be enhanced through organic matter incorporation, cover cropping, and precision nutrient management to improve nutrient retention and availability.
GIS technology enables the integration of soil sample data with geospatial information, including soil types, slopes, and land cover data. Through geo-referencing soil samples, researchers can effectively visualize and analyze soil properties across large areas, providing valuable insights for land management decisions. Utilizing GIS, soil samples can be utilized to create detailed land unit maps, delineating areas with similar soil properties. This aids land managers in comprehending and addressing variations in soil fertility within the landscape. Moreover, GIS applications facilitate the ongoing monitoring and evaluation of soil fertility management practices. By comparing historical soil sample data and tracking changes in soil chemical properties, the efficacy of various management interventions can be assessed. This empowers the implementation of adaptive management strategies, ensuring continual enhancement of soil fertility and sustainable land use.
However, a limitation of the preliminary study lies in the utilization of only three thematic maps as the foundation for mapping units, disregarding the consideration of climate variability. Consequently, the study’s representativeness may be compromised when applied in regions with dynamic climates. To address this limitation, future researchers should develop comprehensive models incorporating additional thematic maps encompassing climate, anthropogenic factors, geology, geomorphology, soil types, and existing field management. By incorporating these factors, more detailed and comprehensive data can be generated, enabling implementation at smaller scales.
Safeguarding soil fertility is paramount for achieving sustainable agricultural production, particularly in high land farming areas. Ensuring adequate nutrient availability and balanced soil chemical properties are crucial for supporting plant growth, optimizing yields, and mitigating environmental impacts. Implementing soil conservation measures, erosion control techniques, and appropriate nutrient management strategies are indispensable for ensuring long-term soil fertility and promoting agricultural sustainability in these regions. To optimize agricultural productivity in high land areas with regosol soils, a holistic approach to soil management is imperative. This entails implementing conservation practices such as contour plowing, terracing, and mulching to prevent soil erosion. Furthermore, soil fertility can be enhanced through organic matter incorporation, cover cropping, and precision nutrient management to ameliorate nutrient retention and availability. By adopting these practices, farmers can improve soil fertility and maximize agricultural productivity in high land farming areas.
This research received a grant from the Institute for Research and Community Service, Udayana University SP DIPA: SP DIPA-023.17.2.677526/2022.
[1] Nawaz, A., Farooq, M., Ul-Allah, S., Gogoi, N., Lal, R., Siddique, K.H.M. (2021). Sustainable soil management for food security in South Asia. Journal of Soil Science and Plant Nutrition, 21: 258-275. https://doi.org/10.1007/s42729-020-00358-z
[2] Power, A.G. (2010). Ecosystem services and agriculture: Tradeoffs and synergies. Philosophical Transactions of the Royal Society B: Biological Sciences, 365(1554): 2959-2971. https://doi.org/10.1098/rstb.2010.0143
[3] Bohn, H.L., McNeal, B.L., O'Connor, G.A. (1979). Soil Chemistry. New York, Wiley. https://lib.ugent.be/catalog/rug01:001317935.
[4] Bayu, T. (2020). Review on contribution of integrated soil fertility management for climate change mitigation and agricultural sustainability. Cogent Environmental Science, 6(1): 1823631. https://doi.org/10.1080/23311843.2020.1823631
[5] Scotti, R., Bonanomi, G., Scelza, R., Zoina, A., Rao, M.A. (2015). Organic amendments as sustainable tool to recovery fertility in intensive agricultural systems. Journal of Soil Science and Plant Nutrition, 15(2): 333-352. https://doi.org/10.4067/S0718-95162015005000031
[6] Orden, D., Cheng, F.Z., Nguyen, H., Grote, U., Thomas, M., Mullen, K., Sun, D.S. (2007). Agricultural producer support estimates for developing countries: Measurement issues and evidence from India, Indonesia, China, and Vietnam. International Food Policy Research Institute (IFPRI). https://doi.org/10.2499/9780896291607rr152
[7] Thorburn, C. (2015). The rise and demise of integrated pest management in rice in Indonesia. Insects, 6(2): 381-408. https://doi.org/10.3390/insects6020381
[8] Lawrencia, D., Wong, S.K., Low, D.Y.S., Goh, B.H., Goh, J.K., Ruktanonchai, U.R., Soottitantawat, A., Lee, L.H., Tang, S.Y. (2021). Controlled release fertilizers: A review on coating materials and mechanism of release. Plants, 10(2): 238. https://doi.org/10.3390/plants10020238
[9] Vejan, P., Khadiran, T., Abdullah, R., Ahmad, N. (2021). Controlled release fertilizer: A review on developments, applications and potential in agriculture. Journal of Controlled Release, 339: 321-334. https://doi.org/10.1016/j.jconrel.2021.10.003
[10] Brown, S., Lugo, A.E. (1990). Effects of forest clearing and succession on the carbon and nitrogen content of soils in Puerto Rico and US Virgin Islands. Plant and Soil, 124: 53-64. https://doi.org/10.1007/BF00010931
[11] Lal, R. (2004). Agricultural activities and the global carbon cycle. Nutrient Cycling in Agroecosystems, 70: 103-116. https://doi.org/10.1023/B:FRES.0000048480.24274.0f
[12] Verhulst, N., Govaerts, B., Verachtert, E., Castellanos-Navarrete, A., Mezzalama, M., Wall, P.C., Chocobar, A., Deckers, J., Sayre, K.D. (2010). Conservation agriculture, improving soil quality for sustainable production systems? Food Security and Soil Quality, 137-208. https://doi.org/10.1201/EBK1439800577
[13] Nerlich, A., Dannehl, D. (2021). Soilless cultivation: Dynamically changing chemical properties and physical conditions of organic substrates influence the plant phenotype of lettuce. Frontiers in Plant Science, 11: 601455. https://doi.org/10.3389/fpls.2020.601455
[14] Ahirwal, J., Maiti, S.K. (2016). Assessment of soil properties of different land uses generated due to surface coal mining activities in tropical Sal (Shorea robusta) forest, India. Catena, 140: 155-163. https://doi.org/10.1016/j.catena.2016.01.028
[15] Zhong, W.H., Gu, T., Wang, W., Zhang, B., Lin, X.G., Huang, Q.R., Shen, W.S. (2010). The effects of mineral fertilizer and organic manure on soil microbial community and diversity. Plant and Soil, 326: 511-522. https://doi.org/10.1007/s11104-009-9988-y
[16] Czapla, K.M., Anderson, I.C., Currin, C.A. (2020). The effect of fertilization on biomass and metabolism in North Carolina salt marshes: Modulated by location‐specific factors. Journal of Geophysical Research: Biogeosciences, 125(10): e2019JG005238. https://doi.org/10.1029/2019JG005238
[17] Sims, J.T., Edwards, A.C., Schoumans, O.F., Simard, R.R. (2000). Integrating soil phosphorus testing into environmentally based agricultural management practices. Journal of Environmental Quality, 29(1): 60-71. https://doi.org/10.2134/jeq2000.00472425002900010008x
[18] Palm, C.A., Gachengo, C.N., Delve, R.J., Cadisch, G., Giller, K.E. (2001). Organic inputs for soil fertility management in tropical agroecosystems: Application of an organic resource database. Agriculture, Ecosystems & Environment, 83(1-2): 27-42. https://doi.org/10.1016/S0167-8809(00)00267-X
[19] Zörb, C., Senbayram, M., Peiter, E. (2014). Potassium in agriculture-status and perspectives. Journal of Plant Physiology, 171(9): 656-669. https://doi.org/10.1016/j.jplph.2013.08.008
[20] Bray, R.H., Kurtz, L.T. (1945). Determination of total, organic, and available forms of phosphorus in soils. Soil Science, 59(1): 39-46. https://doi.org/10.1097/00010694-194501000-00006
[21] Bronick, C.J., Lal, R. (2005). Soil structure and management: A review. Geoderma, 124(1-2): 3-22. https://doi.org/10.1016/j.geoderma.2004.03.005
[22] Sumarniasih, M.S., Ginting, M.H., Putu Bhayunagiri, I.B. (2022). Evaluation and improvement of rice field quality in Seririt District, Buleleng Regency, Bali Province, Indonesia. Journal of Degraded & Mining Lands Management, 10(1): 3841-3848. https://doi.org/10.15243/jdmlm.2022.101.3841
[23] Trigunasih, N.M., Saifulloh, M. (2023). Investigation of soil erosion in agro-tourism area: Guideline for environmental conservation planning. Geographia Technica, 18(1): 19-28. https://doi.org/10.21163/GT_2023.181.02
[24] Kartini, N.L., Saifulloh, M., Trigunasih, N.M., Narka, I.W. (2023). Assessment of soil degradation based on soil properties and spatial analysis in dryland farming. Journal of Ecological Engineering, 24(4): 368-375. https://doi.org/10.12911/22998993/161080
[25] Putu Bhayunagiri, I.B., Saifulloh, M. (2022). Mapping of subak areaboundaries and soil fertility for agriculturalland conservation. Geographia Technica, 17(2): 208-219. https://doi.org/10.21163/GT_2022.172.17
[26] Trigunasih, N.M., Wiguna, P.P.K. (2022). Identification of soil fertility status of subak rice fields based on soil chemical properties in Denpasar city, Bali, Indonesia. African Journal of Food, Agriculture, Nutrition and Development, 22(10): 21807-21824. https://doi.org/10.18697/ajfand.115.20880
[27] Walkley, A., Black, I.A. (1934). An examination of the degtjareff method for determining soil organic matter, and a proposed modification of the chromic acid titration method. Soil Science, 37(1): 29-38. https://doi.org/10.1097/00010694-193401000-00003
[28] Liang, B., Lehmann, J., Solomon, D., Kinyangi, J., Grossman, J., O’Neill, B., Skjemstad, J.O., Thies, J., Luizão, F.J., Petersen, J., Neves, E.G. (2006). Black carbon increases cation exchange capacity in soils. Soil Science Society of America Journal, 70(5): 1719-1730. https://doi.org/10.2136/sssaj2005.0383
[29] Chapman, H.D. (1965). Cation-exchange capacity. In Methods of Soil Analysis: Part 2 Chemical and Microbiological Properties, 9: 891-901. https://doi.org/10.2134/agronmonogr9.2.c6
[30] Jobbagy, E.G., Jackson, R.B. (2001). The distribution of soil nutrients with depth: Global patterns and the imprint of plants. Biogeochemistry, 53: 51-77. https://doi.org/10.1023/A:1010760720215
[31] Zajícová, K., Chuman, T. (2019). Effect of land use on soil chemical properties after 190 years of forest to agricultural land conversion. Soil and Water Research, 14(3): 121-131. https://doi.org/10.17221/5/2018-SWR
[32] Madueke, C.O., Okore, I.K., Maduekeh, E.C., Onunwa, A.O., Okafor, M.J., Nnabuihe, E.C., Nwosu, B., Nwaiwu, C.J., Nwosu, T.V. (2021). Characterization and land evaluation of three tropical rainforest soils derived from the coastal plain sands of southeastern Nigeria. Agro-Science, 20(2): 25-36. https://doi.org/10.4314/as.v20i2.5
[33] Tisdall, J.M., Oades, J.M. (1982). Organic matter and water‐stable aggregates in soils. Journal of Soil Science, 33(2): 141-163. https://doi.org/10.1111/j.1365-2389.1982.tb01755.x
[34] Nelson, D.W., Sommers, L.E. (1996). Total carbon, organic carbon, and organic matter. Methods of Soil Analysis: Part 3 Chemical Methods, 5: 961-1010. https://doi.org/10.2136/sssabookser5.3.c34
[35] Vance, E.D., Brookes, P.C., Jenkinson, D.S. (1987). An extraction method for measuring soil microbial biomass C. Soil Biology and Biochemistry, 19(6): 703-707. https://doi.org/10.1016/0038-0717(87)90052-6
[36] Alvarez, C.R., Taboada, M.A., Gutierrez Boem, F.H., Bono, A., Fernandez, P.L., Prystupa, P. (2009). Topsoil properties as affected by tillage systems in the Rolling Pampa region of Argentina. Soil Science Society of America Journal, 73(4): 1242-1250. https://doi.org/10.2136/sssaj2008.0246
[37] Khaleel, R., Reddy, K.R., Overcash, M.R. (1981). Changes in soil physical properties due to organic waste applications: A review. Journal of Environmental Quality, 10(2): 133-141. https://doi.org/10.2134/jeq1981.00472425001000020002x
[38] Zhao, L.S., Fang, Q., Hou, R., Wu, F.Q. (2021). Effect of rainfall intensity and duration on soil erosion on slopes with different microrelief patterns. Geoderma, 396: 115085. https://doi.org/10.1016/j.geoderma.2021.115085
[39] Ran, Q.H., Wang, F., Gao, J.H. (2019). Modelling effects of rainfall patterns on runoff generation and soil erosion processes on slopes. Water, 11(11): 2221. https://doi.org/10.3390/w11112221
[40] Wang, S.S., Sun, B.Y. Li, C.D., Li, Z.B., Ma, B. (2018). Runoff and soil erosion on slope cropland: A review. Journal of Resources and Ecology, 9(5): 461-470. https://doi.org/10.5814/j.issn.1674-764x.2018.05.002
[41] Nelson, R.G., Tatarko, J., Ascough II, J.C. (2015). Soil erosion and organic matter variations for central Great Plains cropping systems under residue removal. Transactions of the ASABE, 58(2): 415-427. https://doi.org/10.13031/trans.58.10981
[42] Mohammed, S., Hassan, E., Abdo, H.G., Szabo, S., Mokhtar, A., Alsafadi, K., Al-Khouri, I., Rodrigo‐Comino, J. (2021). Impacts of rainstorms on soil erosion and organic matter for different cover crop systems in the western coast agricultural region of Syria. Soil Use and Management, 37(1): 196-213. https://doi.org/10.1111/sum.12683
[43] Vance, C.P., Uhde‐Stone, C., Allan, D.L. (2003). Phosphorus acquisition and use: Critical adaptations by plants for securing a nonrenewable resource. New Phytologist, 157(3): 423-447. https://doi.org/10.1046/j.1469-8137.2003.00695.x.
[44] Hedley, M.J., Stewart, J.W.B., Chauhan, B.S.C. (1982). Changes in inorganic and organic soil phosphorus fractions induced by cultivation practices and by laboratory incubations. Soil Science Society of America Journal, 46(5): 970-976. https://doi.org/10.2136/sssaj1982.03615995004600050017x
[45] Rengel, Z., Damon, P.M. (2008). Crops and genotypes differ in efficiency of potassium uptake and use. Physiologia Plantarum, 133(4): 624-636. https://doi.org/10.1111/j.1399-3054.2008.01079.x
[46] Römheld, V., Kirkby, E.A. (2010). Research on potassium in agriculture: Needs and prospects. Plant and Soil, 335(1): 155-180. https://doi.org/10.1007/s11104-010-0520-1
[47] Fu, B., Chen, L., Huang, H.Y., Qu, P., Wei, Z.G. (2021). Impacts of crop residues on soil health: A review. Environmental Pollutants and Bioavailability, 33(1): 164-173. https://doi.org/10.1080/26395940.2021.1948354
[48] Sofo, A., Zanella, A., Ponge, J.F. (2022). Soil quality and fertility in sustainable agriculture, with a contribution to the biological classification of agricultural soils. Soil Use and Management, 38(2): 1085-1112. https://doi.org/10.1111/sum.12702
[49] Palani, K., Selvam, S.P.P., Velusamy, S., Melmangalam, R.R. (2021). Soil fertility evaluation to adopt climate-smart agriculture in Mambattu village, Maduranthakam block of Kanchipuram district, Tamil Nadu, India. Nature Environment and Pollution Technology, 20(2): 595-600. https://doi.org/10.46488/NEPT.2021.v20i02.016
[50] Calzolari, C., Ungaro, F., Vacca, A. (2021). Effectiveness of a soil mapping geomatic approach to predict the spatial distribution of soil types and their properties. Catena, 196: 104818. https://doi.org/10.1016/j.catena.2020.104818
[51] Ewetola, E.A., Oyeyiola, Y.B., Owoade, F.M., Farotimi, M.F. (2019). Influence of soil texture and compost on the early growth and nutrient uptake of moringa oleifera Lam. Acta Fytotechn Zootechn, 22(2): 26-33. https://doi.org/10.15414/afz.2019.22.02.26-33
[52] Wang, D.W., Wang, Z.H., Zhang, J.Z., Zhou, B., Lv, T.B., Li, W.H. (2021). Effects of soil texture on soil leaching and cotton (gossypium hirsutum L.) growth under combined irrigation and drainage. Water, 13(24): 3614. https://doi.org/10.3390/w13243614
[53] Teimouri, M., Mohammadi, P., Dick, W.A., Asgarani, E. (2021). Grazing and climate effects on soil chemical properties and bacterial community in a Semiarid Area, Iran. Eurasian Soil Science, 54(4): 541-550. https://doi.org/10.1134/S1064229321040165
[54] Dixon, J.L., Chadwick, O.A., Vitousek, P.M. (2016). Climate‐driven thresholds for chemical weathering in postglacial soils of New Zealand. Journal of Geophysical Research: Earth Surface, 121(9): 1619-1634. https://doi.org/10.1002/2016JF003864
[55] Moreno, J.L., Bastida, F., Díaz-López, M., Li, Y., Zhou, Y.P., López-Mondéjar, R., Benavente-Ferraces, I., Rojas, R., Rey, A., García-Gil, J.C., Plaza, C. (2022). Response of soil chemical properties, enzyme activities and microbial communities to biochar application and climate change in a Mediterranean agroecosystem. Geoderma, 407: 115536. https://doi.org/10.1016/j.geoderma.2021.115536
[56] Manjeet, A., Niwas, R., Khichar, M.L., Kumar, A. (2022). Study of climate change impact on crops and soil health in india: A review. Agricultural Reviews, 44(3): 357-363. https://doi.org/10.18805/ag.r-2200
[57] Mutuku, E.A., Vanlauwe, B., Roobroeck, D., Boeckx, P., Cornelis, W.M. (2021). Physico-chemical soil attributes under conservation agriculture and integrated soil fertility management. Nutrient Cycling in Agroecosystems, 120: 145-160. https://doi.org/10.1007/s10705-021-10132-x
[58] Behera, S., Jyotirmayee, B., Mandal, U., Mishra, A., Mohanty, P., Mahalik, G. (2022). Effect of organic fertilizer on growth, yield and quality of pisum sativum l.: A review. Ecology, Environment and Conservation, 28: S233-S241. https://doi.org/10.53550/eec.2022.v28i02s.039
[59] Nguemezi, C., Tematio, P., Yemefack, M., Tsozue, D., Silatsa, T.B.F. (2020). Soil quality and soil fertility status in major soil groups at the Tombel area, South-West Cameroon. Heliyon, 6(2): e03432. https://doi.org/10.1016/j.heliyon.2020.e03432
[60] Grzebisz, W. (2021). Site-specific nutrient management. Agronomy, 11(4): 752. https://doi.org/10.3390/agronomy11040752
[61] Mng’ong’o, M., Munishi, L.K., Blake, W., Comber, S., Hutchinson, T.H., Ndakidemi, P.A. (2021). Soil fertility and land sustainability in Usangu Basin-Tanzania. Heliyon, 7(8): e07745. https://doi.org/10.1016/j.heliyon.2021.e07745
[62] Kagabo, D.M., Stroosnijder, L., Visser, S.M., Moore, D. (2013). Soil erosion, soil fertility and crop yield on slow-forming terraces in the highlands of Buberuka, Rwanda. Soil and Tillage Research, 128: 23-29. https://doi.org/10.1016/j.still.2012.11.002
[63] Novara, A., Pisciotta, A., Minacapilli, M., Maltese, A., Capodici, F., Cerdà, A., Gristina, L. (2018). The impact of soil erosion on soil fertility and vine vigor. A multidisciplinary approach based on field, laboratory and remote sensing approaches. Science of The Total Environment, 622-623: 474-480. https://doi.org/10.1016/j.scitotenv.2017.11.272