Sosilawaty*![]() | Nisfiatul Hidayat
| Nisfiatul Hidayat![]() | Johanna Maria Rotinsulu
| Johanna Maria Rotinsulu![]() | Wahyuni Barimbing
| Wahyuni Barimbing![]()
© 2023 IIETA. This article is published by IIETA and is licensed under the CC BY 4.0 license (http://creativecommons.org/licenses/by/4.0/).
OPEN ACCESS
The objective of this study was to examine the composition, structure, and species diversity of vegetation in Sebangau National Park based on the thickness of peat. The findings revealed that the plant species composition varied according to the peat thickness at different stages of growth. Syzigium sp.1 and Elaeocarpus parvifolius were the dominant species at the seedling level, while are Syzygiumsp.1 and Tetratomia tetradra dominated at the sapling level. Cratoxylum arborescens and Elaeocarpus parvifolius dominated at the pole level, and Cratoxylum arborescens and Diospyros bantamensis at the tree level. The species diversity of plants was high across all levels of growth, with a high category index value (3.14-3.86) for all levels except seedlings on shallow and very deep peat (medium category with an index value of 2.76 and 2.86, respectively). The species evenness index was also high (0.73-0.93) for all growth levels across all peat thicknesses except saplings on shallow peat, which had a medium category index value of 0.54. The species richness index was high (5.66-11.42) for all growth levels based on any peat thickness. The horizontal stand structure of vegetation across all peat thicknesses followed an inverted J pattern. The same index for all growth rates at all peat thicknesses ranged from low to high category with a consistent index value of approximately 44.94-85.00%.
composition, horizontal stand structures, rates of growth
1.1 Background
Peat swamp forests are typically situated in coastal areas affected by tides, as well as in swamps and lakes, including both highland and lowland lakes. This forest type is commonly found in Indonesia, where the terms "peat swamp forest" and "swamp forest" are often used interchangeably, with no distinct boundary between the two. Peat formation in swamps is referred to as topogenous peat, while tidal peat, which is prevalent on the East coast of Sumatra (Riau, Jambi, South Sumatra, and Lampung), is classified as ombrogenic. In Kalimantan, peat is present in areas close to the coasts of West Kalimantan, Central Kalimantan, South Kalimantan, and to a lesser extent, on the coast of East Kalimantan [1].
Peat swamp forest has natural wealth in the form of a diversity of plant species [2-6]. However, some literature states that the diversity of tree species in peat swamp forest is relatively lower when compared to lowland forest on mineral soils. Even some of the tree species are endemic. This happens because of the influence of edaphic, climatic, and genetic factors [7]. One of the edaphic factors that affect the endemicity of plant species is soil type. The general characteristics of peat soils are that they do not develop a profile that leads to the formation of different horizons, are dark brown to black in color, have high water content and are tea-colored and have an acidic reaction with a pH of 3.0 - 5.0.
The Sebangau peat swamp forest area has different peat thickness from one place to another. The evaluation thickness of peat in Central Kalimantan can vary depending on the context and purpose of peatland use. However, based on Indonesian government regulations, the Minimum Peat Thickness (KMG) allowed to be opened or developed in Central Kalimantan is 3 meters. In addition, the Indonesian government has also established a moratorium or prohibition on opening new peatlands throughout Indonesia since 2016, except under certain specified conditions. This is done to minimize the risk of forest and peatland fires, reduce greenhouse gas emissions, and protect the peat ecosystem which is important for biodiversity and the livelihoods of communities. In the more distant part of the river, namely in the north-east, approximately 13-15 km from the riverbank, there are about 40,000 hectares of inland highland swamp forest with a peat thickness of more than 12 m. The composition of forest tree stands showed a good stratification of tree crowns, which reached a height of 45 m. Several commercial tree species are Agathis sp, Kompassia sp, Shorea sp and Palaquium sp [8].
Geographically, Sebangau National Park is located at 1°55'14.80"-3°02'32.71"S and 113°18'22.71"-114°04'36.58"E. Administratively, it is located in the districts of Katingan, Pulang Pisau, and the city of Palangka Raya in the province of Central Kalimantan. Sebangau National Park borders eight districts, namely Sabangau, Jekan Raya, and Bukit Batu districts in Palangka Raya; Sebangau Kuala district in Pulang Pisau regency; and Tasik Payawan, Kamipang, Mendawai, and Katingan Kuala districts in Katingan regency.
Sebangau National Park is the only national park in Indonesia where over 90% of its area is peatland ecosystem. The importance of this area being designated as a national park is that it is one of the remaining peat swamp forests in relatively good condition in Central Kalimantan and is the habitat of the Bornean orangutan (Pongo pygmaeus wrumbii) with an estimated population of over 6,080 individuals.
The climate of Sebangau National Park, according to the Koppen system, mostly falls under the wet tropical climate (A), which is a type of tropical climate with a dry season of the Aw type. This type indicates an area that has an annual rainfall of <2,500 mm, a rainfall during the driest month of <60 mm, and a monthly average temperature of the coldest month of >18℃.
The vegetation in Sebangau National Park is dominated by peat swamp forest, which is a type of tropical rainforest that grows on peatland. This forest is dominated by tall trees such as Shorea spp., Dipterocarpus spp., and Campnosperma spp. Peat swamp forest is also home to various flora and fauna, including zoologi, gibbons, sun bears, and hornbills.
The vegetation that composes the peat forest ecosystem are plant species that are evergreen [9-12]. Flora in peat forests generally undergo modifications to changes in shape according to their needs such as having breath roots to obtain oxygen in peat swamp habitats which are almost always flooded [13].
Although the vegetation cover shows improvement, the species composition is still unknown, especially at different peat thicknesses after disturbances in the form of logging. Therefore, it is necessary to conduct research on plant species, especially tree habitus, so as to obtain data on tree species diversity based on the thickness of peat in Sebangau National Park.
1.2 Research objectives
1. Analyze the composition and structure of vegetation based on various levels of peat thickness in the Sebangau National Park area.
2. Analyzing the diversity of vegetation types based on the thickness of the peat in the Sebangau National Park, Central Kalimantan.
2.1 Research time and location
The research was conducted in Sebangau National Park, Central Kalimantan Province. The time of the study was carried out in August 2018 - September 2018. The stages of activities include the preparation stage, proposal preparation, primary data collection, data analysis and writing research results.
2.2 Objects and research tools
The object observed in this study was the habitus of tree vegetation (woody plants) from the level of growth: seedlings, saplings, poles and trees in peatland forest stands at various thicknesses of peat in Sebagau National Park. The materials and tools used in the research are;
a. Work map, to determine the work location
b. Compass, to determine direction
c. Machete, to pioneer
d. Measuring tape, to measure the circumference of a tree
e. Roller meter measuring 50 m, for determining distances and forming plots
f. Flag tape
g. Tally sheet and stationery
h. GIS application to describe the research area spatially
i. Laptop/computer and calculator, as a calculating tool
j. Camera, for documentation
k. GPS, to determine the direction of the coordinates
l. Peat drill (peat auger)
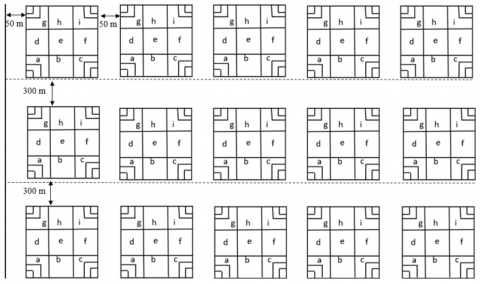
Figure 1. Form of observation plots and paths at the study site
Figure 1 criteria used to distinguish the growth level of trees are:
2.3 Research procedure
Vegetation analysis was conducted to determine species composition and forest community structure. Data collection in the vegetation analysis was carried out by making sample plots in each forest community based on the thickness of the peat.
The minimum area of sample plots for each forest community in order to represent the forest community is 0.5 ha [14-16].
Table 1. Total area and number of sample plots based on thickness level peat
|
No |
Peat thickness level |
Peat thickness (cm) |
Area of sample plot/(ha) |
Number of plots |
|
1 |
Shallow |
50 - 100 |
0.54 |
6 |
|
2 |
Currently |
100 - 200 |
1.71 |
19 |
|
3 |
In |
200 - 300 |
1.62 |
18 |
|
4 |
Very deep |
>300 |
1.35 |
15 |
Vegetation analysis was carried out using the checkered line method. At the observation location, 6 lines were made with the distance between the lines 300 m. In the path, 5 observation plots are made with the distance between plots 50 m, each plot was divided into 9 sub plots and placed on a 350 m long strip. The total number of plots made was 60. However, in this study two plots were not analyzed because they did not meet the criteria for peat thickness (located on land without peat). The total area and number of sample plots based on the level of peat thickness are presented in Table 1.
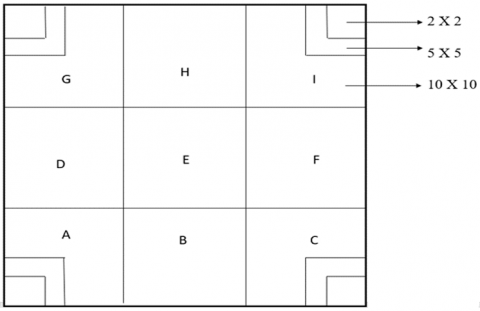
Observation and data collection of vegetation is carried out on sub-plots, the size of which depends on the level of vegetation growth. The sub-plots were constructed using nested sampling, with sizes: (a) 20 mx 20 m for tree level, (b) 10 mx 10 m for pole level, (c) 5 mx 5 m for sapling level and (d) 2 m x 2 m for seedling level. Vegetation observation design in each sub-plot based on growth rate vegetation is presented in Figure 2.
Figure 2. Sub-plot form of each research observation
2.4 Data analysis
The data used to calculate the Importance Value Index (IVI) and other parameters in vegetation analysis can be obtained through various methods, such as field measurements, visual observations, distance measurements, or digital image analysis. The data has been previously processed to ensure consistency, accuracy, and comparability between different samples or time periods. The data processing may include data cleaning, plant species identification, relative or percentage value calculation, and data normalization. The data processing depends on the research objectives and the nature of the data itself. If the data comes from field observations, it involves plant species classification, parameter measurement such as height and diameter, and root depth measurement. On the other hand, if the data is obtained through digital image analysis, it may involve image processing, object segmentation, and feature extraction. Since each type of vegetation analysis requires a different approach, the data processing methods can vary depending on the type of vegetation analysis used.
One of the data processing methods used in vegetation analysis is data normalization, as previously mentioned. Normalization can help ensure that data from various variables or samples have the same scale or distribution, so they can be used in a balanced way in the calculation of vegetation analysis indices and parameters. In addition, other methods that may be used in the data processing of vegetation analysis are data transformation, identification and removal of outliers, as well as data grouping or plant species classification.
2.4.1 Tree species composition
The composition of the plant can be determined by using the Important Value Index (IVI) parameter. Mathematical formulas that can be used in the calculation of vegetation analysis, including understored are as follows:
Important Value Index (IVI) =RD + RF + RD (for pole and tree level)
Important Value Index (IVI) =RD + RF (for seedling and sapling levels)
2.4.2 Species Diversity Index (H')
Analysis of species diversity index (h') was calculated using Shannon’s species diversity formula [17] as follows
$H^{\prime}=-\sum_{i=1}^s\left[\left(\frac{n i}{N}\right) \ln \left(\frac{n i}{N}\right)\right]$
Information:
H'= Diversity Index
N= Total number of individuals of all species
ni= Number of individuals of the ith species
ln= Natural logarithm
S= Number of species
The criteria put forward by the Study Team [18-20] for the parameters of species diversity belong to several weights of criteria and classifications. If the value of H'> 3 the species diversity is high, the value of H' = 2-3 is moderate, and if H' < 2 the species diversity is low.
2.4.3 Evenness Index (E)
Evenness Index in Ludwig and Reynold [21] was used to determine the abundance of individuals in each species with the equations following:
$E=\frac{H^{\prime}}{\operatorname{Ln}(S)}$
Information:
E = Evenness index
H' = Species diversity index
S = Number of species
Ln = Natural logarithm
The range of evenness index values is 0-1 which is used to determine evenness, if the value is 0 it means the evenness of species is low and if the value is 1, the evenness is high. Based on the criteria of [22] the magnitude of E < 0.3 indicates low species evenness, E = 0.3-0.6 indicates medium species evenness and E > 0.6 high species evenness.
2.4.4 Species Richness Index (R)
The formula used to determine the species richness index is the Margalef Index formula [17], namely:
$R=\frac{s-1}{\ln N}$
Information:
R = Margalef Indeks Index
s = Number of species
N = Total number of individuals of all species
ln = Natural logarithm
The magnitude of R<3.5 indicates low species richness, R between 3.5-5.0 indicates moderate species richness and R>5.0 is high [22].
2.4.5 Species Similarity Index (S)
The level of species similarity between communities (shallow, medium, deep, and very deep peat thickness) can be determined using the formula [23]:
S=2C/(A+B)
where:
S = Community similarity index
A = number of species in community A
B = Number of species in community B
C = Number of species that the same in both samples
The criteria for species similarity are very high if the S value is >75%, the similarity is high if S>50%-75%, the similarity is low if S>25%-50%, and the similarity is very low if S<25%.
2.4.6 Horizontal stand structure
Stand structure can be analyzed by making a relationship between the level of diameter at breast height (cm) and tree density (number of trees per hectare) using Curve Expert software. Tree density (number of trees per hectare) is placed on the y-axis, while the diameter level is the abscissa. The diameter levels used to make the stand structure graph are, the diameter levels are between 10-19,99 cm, 20-29.99 cm, 30-39.99 cm, 40-49.99 cm, 50-59.99 cm, 60 -69.99 cm, 70-79.99 cm and 80 cm up.
These steps include plant species identification, measurement of physical parameters such as stem diameter, and calculation of stand structure parameters such as the number of individuals, volume, and density. The data can then be analysed using statistical methods. Generally, stand structure refers to the composition and configuration of plants in a particular area or location. Stand structure parameters can include the size, age, type, and density of plants in an area. Stand structure analysis can provide important information about the health and productivity of forests, as well as the biodiversity within them. Information that can be obtained through stand structure analysis includes information about plant density and distribution, tree size distribution, and tree age distribution. Stand structure analysis can also help monitor changes that occur in forests due to human activities or natural factors, such as forest fires or climate change. Overall, stand structure analysis can provide a comprehensive overview of the condition and diversity of forests at a certain scale, as well as provide important information for forest resource management and conservation.
3.1 Composition type
Species composition is a collection of several types of vegetation in a stand to determine the condition of forest stands, vegetation that grows naturally in an area which is the result of the interaction of various environmental factors. The results of the vegetation analysis carried out at the research site at the four levels of peat thickness found as many as 142 types of vegetation with 50 families. The number of species found at all growth stages of seedlings, saplings, poles and trees at shallow peat thickness was 84 species, at medium peat thickness as many as 107 species, at deep peat thickness as many as 110 types of vegetation, while at very deep peat thickness found the number of vegetation types as much as 106 types of vegetation. The presence of these species is influenced by soil fertility and peat thickness.
Table 2. Number of vegetation types based on peat thickness level
|
Peat Thickness |
Number of Vegetation Types |
Total Type of Vegetation |
|||
|
Seedling |
Stake |
Pole |
Tree |
||
|
Shallow |
44 |
59 |
64 |
42 |
84 |
|
Currently |
69 |
76 |
81 |
47 |
107 |
|
In |
67 |
83 |
79 |
50 |
110 |
|
Very deep |
61 |
71 |
78 |
42 |
106 |
Table 2 shows that the highest number of vegetation types based on peat thickness was found in medium, deep and very deep peat thickness while shallow peat thickness had the lowest number of species. The type of vegetation found in shallow peat thickness is clustered or uniform (based on the most types in the location) because it has experienced fire disturbances. Types of vegetation that are clustered in nature that are mostly found are Balangeran vegetation types at the seedling level, at the sapling level namely Tampohot, at the pole level namely Gerunggang and at the tree level the vegetation types are evenly distributed so that no more clusters are found and the amount of vegetation that can survive is relatively low because undergo regeneration. Shallow peat thickness has been restored to its initial condition with the discovery of native vegetation types at the research site, namely Jambu-jambuan, Takal, Belawan Putih, Jangkang Kuning and others.
In accordance with the opinion of reference [24] this type of vegetation Gerunggang and Tampohot can survive in burned peat swamp forest because this plant species is able to form shoots (resprouting) from the base of the stem after burning. In the swamp cover area, there are still commercially valuable trees such as Shorea belangeran. According to the study [25] that Shorea belangeran can be categorized as a species that is resistant to growth and regeneration in burned forests. In addition, Shorea belangeran is a tree that cannot tolerate shade or likes light (light demanding species), so after a fire it is very easy for him to adapt to the environment.
Shallow, medium, deep and very deep peat thickness levels obtained different types of vegetation. According to the explanation of the studies [26, 27] the maturity level of peat varies because it is formed from different materials, environmental conditions, and time. Peat that has matured will tend to be smoother and more fertile. On the other hand, the immature ones contain a lot of fiber and are less fertile, it is suspected that there is a change in the thickness of the peat.
The results of studies [28-32] showed that changes in the composition of tree species in the stand were characterized by a reduced proportion of tree species as a result of the various regeneration abilities of each of these tree species. This can also be caused by the condition of the peat which is getting thicker inward and causes the ability to regenerate trees to decrease. The three dominant plant species with the highest values for seedlings, saplings, poles and trees based on peat thickness are presented in Tables 3-6.
Table 3 shows that at a peat thickness of 50-100 cm (shallow) the types of vegetation at the seedling level that have the highest INP are Balangeran, Jambu Hutan, Hampuak. At a peat thickness of 100-200 cm (medium) the types of vegetation at the seedling level that have the highest IVI are Jambu Hutan, Hampuak, Mentangur. At a peat thickness of 200-300 cm (deep), the types of vegetation that have the highest INP are Hampuak, Jambu Hutan, Mentangur. At a peat thickness of >300 (very deep), the highest IVI is found in the Medium Guava, Penaga Anchor, Gantalang vegetation types. The type of vegetation that has the highest IVI is because it has a higher density and frequency value than the other types. Wide distribution or high IVI of a species is not an absolute benchmark to determine the continuity of growth of the species. In fact, the seedlings found on the forest floor will compete with each other for nutrients, water, oxygen and so on. Seedlings that are not able to compete with other types will die. Thus the number of seedlings will be reduced. To meet their needs, seedlings need a large growing space by expanding their root area as wide as possible in order to absorb more water and nutrients. Thus the number of seedlings will be reduced. To meet their needs, seedlings need a large growing space by expanding their root area as much as possible in order to absorb more water and nutrients. Thus the number of seedlings will be reduced. To meet their needs, seedlings need a large growing space by expanding their root area as wide as possible in order to absorb more water and nutrients [33-35].
Table 3. Important Value Index (IVI) for 3 (three) dominant plant types seedling rates at each peat thickness level
|
Peat thickness level |
No |
Type |
IVI (%) |
|
50-100cm |
1 |
Shorea balancer (Balangeran) |
30.42 |
|
2 |
Syzygium sp. 1 (Guava Forest) |
23.82 |
|
|
3 |
Elaeocarpus parvifolius (Hampuak) |
10.63 |
|
|
100-200 cm |
1 |
Syzygiumsp. 1 (Guava Forest) |
23.16 |
|
2 |
Elaeocarpus parvifolis (Hampuak) |
19,90 |
|
|
3 |
Stemonurus secundiflorus (meaning) |
14.03 |
|
|
200-300cm |
1 |
Elaeocarpus parvifolius (Hampuak) |
19.26 |
|
2 |
Syzygium sp. 1 (Guava Forest) |
14.00 |
|
|
3 |
Syzygium incarnatum (Medium Guava) |
9.78 |
|
|
>300cm |
1 |
Syzygium incarnatum (Medium Guava) |
12.30 |
|
2 |
Xanthophyllum eurhynchum (Anchor Dragon) |
11.17 |
|
|
3 |
Diospyros bantamensis (Gantalang) |
9.71 |
Seedling and sapling levels on vegetation. Guava (which often appears) is a type that is often found and can grow in various thicknesses of shallow, medium and deep peat except for very deep peat thicknesses, which states that the vegetation that composes the peat forest ecosystem are plant species that are evergreen.
The seedling rate of Balangeran has the highest IVIvalue, this is because the Balangeran species is a species that grows scattered in lowland forest and peat swamp forest or tidal inundated forest, on clay or sandy loam with acidic soil pH - very acidic, exchange capacity cations (CEC) and moderate base saturation at an altitude of 0-100 masl. The ecological conditions where Balangeran grows are in accordance with the existing environmental conditions at the research site, so that Balangeran is able to adapt well to these environmental conditions.
Table 4. Important Value Index (IVI) for 3 (three) dominant plant types at sapling levels at each peat thickness level
|
Peat thickness level |
No |
Type |
IVI (%) |
|
50-100cm |
1 |
Syzygium lineatum (Bintan) |
20.37 |
|
2 |
Syzygium sp. 1 (Guava) |
14.25 |
|
|
3 |
Calophyllum soullatri(takal) |
12.22 |
|
|
100-200 cm |
1 |
Syzygium sp. 1 (Guava) |
16.70 |
|
2 |
Tetratomia tetradra (Development) |
11.92 |
|
|
3 |
Garcinia bancana (Forest Mangosteen) |
11.41 |
|
|
200-300cm |
1 |
Syzygium sp. 1 (Guava) |
14.85 |
|
2 |
Xanthophyllum eurhynchum (Yellow) |
12.06 |
|
|
3 |
Tetratomia tetradra (Development) |
10.45 |
|
|
>300cm |
1 |
Syzygium sp. 1 (Guava) |
11.71 |
|
2 |
Palaquium sp.1 (Gentalang) |
11.01 |
|
|
3 |
Xanthophyllum eurhynchum (Anchor Dragon) |
10.27 |
The types of vegetation at the sapling level found based on the thickness of the peat have different species compositions between the forest communities studied. At a peat thickness of 50-100 cm (shallow), the highest IVI species were found in Bintan, Guava, Takal. For peat thickness of 100-200 cm (medium) there are types of vegetation that have the highest IVIare Guava, Rembangun, Mangosteen Forest. The next type of vegetation for peat thickness of 200-300 cm (deep) which has the highest IVI value is Jambu-jambu, Kemuning, Rambangun. For vegetation types with a peat thickness of >300 (very deep), the ones with the highest IVI are Jambu-jambuan, Gentalang, Panaga Jangkar. For more details can be seen in Table 4, where at the sapling level shows the IVI of plant species that are often found in each thickness of peat there are guava vegetation types, this is because guava plant species can live and are able to survive in mastering each area which shows a fairly high adaptability to various conditions. environment in all research plots. This is in accordance with the opinion of studies [36, 37] which states that this species has a wide habitat range, growing on almost all types of vegetation, such as coastal forests, swamp forests, monsoon forests, bamboo forests, peat swamps, lowlands, heath forests, savanna to mountain forests. And some species are able to grow in extreme habitat conditions such as limestone and ultramafic soils. This is because the guava plant species can live and survive in controlling each of these areas which shows a fairly high adaptability to various environmental conditions in all research plots. This is in accordance with the opinion of the study [36] which states that this species has a wide habitat range, growing on almost all types of vegetation, such as coastal forests, swamp forests, monsoon forests, bamboo forests, peat swamps, lowlands, heath forests, savanna to mountain forests. And some species are able to grow in extreme habitat conditions such as limestone and ultramafic soils. This is because the guava plant species can live and survive to dominate each of these areas which shows a fairly high adaptability to various environmental conditions in all research plots. This is in accordance with the opinion of the study [36] which states that this species has a wide habitat range, growing on almost all types of vegetation, such as coastal forests, swamp forests, monsoon forests, bamboo forests, peat swamps, lowlands, heath forests, savanna to mountain forests. And some species are able to grow in extreme habitat conditions such as limestone and ultramafic soils. This is in accordance with the opinion of the study [36] which states that this species has a wide habitat range, growing on almost all types of vegetation, such as coastal forests, swamp forests, monsoon forests, bamboo forests, peat swamps, lowlands, heath forests, savanna to mountain forests. And some species are able to grow in extreme habitat conditions such as limestone and ultramafic soils. This is in accordance with the opinion [36] which states that this species has a wide habitat range, growing on almost all types of vegetation, such as coastal forests, swamp forests, monsoon forests, bamboo forests, peat swamps, lowlands, heath forests, savanna to mountain forests. And some species are able to grow in extreme habitat conditions such as limestone and ultramafic soils.
Table 5. Importance Value Index (IVI) for 3 (three) dominant plant types at pole level at each peat thickness level
|
Peat Thickness Level |
No |
Type |
IVI (%) |
|
50-100cm |
1 |
Cratoxylum arborescens (Gerunggang) |
26.67 |
|
2 |
Syzigium lineatum (Bintan) |
25.38 |
|
|
3 |
Elaeocarpus parvifolius (Hampuak) |
15.16 |
|
|
100-200 cm |
1 |
Elaeocarpus parvifolius (Hampuak) |
21.67 |
|
2 |
Syzigium sp. 1 (Jambu-jambu) |
16.61 |
|
|
3 |
Shorea balangeran (Balangeran) |
13.88 |
|
|
200-300cm |
1 |
Cratoxylum arborescens (Gerunggang) |
16.65 |
|
2 |
Shorea balangeran (Balangeran) |
12.44 |
|
|
3 |
Syzigium sp. 1 (Jambu-jambu) |
11.85 |
|
|
>300cm |
1 |
Cratoxylum arborescens (Gerunggang) |
35.78 |
|
2 |
Campnosperma coriaceum (Terantang) |
13.75 |
|
|
3 |
Tetractomia tetrandra (Parut) |
12.84 |
The type of pole-level vegetation in peat thickness of 50-100 cm (shallow) which has the highest IVI is Gerunggang, Bintan, Hampuak. The vegetation types with a peat thickness of 100-200 cm (medium) which have the highest IVI are Hampuak, Jambu-jambu, Balangeran. The type of vegetation at a peat thickness of 200-300 cm (deep) which has the highest IVI value is Gerunggang, Balangeran, Jambu-jambu. Meanwhile, at the peat thickness >300 cm (very deep) the highest IVI values were Gerunggang, Terentang and Grut vegetation types.
Gerunggang is a type that is often found and can grow at pole level with shallow, deep and very deep peat thicknesses. Gerunggang is one of the native plant species of peat swamp forest, but can also grow on sandy soil or sandy loam soil. This species can grow in areas with climate types A and B at an altitude above 900 meters above sea level. This species can grow at an altitude of more than 1800 meters above sea level. This shows that Gerunggang has a very good adaptation and regeneration rate at the research site at the pole level with the highest IVI values found based on shallow, deep, and very deep peat thicknesses.
Table 6. Important Value Index (IVI) for 3 (three) dominant plant types at tree level at each peat thickness level
|
Peat Thickness Level |
No |
Type |
|
IVI (%) |
|
50-100cm |
1 |
Cratoxylum arborescens (Gerunggang) |
|
45.37 |
|
2 |
Combretocarpus rotundatus (Tumih) |
|
36.68 |
|
|
3 |
Diospyros bantamensis (Gantalang) |
|
18.31 |
|
|
100-200 cm |
1 |
Cratoxylum arborescens (Gerunggang) |
|
23.38 |
|
2 |
Palaquium ridleyi (Nyatoh Bawoi) |
|
14.00 |
|
|
3 |
Dactylocladus stenostachys (Mertibu) |
|
13.28 |
|
|
200-300cm |
1 |
Diospyros bantamensis (Gantalang) |
|
15,13 |
|
2 |
Syzigium sp. 1 (Jambu-jambu) |
|
14.09 |
|
|
3 |
Sandoricum beccarianum (Papung) |
|
13.62 |
|
|
>300cm |
1 |
Elaeocarpus mastersii (Sangeh) |
|
21.05 |
|
2 |
Campnosperma coriaceum (Tarantang) |
|
17.32 |
|
|
3 |
Vatica sp. (Rasak) |
|
15,30 |
Table 6 shows that the types of vegetation that have IVI values that are often found in peat thicknesses of 50-100 cm (shallow) are the Gerunggang, Tumih, Malam-malam vegetation types. At a peat thickness of 100-200 (medium) cm, those with the highest IVI for vegetation types are Gerunggang, Tumih, Gantalang. At a peat thickness of 200-300 cm (deep), the highest IVI vegetation types are Gantalang, Jambu-jambu, Papung. Meanwhile, at peat thickness >300 cm (very deep) the highest IVIs were Sangeh, Tarantang and Rasak. This is supported by the statement of the study [38] which says that the success of a type of vegetation in an area ais influenced by its ability to adapt optimally to all physical environmental factors (light, temperature, humidity, soil structure, and so on).
3.2 Species Diversity Index (H')
The Species Diversity Index (H') can be used as a comparison between one forest condition and another. This index is one of the parameters for the continuity of succession or stability in a forest condition. In addition, this index can determine the biotic disturbances that occur [39].
The diversity of species in a community is influenced by the density, the number of species and the level of distribution of each species. To determine the level of stability of species diversity can be used the value of the species diversity index (H'). The stability of a species is also influenced by the level of evenness, the higher the value of H', the more stable the diversity of species in the community. On the other hand, the lower the value of H', the lower the level of stability of species diversity in the community.
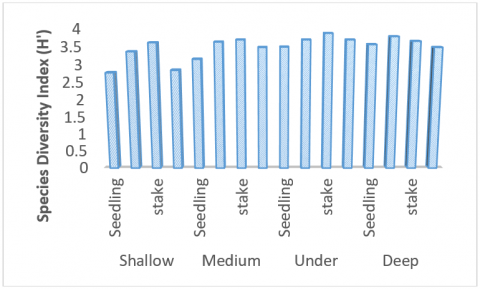
The condition of the research location showed that the value of the species diversity index at the peat thickness of 50-100 cm (shallow) was included in the high category at the sapling, pole and tree level because the value of H'>3, while at the seedling level it was in the medium category because the value of H'< 3. For the value of the species diversity index at a peat thickness of 100-200 cm (medium) the levels of seedlings, saplings, poles and trees are all included in the high category as well as the peat thickness level of 200-300 cm (deep) is included in the high category because the H' value that appears >3. The species diversity index value at peat thickness >300 cm (very deep) is included in the high category for the level of stakes, poles and trees, while at the seedling level it is in the medium category (Figure 3).
Figure 3. Histogram value of Species Diversity Index (H') in each community based on peat thickness
Species Diversity Index (H') can be stated that the higher the value (H'), the higher the species diversity, ecosystem productivity and ecosystem stability. Ecosystems have regularity as manifestations of the ability of ecosystems to maintain themselves, regulate themselves and naturally hold back balance [40].
Species diversity at all growth levels at all levels of peat thickness was classified as high above >3 except for species diversity at shallow peat thickness and very deep at the seedling level, including medium classification. It is. This is in accordance with the opinion of [40] which states that differences in the composition and structure of the stand making up species are strongly influenced by location and environmental conditions.
3.3 Evenness Index (E)
The evenness index shows a measure of the evenness of the proportion of individuals found in a particular community. The evenness index describes the even distribution of individual vegetation types that make up the community, and describes the stability of a community. To assess the stability or stability of species in a community, the evenness index value can be used. The evenness index value describes the stability of a vegetation, the evenness index value (E) ranges from 0-1, the smaller the E value, the more uneven the distribution of organisms in the vegetation, which is dominated by certain species and conversely, the greater the E value, the species in the vegetation will spread evenly.
The evenness value (E) of vegetation at the study site is presented in Figure 4.
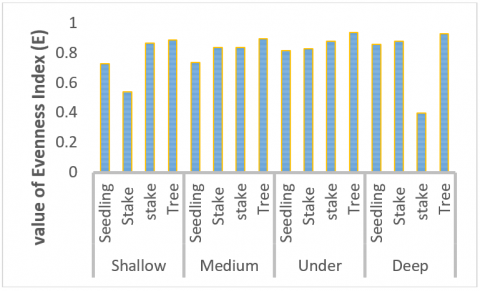
Figure 4 shows that the evenness index value at the peat thickness level of 50-100 cm (shallow) is 0.73 for the seedling level, the sapling level is 0.54; pole level 0.87 and tree level 0.89. The evenness index value at the peat thickness level of 100-200 cm (medium) was 0.74 for the seedling level, the sapling level was 0.84; pole level 0.84 and tree level 0.90. The evenness index based on the level of peat thickness 200-300 cm (deep) is 0.82 for the seedling level, the sapling level is 0.83; pole level 0.88 and tree level 0.94. The evenness index value at the level of peat thickness >300 cm (very deep) was 0.86 for the seedling level, the sapling level was 0.88; pole level 0.83 and tree level 0.93.
Figure 4. Histogram of Evenness Index (E) at each growth level at each peat thickness level
Referring to the study [22] criteria, the evenness index value of all growth rates at various thicknesses of peat in the study area showed the high category (index value > 0.6), except for the sapling level vegetation on shallow peat thickness which was in the medium category. It is suspected that the difference in peat thickness is not significant enough to influence the preference (presence) of the species found in the research location, including the abundance of the number of individuals.
3.4 Specific Richness Index (R)
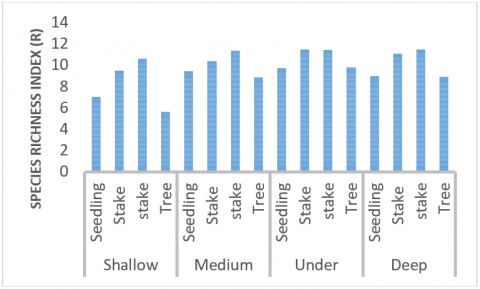
The Specific Richness Index (R) shows the species richness in a community. This index is calculated based on the number of species and individuals in one community. The results of the calculation of the species richness index (R) found in the research area. The value of the species richness index at the study site at each level of peat thickness is presented in Figure 5.
Figure 5. Histogram of Specific Richness Index (R) at each growth level at each peat thickness level
Figure 5, shows that the value of the species richness index for each peat thickness varies. Peat areas with shallow, medium, deep and very deep peat thicknesses included in the species richness index are classified as criteria where the R value > 5.0 is classified as high. At shallow peat the seedling level is 7.05, sapling level is 9.53, pole level is 10.62 and at tree level is 5.66; at medium peat thickness the seedling level is 9.47, the sapling level is 10.4, the pole level is 11.38 and at the tree level is 8.86; the thickness of deep peat at seedling level is 9.74, sapling level is 11.5, pole level is 11.42 at tree level is 9.83; at very deep peat thickness the seedling level was 9.02, sapling level 11.09, pole level 11.5 and at tree level 8.9.
Comparing species richness based on peat thickness level, we get a phenomenon where plant species richness for each growth stage (saplings, saplings, poles and trees) in deep peat thickness is higher than other peat thicknesses. On the other hand, it was found that the value of species richness in shallow peat has the smallest value when compared to other peat thickness levels.
The condition of the forest where the value of species richness is high, as is the case in the research location, it is suspected that the forest community in the Sebangau National Park area has not experienced disturbance in a relatively long time, so that the forest condition is relatively good and the mechanisms that occur in an ecosystem are running well. This situation is in accordance with the opinion of the study [41] who stated that the high level of richness and diversity of species indicates that the food chains in the ecosystem are longer and more numerous because of various relationships that occur such as mutualism, parasitism, commensalism. so that the ecosystem has the ability to increase stability or stability.
3.5 Similarity Index (S)
Species Similarity Index is one of the quantitative parameters to determine the similarity of species in two different sample communities being compared. Therefore, the size of the similarity index value shows the level of similarity of the stands being compared. the closer to 100% the value of similarity between the two communities is, the more the same.
Table 7. Specific Similarity Index (S) in (%) in each peat thickness
|
Growth rate |
Peat thickness |
Peat Thickness |
|||
|
Shallow |
Currently |
In |
Very deep |
||
|
Seedling |
Shallow |
77.88 |
63.06 |
64.76 |
|
|
Currently |
60.29 |
63.08 |
|||
|
In |
57.81 |
||||
|
Very deep |
|||||
|
Stake |
Shallow |
68.15 |
64.79 |
56.92 |
|
|
Currently |
74.21 |
61.22 |
|||
|
In |
67.53 |
||||
|
Very deep |
|||||
|
Pole |
Shallow |
77.24 |
81,12 |
64.79 |
|
|
Currently |
85.00 |
69.18 |
|||
|
In |
75.16 |
||||
|
Very deep |
|||||
|
Tree |
Shallow |
76.40 |
60.87 |
47.62 |
|
|
Currently |
63.92 |
44.94 |
|||
|
In |
82.61 |
||||
|
Very deep |
|||||
The results of the calculation of the similarity index value based on the thickness of peat with various forest conditions briefly the value of S for each condition of peat thickness can be presented in Table 7.
Table 7 shows that the level of peat thickness in the research location based on the species similarity index has a relatively low level of similarity, both at the level of seedlings, saplings, poles and trees with species similarity values ranging from 44.94%-85.00% based on the similarity criteria [42] which suggests that the criteria for species similarity are very high if S > 75%, high similarity if S > 50%-75%, low similarity if S > 25-50%, and very low similarity if S < 25%.
The results showed that at the level of seedlings, saplings, poles and trees the species had high similarity at shallow and medium peat thickness, shallow and deep peat thickness had high and very high species similarity at the pole level, shallow and very deep peat thickness had similar values. high species except at low, medium and deep tree level had high and very high species similarity values at pole level, medium and very deep peat thickness had high species similarity except at low tree level, deep and very deep peat thickness had high species similarity and very high at the level of poles and trees.
3.6 Horizontal stand structure
The horizontal stand structure of vegetation at the study site at 4 (four) levels of peat thickness for all stands depicts the relationship between tree density per hectare and the level of diameter can be presented in Table 8.
Table 8. Tree density in each diameter class at each peat thickness level
|
Diameter Class (cm) |
Density (individual/Ha) |
|||
|
Shallow 50 - 100 cm |
Currently 100-200cm |
In 200-300cm |
Very Deep >300 cm |
|
|
10-19.99 |
696.30 |
659.65 |
569.75 |
597.78 |
|
20-29.99 |
179.17 |
175.00 |
141.67 |
120.00 |
|
30-39.99 |
20.83 |
48.68 |
45.83 |
35.00 |
|
40-49.99 |
29.17 |
7.89 |
11.11 |
8.33 |
|
50-59.99 |
8.33 |
1.36 |
1.39 |
3.33 |
|
60-69.99 |
4.17 |
1.36 |
1.39 |
0 |
|
70-79.99 |
0 |
1.36 |
0 |
0 |
|
>80 |
0 |
1.316 |
1.39 |
0 |
The results showed that the larger the diameter of the tree, the lower the density value. On Table 8, the highest density is in the diameter class 10-19.99 cm, this shows that the larger the diameter, the lower the density. This is in accordance with the statement of studies [43, 44] that the amount of vegetation in a natural forest is inversely proportional to its diameter, i.e., the larger the diameter of the tree, the smaller the number. The decrease in the density value tends to follow the inverted letter "J".
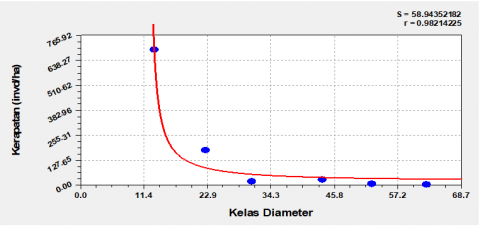
Figure 6 shows a graph of the relationship between stand density and diameter level. The relationship pattern between density and tree diameter class can be observed in all forest community types. The curve in the picture above is the result of the analysis on Software Cure Expert. The results obtained in the Logistic Model curve model have an S value (standard error) of 58.94 and an r value (correlation coefficient) of 0.98. The horizontal structure graph for shallow peat thickness shows that the larger the stand diameter, the smaller the stand density. This is thought to be caused by competition between stands. Stands with large diameters will absorb more nutrients so that the growth of stands with low diameters will be hampered or die. Based on the graph above, it can be seen that there is a significant decrease in the diameter from 10-19 cm to 20-29 cm.
Figure 6. Logistics curve model on horizontal structure of stands at shallow peat thickness level 50 - 100 cm
Overall tree stand structure is the relationship between individual density and the level of tree diameter in the research plot, the distribution of individuals with the level of diameter at the research site. Data presented in Table 8 is then made in the form of a graph of the relationship between stand density and diameter level. The pattern of the relationship between density and tree diameter classes in all forest communities can be presented in Figure 7.
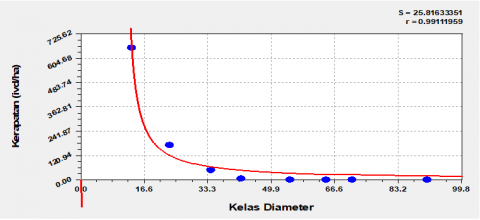
Figure 7. Rational Function Model Curve on Horizontal Structure Stands at Medium Peat Thickness Level 100 - 200 cm
The horizontal structure of the shallow peat thickness stands is like the curve above. The curve formed is the Rational Function model curve, which has an S value of 25.82 and an r value of 0.99. The research plot shows that the number of trees decreases from the level of small diameter to the level of large diameter, so that the shape of the curve characterized by the number of distributions resembles an inverted "J". This indicates that the forest stands in these plots are relatively balanced non-age forests, where the number of individuals decreases with increasing tree diameter.
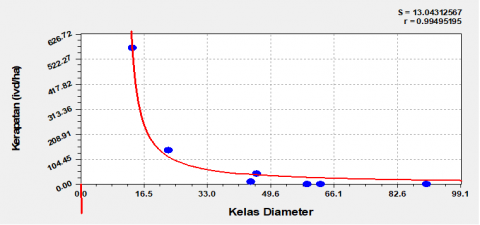
Figure 8, the horizontal stand structure on the thickness of deep peat forms like the curve above. The curve formed is the model curve Rational Function which has an S value of 13.04 and r has the highest value of 0.99 because it is close to 1. The most trees were found at the 10-19 cm diameter level and then decreased at the 40-49 diameter level, the graph increased slightly due to higher tree density.
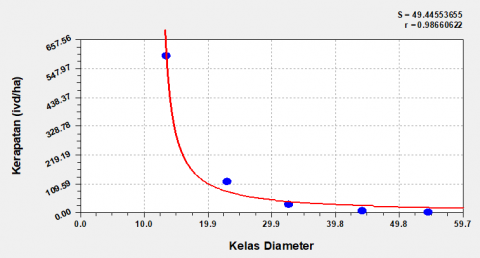
Figure 9, the horizontal stand structure in very deep peat thickness forms like the curve above. The curve formed is the Rational Harris Model which has an S value of 49.44 and r has a value of 0.98. Most trees were found at a diameter of 10-19 cm, the density of the stand structure decreased as the diameter of the stand increased.
Figure 8. Rational function model curves on horizontal standing structures at peat thickness levels within 200 - 300 cm
Figure 9. Harris curve model on horizontal structure of stands at level very deep peat thickness >300 cm
The horizontal structure at the study site based on the thickness of the peat shows almost uniformity which shows the results of the curve forming an inverted “J”. In natural forest stands, the tree density will usually be high at the small diameter level and will decrease at the larger diameter level. This happens because of high competition, both between individuals within a species and between various types, so that not all individuals have the opportunity to grow well, even though they do not die.
Hidayat et al. [45] found a horizontal structure pattern of stands like this in their research where the horizontal structure model of stands formed an inverted “J” pattern. The shape of the curve like this is in accordance with that described by Hidayat et al. [45] for non-age forests, which stated that non-age forests generally have at least three different age classes and usually have gaps in the distribution of diameter classes.
This pattern with an inverted J-shaped curve shows that the number of trees (tree density) is more spread out in the trees with the smallest diameter class and the number decreases more or less in proportion to the increase in size, so that in the end it is only spread slightly in the trees that are larger in size. The formation of such a pattern according to Hidayat et al. [45] this was due to the fact that the stands were not of the same age and had erratic reproduction due to the opening of seeds and climatic conditions. Trees in each age class grow at different rates according to the availability of light and nutrients.
The research findings suggest that the dominant plant species differ based on the thickness of peat, with varying species dominating in shallow, medium, deep, and very deep peat thickness. Specifically, Cratoxylum arborescens, Syzygium sp.1, and Elaeocarpus parvifolius are dominant in shallow peat thickness, while Syzygium sp.1, Elaeocarpus parvifolius, and Cratoxylum arborescens dominate in medium peat thickness, and Syzygium sp.1, Elaeocarpus parvifolius, and Campnosperma coriaceum are dominant in deep and very deep peat thickness. In terms of vegetation diversity, the study classified it as moderate at the seedling level in shallow and very deep peat thickness, but high at the sapling, pole, and tree levels. Across all levels of peat thickness, species richness and evenness were high. Moreover, the horizontal structure at the research site, across all levels of peat thickness, forms an inverted "J" curve, indicating that the density of trees decreases as their diameter increases.
This research can be considered innovative and relevant because it focuses on analyzing the composition, structure, and species diversity of vegetation in Sebangau National Park based on peat thickness. Some factors that can be characteristics of the novelty and innovation of this research are the holistic analysis approach where this research analyzes various aspects of vegetation, including plant species composition, stand structure, and species diversity, as well as how peat thickness affects these aspects. This holistic analysis approach provides a completer and more accurate picture of the relationship between vegetation and peat thickness. The practical implications of this research provide insights and understanding of the composition, structure, and species diversity of vegetation in Sebangau National Park. This research also provides practical implications for peat-based forest management and conservation in the region. These practical implications can help decision-makers in implementing sustainable forest management and conservation programs. Thus, this research can be considered innovative and relevant because it provides new contributions to the understanding of vegetation and peat thickness in Sebangau National Park, as well as providing practical implications that can be applied to natural resource management and conservation in the region.
We would like to express our utmost gratitude to the management of Sebangau National Park and related parties for providing us, the research team, with the opportunity to conduct research there. Without the support and assistance given, this research would not have been possible. We are very grateful for the excellent cooperation and facilities provided during our research in Sebangau National Park. We hope that our collaboration can continue and have a positive impact on the management and conservation of natural resources in the region.
[1] Yulianti, N., Hayasaka, H. (2013). Recent active fires under El Niño conditions in Kalimantan, Indonesia. American Journal of Plant Sciences, 4(3A): 685-696. https://doi.org/10.4236/ajps.2013.43a087
[2] Jusoff, K., Hassan, C.H., Hamzah, K.A. (2007). Tropical peat swamp forest ecosystem and floristic diversity in Pahang, Malaysia. International Journal of Systems Applications Engineering and Development, 3: 41-44.
[3] Gunawan, H., Kobayashi, S., Mizuno, K., Kono, Y. (2012). Peat swamp forest types and their regeneration in Giam Siak Kecil-Bukit Batu Biosphere Reserve, Riau, East Sumatra, Indonesia. Mires & Peat, 10.
[4] Mulyani, R.B., Sastrahidayat, I.R., Abadi, A.L., Djauhari, S. (2014). Exploring ectomycorrhiza in peat swamp forest of Nyaru Menteng Palangka Raya Central Borneo. Journal of Biodiversity and Environmental Science, 5(6): 133-145.
[5] Noorollahi, Y., Taghipour, S., Sadrnejad, A. (2019). Geothermal energy for natural gas compressor stations; an environmental and economical assessment. Environmental Energy and Economic Research, 3(4): 261-277. https://doi.org/10.22097/eeer.2019.185174.1082
[6] Kadir, A., Suharno, Reawaruw, Y., Komari, Mahuze, A. (2022). Ethnobotanical knowledge of Marind-Anim Tribe in utilizing sago (Metroxylon sagu) in Merauke, Papua, Indonesia. Biodiversitas, 23(1): 264-272. https://doi.org/10.13057/biodiv/d230132
[7] Chenchouni, H. (2017). Edaphic factors controlling the distribution of inland halophytes in an ephemeral salt lake “Sabkha ecosystem” at North African semi-arid lands. Science of the Total Environment, 575: 660-671. https://doi.org/10.1016/j.scitotenv.2016.09.071
[8] Basyuni, M. (2019). Plant species diversity and cluster analysis in difference logged-over peat swamp forests in Riau, Indonesia. In IOP Conference Series: Earth and Environmental Science, 284(1): 012022. https://doi.org/10.1088/1755-1315/284/1/012022
[9] Wösten, J.H.M., van den Berg, J., van Eijk, P., Gevers, G.J.M., Giesen, W.B.J.T., Hooijer, A., Idris, A., Leenman, P.H., Rais, D.S., Siderius, C., Silvius, M.J., Suryadiputra, N., Wibisono, I.T. (2006). Interrelationships between hydrology and ecology in fire degraded tropical peat swamp forests. International Journal of Water Resources Development, 22(1): 157-174. https://doi.org/10.1080/07900620500405973
[10] Houlihan, P.R., Harrison, M.E., Cheyne, S.M. (2013). Impacts of forest gaps on butterfly diversity in a Bornean peat-swamp forest. Journal of Asia-Pacific Entomology, 16(1): 67-73. https://doi.org/10.1016/j.aspen.2012.10.003
[11] Giesen, W., Wijedasa, L.S., Page, S.E. (2018). Unique Southeast Asian peat swamp forest habitats have relatively few distinctive plant species. Mires and Peat, 22: 1-13. https://doi.org/10.19189/MaP.2017.OMB.287
[12] Arifin, Y.F., Hamidah, S., Hatta, G.M. (2021). Comparison of the Flavonoid Contents of Bajakah Plants from Tropical Forest in Kalimantan, Indonesia. Journal of Hunan University Natural Sciences, 48(8): 22-26.
[13] Könönen, M., Jauhiainen, J., Straková, P., Heinonsalo, J., Laiho, R., Kusin, K., Limin, S., Vasander, H. (2018). Deforested and drained tropical peatland sites show poorer peat substrate quality and lower microbial biomass and activity than unmanaged swamp forest. Soil Biology and Biochemistry, 123: 229-241. https://doi.org/10.1016/j.soilbio.2018.04.028
[14] Nuraina, I., Fahrizal, Prayogo, H. (2018). Struktur dan komposisi vegetasi pohon. Jurnal Hutan Lestari.
[15] Maridi, M., Saputra, A., Agustina, P. (2015). Analisis Struktur Vegetasi di Kecamatan Ampel Kabupaten Boyolali. Bioedukasi: Jurnal Pendidikan Biologi, 8(1): 28-42. https://doi.org/10.20961/bioedukasi-uns.v8i1.3258
[16] Fathoni, A., Rohman, F., Sulisetijono, S. (2021). Karakter komunitas pohon area sekitar sumber mata air di malang raya, Jawa Timur. Biotropika: Journal of Tropical Biology, 9(1): 69-79. https://doi.org/10.21776/ub.biotropika.2021.009.01.08
[17] French, D.D., Ludwig, J.A., Reynolds, J.F. (1989). Statistical ecology: a primer on methods and computing. The Journal of Applied Ecology. https://doi.org/10.2307/2403729
[18] Rahayu, A.P., Saad, M., Fanni, N.A. (2021). Analysis of Plankton abundance and status of water quality fish cultivation “sawah tambak” with overtime system in Kalitengah subdistrict, Lamongan regency. Advances in Tropical Biodiversity and Environmental Sciences. https://doi.org/10.24843/atbes.2021.v05.i01.p03
[19] Khalid, S., Ahmad, M.S., Ramayah, T., Hwang, J., Kim, I. (2019). Community empowerment and sustainable tourism development: The mediating role of community support for tourism. Sustainability (Switzerland). https://doi.org/10.3390/su11226248
[20] Eisawi, K.A., He, H., Shaheen, T., Yasin, E.H. (2021). Assessment of Tree Diversity and Abundance in Rashad Natural Reserved Forest, South Kordofan, Sudan. Open Journal of Forestry, 11(01): 37. https://doi.org/10.4236/ojf.2021.111003
[21] Pielou, E.C., Routledge, R.D. (1976). Salt marsh vegetation: latitudinal gradients in the zonation patterns. Oecologia, 24: 311-321. https://doi.org/10.1007/BF00381137
[22] Magurran, A.E. (1988). Ecological Diversity and Its Measurement. In Ecological Diversity and Its Measurement. https://doi.org/10.1007/978-94-015-7358-0
[23] Chao, A., Chazdon, R.L., Colwell, R.K., Shen, T.J. (2006). Abundance‐based similarity indices and their estimation when there are unseen species in samples. Biometrics, 62(2): 361-371. https://doi.org/10.1111/j.1541-0420.2005.00489.x
[24] Mirdat, J., Anwari, S., Ardian, H. (2017). Keanekaragaman Jenis Vegetasi Penyusun Hutan Sekunder Desa Tanjung Bunut Kecamatan Tayan Hilir Kabupaten Sangggau. Jurnal Hutan Lestari.
[25] Atmoko, T., Hut, S. (2021). Pertumbuhan semai shorea balangeran (korth.) burck pada berbagai intensitas cahaya. Jurnal Penelitian Kehutanan Sumatrana, 2(1): 49-57. https://doi.org/10.20886/jpks.2021.2.1.49-57
[26] Dumas, P. (2019). Policy and regulatory aspects of geothermal energy: A European perspective. Lecture Notes in Energy, 67: 19-37. https://doi.org/10.1007/978-3-319-78286-7_2
[27] Charman, D.J., Beilman, D.W., Blaauw, M., et al. (2013). Climate-related changes in peatland carbon accumulation during the last millennium. Biogeosciences, 10(2): 929-944. https://doi.org/10.5194/bg-10-929-2013
[28] Sivarajah, S., Smith, S.M., Thomas, S.C. (2018). Tree cover and species composition effects on academic performance of primary school students. PLoS One, 13(2): e0193254. https://doi.org/10.1371/journal.pone.0193254
[29] Kooch, Y., Bayranvand, M. (2017). Composition of tree species can mediate spatial variability of C and N cycles in mixed beech forests. Forest Ecology and Management, 401: 55-64. https://doi.org/10.1016/j.foreco.2017.07.001
[30] Bueno, M.L., Dexter, K.G., Pennington, R.T., Pontara, V., Neves, D.M., Ratter, J.A., de Oliveira‐Filho, A.T. (2018). The environmental triangle of the Cerrado Domain: Ecological factors driving shifts in tree species composition between forests and savannas. Journal of Ecology, 106(5): 2109-2120. https://doi.org/10.1111/1365-2745.12969
[31] Ao, A., Changkija, S., Tripathi, S.K. (2021). Stand structure, community composition and tree species diversity of sub-tropical forest of Nagaland, Northeast India. Tropical Ecology, 62(4): 549-562. https://doi.org/10.1007/s42965-021-00170-5
[32] Hossain, M. A., Hossen, S., Akhter, J. (2018). Quantifying diversity and composition of tree species in Satchari National Park, Bangladesh. Int J Usuf Mngt, 19: 15-23.
[33] Allen, M.F. (2007). Mycorrhizal fungi: Highways for water and nutrients in arid soils. Vadose Zone Journal, 6(2): 291-297. https://doi.org/10.2136/vzj2006.0068
[34] Hinsinger, P., Brauman, A., Devau, N., Gérard, F., Jourdan, C., Laclau, J.P., le Cadre, E., Jaillard, B., Plassard, C. (2011). Acquisition of phosphorus and other poorly mobile nutrients by roots. Where do plant nutrition models fail? In Plant and Soil, 348(1-2): 29-61. https://doi.org/10.1007/s11104-011-0903-y
[35] Judd, L.A., Jackson, B.E., Fonteno, W.C. (2015). Advancements in root growth measurement technologies and observation capabilities for container-grown plants. Plants, 4(3): 369-392. https://doi.org/10.3390/plants4030369
[36] Parnell, J.A.N., Craven, L.A., Biffin, E. (2007). Matters of scale: dealing with one of the largest genera of angiosperms. In Reconstructing the tree of life: taxonomy and systematics of species rich taxa. CRC Press LLC. https://dx.doi.org/10.1201/9781420009538
[37] Indrajaya, Y., Yuwati, T.W., Lestari, S., et al. (2022). Tropical Forest Landscape Restoration in Indonesia: A Review. Land, 11(3): 1-37. https://doi.org/10.3390/land11030328
[38] Lu, B., He, Y., Tong, A. (2015). Evaluation of spectral indices for estimating burn severity in semiarid grasslands. International Journal of Wildland Fire, 25(2): 147-157. https://doi.org/10.1071/WF15098
[39] Zhang, J., Finley, K.A., Johnson, N.G., Ritchie, M.W. (2019). Lowering stand density enhances resiliency of ponderosa pine forests to disturbances and climate change. Forest Science, 65(4): 496-507. https://doi.org/10.1093/forsci/fxz006
[40] Kaliele, Y., Ponisri, P. (2017). Keanekaragaman Jenis Tumbuhan Kantong Semar (Nepenthes Spp.) Pada Taman Wisata Alam Bariat Kabupaten Sorong Selatan. Median: Jurnal Ilmu Ilmu Eksakta, 9(2): 1-8. https://doi.org/10.33506/md.v9i2.16
[41] Clementi, M., Fontana, C. (2019). The systemic approach in sustainable environmental planning: references to the ecology of living systems. TECHNE-Journal of Technology for Architecture and Environment, 143-151. https://doi.org/10.13128/Techne-24027
[42] Djufri, D. (1970). Vegetation analysis of spermatophyte in taman hutan raya (Tahura) seulawah, aceh besar. Biodiversitas Journal of Biological Diversity, 4(1): 30-34. https://doi.org/10.13057/biodiv/d040106
[43] Borkowski, J., Banul, R., Jurkiewicz, J., Hołdyński, C., Świeczkowska, J., Nasiadko, M., Załuski, D. (2019). High density of keystone herbivore vs. conservation of natural resources: Factors affecting red deer distribution and impact on vegetation in Słowiński National Park, Poland. Forest Ecology and Management, 450: 117503. https://doi.org/10.1016/j.foreco.2019.117503
[44] Istanbulluoglu, E., Tarboton, D.G., Pack, R.T., Luce, C.H. (2004). Modeling of the interactions between forest vegetation, disturbances, and sediment yields. Journal of Geophysical Research: Earth Surface, 109(F1): 1-22. https://doi.org/10.1029/2003JF000041
[45] Hidayat, T., Burhanuddin, Fahrizal. (2017). The composition and structure of peat swamp forest secondary vegetation in the Sungai Besar village of the regency Ketapang. Jurnal Hutan Lestari, 5: 889-897.