Olanrewaju I. Oludare![]() | Rasaq A. Kazeem
| Rasaq A. Kazeem![]() | Adedayo S. Adebayo
| Adedayo S. Adebayo![]() | Adetokunbo A. Awonusi*
| Adetokunbo A. Awonusi*![]() | Ademola A. Dare
| Ademola A. Dare![]() | Omolayo M. Ikumapayi
| Omolayo M. Ikumapayi![]() | Bernard A. Adaramola
| Bernard A. Adaramola![]()
© 2023 IIETA. This article is published by IIETA and is licensed under the CC BY 4.0 license (http://creativecommons.org/licenses/by/4.0/).
OPEN ACCESS
The effects of landslide disasters are extremely severe, resulting in significant economic damage and a high number of fatalities on a global scale. In the event of a disaster of this magnitude, a swift and reliable disaster information is crucial. This is usually very tasking activities and expensive using proprietary application and data. This study therefore demonstrates the usability of opensource application and free satellite data on an assessment of earthquake induced landslide using data and applications sourced from European Space Agency (ESA) Copernicus Open Access Hub. A Differential Interferometric Synthetic Aperture Radar (DInSAR) technique, which is more advanced earthquake assessment tool was used to obtain morphological changes via-a-vis the vertical displacement produced during Gorkha earthquake of April 25, 2015, in Nepal. In the study, a single interferogram of the two repeat pass SAR data for a DInSAR process was applied over an area of 128 km2. A pair of SAR image with a temporal baseline of 144 days and perpendicular baseline of 122.51 meters were used. Three landslide locations were evaluated. The vertical displacements using DInSAR ranges from -0.23 (moving away from satellite) to 0.24 m (movement towards satellite). The simulated morphological values compared well with obtained google earth images captured at during the period of the disaster event.
landslide, InSAR, SAR, DInSAR, earthquake, disaster management
Landslide disasters have resulted in high number of deaths and massive economic losses in places vulnerable to these risks. Because of these developing concerns, various studies have been conducted to study this hazard on both a local and worldwide basis [1-3]. Landslides are generally caused by anthropogenic (technical slope cutting, mineral exploration, land usage, settlement growth in steep areas) and natural (volcanic activities, seismic activities, water) forces [4]. The amount to which these elements interact determines the size and dispersion of the landslide [5]. Although engineers and scientists have contributed numerous published papers throughout the years on the detection, control, and development of resistance against the effects of landslides [2, 6-8], it is generally understood that acquiring trustworthy disaster information is essential for effective landslide disaster management and prevention [3, 5, 7, 9, 10]. This has necessitated efforts in developing technologies for information gathering. The use of satellite technologies has now progressed from the first military activities that were initiated by the US army to remotely sensed for meteorological and geotechnical applications, to name a few, to research natural hazards [11]. In the past few years, landslide disaster data has been obtained more frequently using remote sensing devices, particularly the use of Synthetic Aperture Radar (SAR), a key component in the study's topic [12-16]. This is a change from the earlier, more conventional method of conducting measurement techniques and findings [1, 11]. More importantly, many factors, including their wider reach, reproducibility, practical application over inaccessible areas, high resolution, and widely accessible data—often for no cost—have been linked to the growing use of remotely sensed information for landslide hazards studies [1, 9, 17-19].
In addition to the expanding use of remote sensing, more Earth Observatory Satellites (EOS) have been launched in latest years, providing access to unprecedented records that will aid researchers, policymakers, disaster managers, scientists, and engineers concerned with landslides studies [20-25] Increased knowledge and well-informed decision-making in the occurrence of a landslide as well as other natural hazards have resulted from this. For instance, the Copernicus Open Access Hub, formerly known as the Sentinels Scientific Data Hub, is one of the many organizations that are providing free Sentinel satellite data based on open and free source initiative [26, 27]. The Sentinel-1A and Sentinel-B satellite constellation that makes up the ESA satellite offering C-band radar imaging of the earth's surface. It is possible to scan the same area of the earth's surface every six days with the operation of the two satellites (re-visit period). It uses a special scanning method called Terrain Observation by Progressive Scan (TOPS), which covers a greater region with resolutions of 3.5 meters for range (radar side scanning) and 14 meters for azimuth look (along flight direction radar scanning). It is appropriate for ground observation for landslide investigations because of these characteristics [10]. Several studies have been conducted using complex applications, which frequently demand significant funding to better understand landslide events. Dai et al. [10] used TOPS Sentinel-1A imagery to examine the current behaviour of the Daguangbao landslide using the TS-InSAR integrated Atmospheric Estimation Model (TSInSAR AEM). Even eight years after the Wenchuan earthquake, Sentinel-1 time-series results suggest that some parts of the Daguangbao landslide are still operational with four sliding zones and demonstrating a maximum deflection rate of 8 cm/year. Yamada [28] utilized the JERS-1/SAR data to identify a flood-affected area in Thailand's central plain which has a connection to micro-geomorphology. Both the geomorphological maps and SAR data may be used to quantify the agricultural damage caused by flood as well as landslide. Dong et al. [29] employed ALOS-2 PALSAR-2 and Sentinel-1 datasets to measure the precursory motions of the historic Xinmo landslide in Mao County, China. At the selected location, the greatest displacement rate measured was 35 mm/year along the radar line of sight direction. Moreover, Smail et al. [30] used interferometric syn-thetic aperture radar technologies to locate and monitor earthquake-induced landslides as well as lands prone to landslides by locating deformations in earthquake-affected areas. The Mila region of Algeria, which experienced substantial landslides and structural damage, is the subject of the pilot study region. While no pre-event geotechnical precursors were found by the displacement time-series analysis of 224 interferograms (from April 2015 to September 2020) carried out using LiCSBAS, the post-event analysis revealed a 110 mm yr-1 subsidence velocity in the rear slope of Kherba. Based on the merging of C- and L-band SAR measurements, Liu et al. [31] devised a new method for estimating 3D and long-term displacement time - series data of landslides. This technique was used to map the 3D and long-term displacements (nearly 12 years) of landslides in Gongjue County, Tibet, China; four sets of SAR images from various platforms (C-band descending ENVISAT, L-band ascending ALOS/PALSAR-1, and C-band ascending and descending Sentinel-1 SAR datasets) were obtained and utilised from January 2007 to November 2018. In addition, Tzouvaras et al. [32] used the DInSAR technology to detect two separate landslide incidents caused by significant rainfall in Limassol and Paphos Districts in February 2019. Six co-event interferometric Synthetic Aperture Radar (SAR) pairs were utilised to generate displacement maps in the vertical and east-west directions in order to investigate the ensuing slope deformations.
However, using freely available satellite data sources, landslides can be researched, and trustworthy landslide disaster information can be gathered for little, or no money as demonstrated in this study. As a result, the goal of this study is to assess the reliability of coseismic landslides detection using opensource data from sentinel-1 satellite obtained through the ESA Copernicus Open Access Hub. Free Sentinel-1 satellite data from the ESA through its free and opensource sentinel data policy framework was used to detect identifiable landslides that were caused by the Gorkha earthquake of Nepal on April 25, 2015.
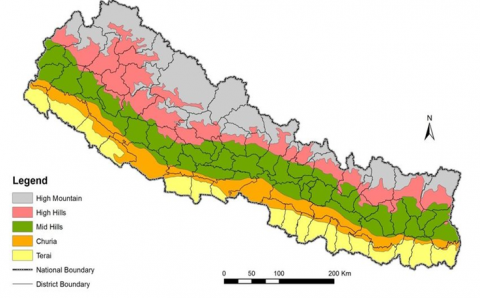
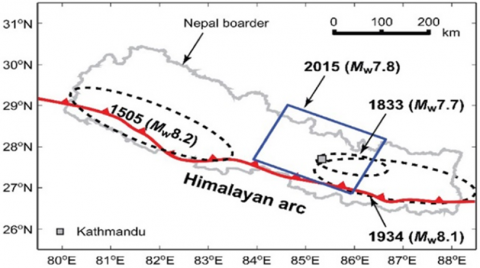
Nepal is in Southern Asia, at the southernmost tip of the Himalayan Mountain region. It is bounded to the west, south, and east by India, and the north by China's Tibet area. Nepal is rectangular, about 128 kilometres (80 miles) broad and 80 kilometres (550 miles) long, with Kathmandu being its capital (Figure 1). The mountain regions, most notably Mount Everest, are situated along the northern boundary. The country has a land area of approximately 147,181 km2 and a population of 26 million people [33]. Nepal's seismicity is influenced by its placement along the active Main Himalayan Thrust (MHT) arc, where the subduction zones Indian plate interacts with the over-riding Eurasian plate [34-37]. This structure has a significant impact on the seismicity of the region, causing Nepal to endure severe earthquakes with magnitudes in the order of Mw of 8.5 in the past [38-41]. According to Goda et al. [42], a Mw of 7.8 earthquake struck the Lamjung district on April 25, 2015, which is located in a distance 81 kilometers north-west of Kathmandu (see Figure 2), the nation's capital, and was followed by multiple aftershocks, including a Mw of 7.3 event on May 12, 2015 [43]. This incident left 18500 injured, 8500 persons dead, and other casualties in neighboring Bangladesh, India, and China countries [44-47]. The causative fault was determined as shallow striking and dipping fault with offset of 2 – 4 m. The hypocentral depth of the earthquake was calculated as 15 km, at a distance of 150 km east and south of the epicenter [44, 48].
Figure 1. Map of the five physiographic divisions of Nepal [38]
Figure 2. Historical earthquake location and magnitude of the Nepalese earthquake that struck Gorkha on April 25, 2015
Through the ESA's Copernicus initiative, free satellite information services and data are available through its Data and Information Services (DIAS) or the Conventional Data Hub (Copernicus Open Access Hub) [49, 50]. For all users, especially those in the European Union, the Copernicus Open Access Hub offers an interactive Graphic User Interface (GUI) for obtaining Sentinel data. Before access is provided, a user registration process that can take a week must be completed. SNAP is a component of Scientific Toolbox Exploitation (STEP), a project the ESA and Brockmann Consult collaboratively developed with assistance from Array systems computing for satellite data processing. The application is free source, and it contains a discussion forum where users can ask and answer questions about using SNAP. The processing carried out in this investigation was done using SNAP version 6.0.
3.1 SAR coverage area
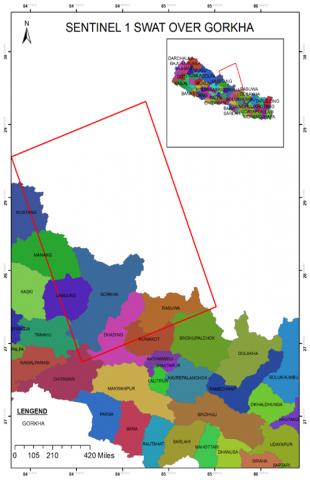
Figure 3. The coverage swat of two Sentinel-1 SAR images
As shown in Figure 3, the SAR image pair acquired by the Sentinel-1 satellite for this investigation includes the regions of Manang, Lamjung, Kaski, Gorkha, and Dhading. The Churia, middle, and a portion of the High Hills are traversed by the SAR swat in the Nepali region. This is located in a high-altitude mountainous area where the likelihood of an earthquake-caused landslide is considerable.
3.2 Sentinel-1 data acquisition
For this study, seven Sentinel-1 (IW) SLC products of SAR pictures were retrieved. Every data set has an average size of 3.0 GB, and all of the polarizations are Vertical Vertical (VV). To guarantee compatible and accurate coregistration, the selection factor such as the polarization, relative orbit number, product type, temporal and perpendicular baseline value, and sensor mode variable are carefully chosen. It should be noted that although these satellite images are made accessible upon request, they are not frequently downloadable at an instance. As a result, each requested product data takes an average of one working day to become available for download. This period may occasionally increase, especially in cases of service problems or website outages.
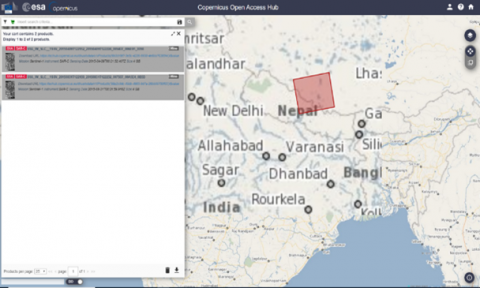
To determine which image pair is co-registrable, had the least perpendicular and temporal baseline values, trial combinations of image pairs from the seven downloads were performed. According to Jebur et al. [3], Massonnet and Feigl [48], Guzzetti et al. [5], and Schlögel et al. [51], this phase is essential for quality assurance to select a preferred pair with the lowest perpendicular and temporal baseline). The SAR pair's perpendicular baseline is 122.51 meters, and its temporal baseline is 144 days. For In-SAR/DInSAR research, high levels of this variable have allegedly been used [1]. Additionally, Singhroy et al. [52] conducted InSAR on two SAR images with a temporal baseline of up to 736 days producing a high coherence value, whereas Mondini et al. [49] employed a temporal baseline of 288 days. Values lower than the result used in this study could have been preferable if data availability throughout the time of the earthquake was not a constraint. It was recognized that a greater perpendicular and temporal baseline limit the accuracy of InSAR/DInSAR processing or provide no result at all. The image pair must overlap over the selected Area of Interest (AOI) in Nepal, which is another crucial factor (Figure 4). This is not a constraint because there is a common overlapping area between two SAR images over an AOI. Table 1 shows the information of the two overlapping SAR images.
Figure 4. The location of the two overlapping SAR images used for the InSAR and DInSAR processing
Table 1. Information of the two overlapping SAR images
|
Item |
Sentinel-1 |
Sentinel-2 |
|
Product |
S1A_IW_SLC__1SSV_20150409 |
S1A_IW_SLC__1SSV_20150831 |
|
Mission |
Sentinel-1A |
Sentinel-1A |
|
Product Type |
SLC |
SLC |
|
Processed Time |
09-APR-2015 19:06:04 |
31-AUG-2015 18:52:55 |
|
Acquisition Mode |
IW |
IW |
|
Pass Direction |
Ascending |
Ascending |
|
Polarization |
V/V |
VV |
3.3 SAR pre-processing steps
TOPSAR split and orbit file application
The Interferometric Wide (IW) acquisition mode was chosen for the ground processing system in this investigation out of the four acquisition modes available on the Sentinel-1 satellite. Three sub-swaths, designated IW3, IW2, and IW1, each consisting of nine bursts, make up an IW mode swath. The TOPSAR split makes it possible to choose between overlapping AOI in a sub-swath, a whole swath, or inside the bursts. The IW1 sub-overlapping swath's bursts 1 to 3 were chosen for this study because it was dis-covered that they overlapped Nepal's mountain ranges, where landslides on downhill slopes are more prone to occur. The image is then processed with an exact orbit file to provide precise data on satellite position and velocity. The orbit state vector of the metadata for the collected SAR product is updated by the accurate orbit file. This is often accessible days to weeks following the SAR product's creation. When using a written operator to do the processing and generate the spitted orbit data, this processing can be applied to the two images either simultaneously or separately.
3.4 SAR processing steps
3.4.1 Coregistration and interferogram generation
Using a back-geocoding operator to resample the slave picture to match the shape of the master image, two split orbit SAR images were coregistered to generate a single-master stack. This is accomplished utilizing a specified external DEM, and the study employed an SRTM 3Sec HGT automatic download DEM. The back-geocoding operator also cleans up the SAR picture pair to remove distortion brought on by the area's geometry. A tiny data block in the middle of the burst was then used to calculate a fixed range offset for each burst, and then an ESD approach was used to estimate a fixed azimuth portion. A series of images called an interferogram, which depends on the terrain displacement, acquisition shape, and atmospheric homogeneities, was created. According to Massonnet et al. [48], the displacement stage part, topographic stage part, flat-earth stage part, and atmospheric stage part all contribute to the total interferometric stage input. The black line within the burst that carries overlapping data between every burst in both azimuths look, and range look was then removed using TOPSAR Deburst.
Due to the removal of this overlapping line, the burst information was continuously covered. Surface targets are divided into square pixels in any collected SAR image, depending on the spatial resolution of the satellite's image acquisition mode. A two-dimensional complex value image known as a SAR image is created using the average values for the amplitude (A) and phase (ϕ) of the microwave signals reflected from within each pixel as indicated mathematically in Eq. (1) [53, 54].
$S=A e^{-j \phi}=A e^{-j \frac{4 \pi}{\lambda} r}$ (1)
where, S represent the measured complex signal of a SAR image, A is the amplitude, jϕ the recorded phase and r is the distance in slant range direction between the sensor and a certain scatterer [55]. If S1 and S2 be the received signal of two satellite positions. The first image (S1), is known as master image (pre-event), and the second image (S2) is known as slave image (post-event). Therefore, S1 and S2 are given by Eqns. (2) and (3). After registration, the two complex SAR images were multiplied, and the interferometric phase was obtained using Eq. (4).
$S_1=A_1 e^{-j \frac{4 \pi}{\lambda} r_1}$ (2)
$S_2=A_2 e^{-j \frac{4 \pi}{\lambda} r_2}$ (3)
$S_1 S_2=A_1 A_2 e^{-j \frac{4 \pi\left(r_1-r_2\right)}{\lambda}}$ (4)
3.4.2 Differential interferogram, phase unwrapping, and displacement map generation
Differential SAR Interferometry is a technique addressed to measure the Earth surface displacements with centimetric accuracy. The interferometric phase is computed by applying Eq. (5). The SRTM 3Sec HGT auto download DEM was used in the DInSAR encased phase processing to remove the topographic stage input and provide an interferogram that only exhibits displacement. The Multi look driver then eliminates spectrum noise, resulting in an image pixel with a square form (this improves the resolution of the image). As a crucial stage in the stage unfolding process, a Goldstein filtering operator was used to lower the phase noise. Using a Minimum Cost Flow (MCF) method, SNAPHU software conducted a 2-D phase unwrapping. The Linux-based application SNAPHU, which is not included with the SNAP software, needs to be programmed using the command line. The DInSAR encased stage was exported using the SNAPHU Export tool to an external location, where SNAPHU was used to uncover the stage using a command line action. After being loaded into SNAP, the outcome of the SNAPHU unwrapped stage was transformed into deformation.
$\Delta \phi=\phi_f+\phi_{T o p o}+\phi_{D i s p l}+\phi_{A t m}+\phi_{E r r}+2 N \pi$ (5)
where, ϕf=Flat earth, ϕTopo=Topographic phase, ϕDis=Deformation phase, ϕAtm=Atmospheric phase and ϕErr=Noise (error phase)
3.4.3 Terrain correction of InSAR coherence, differential interferogram, and displacement map
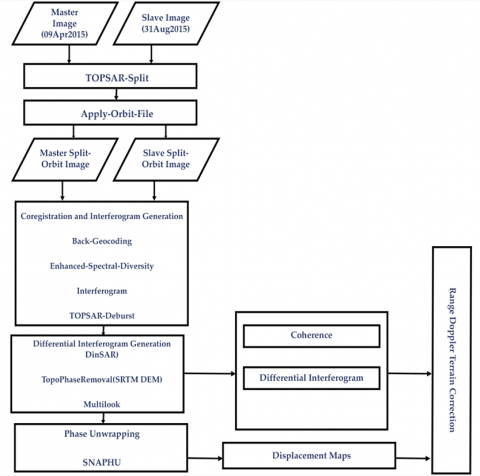
To counteract the erroneous effects of terrain on satellite tilt and backscatter readings, a Range Doppler Terrain correction was carried out. Using reference DEM data and an external exact orbit to obtain specific geolocation information allows for the removal of these aberrations. This process is applied to the differential interferogram, displacement map, and coherence to perfectly export them for viewing on a google earth map. Figure 5 depicts the total process flow for the technique segment.
3.5 Validation of the displacement map
Following the Gorkha earthquake on April 25, 2015, the terrain-corrected deformation map was superimposed on a Google Earth image that had coseismic landslides recorded. The position of the landslides on the google street view image matched the area in which the displacement map showed there was substantial change distant from the satellite camera. On Google Street View, three landslides were found, verified, and their volume approximated. By determining the total area of the landslide shape and subtracting the area corresponding to uplift or no distortion from it using the measurement tool in Google maps, the resulting area relating to landslide displacement can be determined. The number of materials that have been moved was then determined by multiplying the resulting area by the height value that represents the amount of movement away from the satellite camera (subsidence), as determined by the dis-placement legend.
Figure 5. Process diagram of the master and slave SAR images
The outcomes of the two Sentinel-1 SAR data utilized in this study are InSAR Coherence map, DInSAR phase map, DInSAR displacement map, Google Earth image provided. The main processing results that are pertinent to demonstrating the goal of this study are these maps. Additionally, important parameters found in these maps will be recorded along with their importance to the study's goal. Three different landslides from the DInSAR displacement map that were verified with Google Earth images after the earthquake are shown in this section.
4.1 Google earth location map of study area following the Nepal earthquake
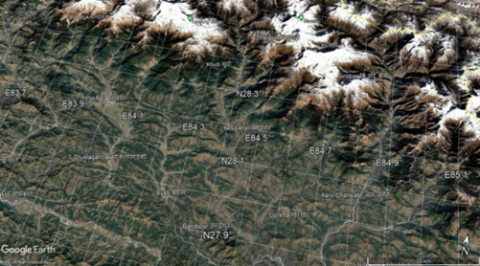
Figure 6 displays a google earth image of Gorkha and the high highlands districts of Nepal. The region is extremely forested in some areas, and the geographical location varies from low to high relief, as can be seen in the image. Natural vegetation implies that it might be difficult to produce high-quality interferograms since short-wavelength SAR, such as that of Sentinel-1 used in this investigation, has a poor penetration depth on vegetation [56]. Additionally, the effect of topography may have prevented radar illumination from reaching some areas of the research region, therefore the authors anticipate that the displacement map may contain missing data [56, 57]. Three yellow place markers on the google map show the locations of the specified landslides that were utilized in this research. The DInSAR phase map, geo-coded InSAR coherence, and DInSAR displacement map are overlaid on google earth to highlight the research area's size.
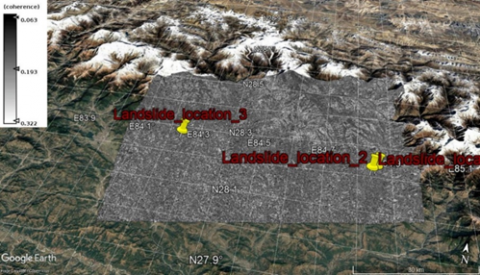
4.2 Terrain corrected InSAR coherence map
Figure 7 depicts the spatial variance of coherence estimation over the research region as depicted by the coherence scale. Furthermore, the coherence result achieved across the research region is satisfiable according to Schlögel et al. [51] and Singh et al. [56] who employed and so advocated 0.3 as the minimal coherence value. The overall low coherence value in the map, particularly in the low land region, could be attributable to natural vegetation, as seen by the backdrop Google Street view image. Hill shading generated by high regions inhibiting radar influence over low territories could be another factor contributing to low coherence, particularly in the low land region. Additionally, noteworthy is this effect in the landslide researched by Rosen et al. [58] and Franceschetti and Lanari [57].
Figure 6. Google earth image of Gorkha and the high hills region of Nepal captured on the 5th of May 2015
Figure 7. Coherence map overlain on a google earth map showing bright (high coherence) and dark (low coherence) region of the study area in Nepal
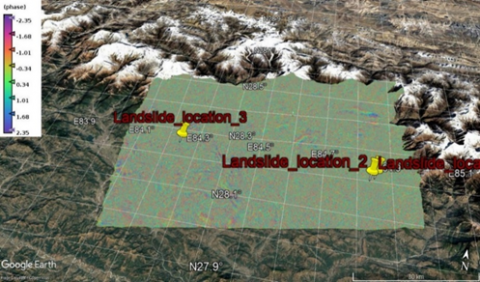
Figure 8. Map showing DInSAR phase value range the over study area of Nepal
4.3 DInSAR phase map generated from the two coregistered SAR images
The stage value spectrum of the obtained DInSAR map, shown in Figure 8, is -2.35 to +2.35. Inferentially, a positive phase value in a DInSAR interferogram denotes subsidence, while a negative sequence value denotes the buildup of earth material [51]. However, due to the difficulties of employing SAR in a forested and mountainous identification of such environment, which results in noisy interferograms, this interferogram is not sufficiently clear. Due to Jebur et al. [3] interferogram categorization as an area of landslides, the closely parked interferogram is a sign that there are several pockets of landslides in the studied area. It should be highlighted, though, that generating ideal interferograms and using them to identify landslides are difficult tasks.
4.4 Vertical displacement map
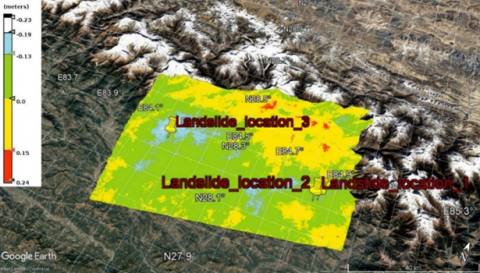
Figure 9 shows the vertical displacement map created for this investigation. The positive displacement value ranges from 0.00 meters to +0.24 meters and the negative displacement value goes from -0.23 meters to 0.0 meters according to the displacement map's legend. The ground movement away from the satellite camera is understood as negative displacement, whereas ground movement toward the camera or material accumulation is viewed as positive displacement [59]. As a result, uplifts/material accumulations are represented by red and yellow-coded displacements. The slightest movement away from the camera is represented by the green-coded displacements and are widespread over the study area. The region with the white and blue coding represents quite large displacements away from the satellite camera and will be of relevance for identifying landslides.
Within the white and blue coded displacements area, three landslides were chosen from a larger group to serve as examples of the study's objectives. As illustrated in Figure 9, they are identified with a yellow placemark as Landslide location 3, Landslide location 2, and Landslide location 1. The three landslides occurred in an area that has experienced significant displacement (movement away from the satellite camera).
4.4.1 Location one landslide
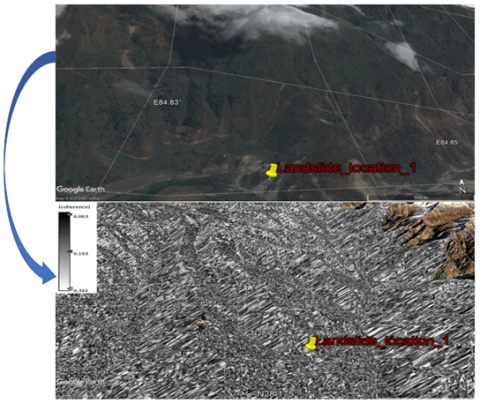
Figure 10 displays the InSAR DEM coherence map over Location 1 landslide. The specific location of the landslide was discovered to have a significant coherence value (bright colour), which is a sign of a reliable phase assessment. Other dark, low-coherence areas will result in poor phase readings and might not produce the expected displacement indicative of a landslide. Although both images were obtained at the same map size, it can also be noted that the InSAR DEM coherence map seems closer in view than the Google Earth image. Despite the processing's limited reduction of these effects, Ferretti et al. [60] classified this impact as layover and foreshortening effects.
Figure 9. Vertical displacement map showing the locations of three selected landslides
Figure 10. Google earth image and InSAR coherence map of location one landslide
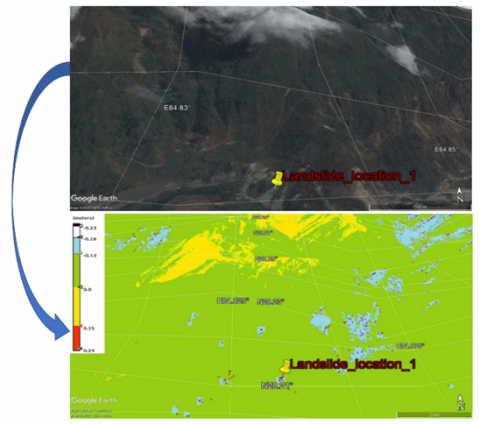
Figure 11. Google earth image and displacement map of location one landslide
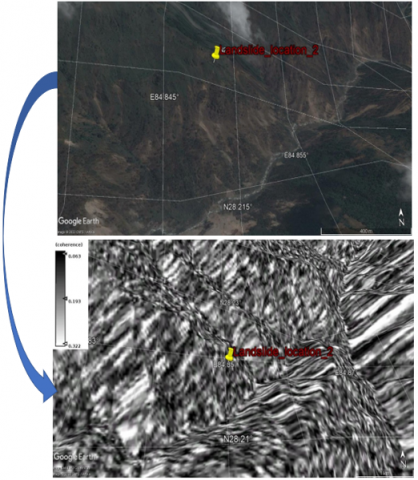
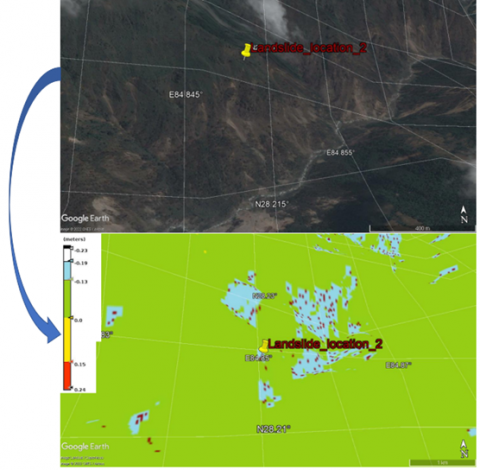
Figure 12. Google earth image and InSAR coherence map of location two landslides
Figure 13. Google earth image and displacement map of location two landslide
The displacement map that was used to verify this locality in Figure 11, a single landslide is depicted. Landslides are indicated by the blue-coded area that shows significant displacement away from the satellite radar. Red-coded uplifts in the center of location one's landslide indicate movement in the direction of the camera; these uplifts are not considered when calculating the displacement of interest and might be considered as material that are impeded from downslope movements. 28,602 m2 was the estimated size of the landslide. The landslide caused a vertical displacement of -0.06 and a volumetric displacement of material estimated at 1,716.12 m3.
4.4.2 Location two landslide
When compared to the coherence value of location one landslide in Figure 12, the exact position of location two landslide has a low coherence value and displays darker in Figure 10. InSAR DEM coherence map. More also, there were also numerous large dark areas of low coherence (coherence loss) over this area. When examined on Google Earth image, this position is more vegetated than location one, which may be the source of the coherence loss in this place. The dense foliage in this area may have reduced radar reception, leading to coherence loss in several locations. Another aspect that may have affected radar illumination is the impact of satellite location at this acquisition.
The displacement map that was utilized to verify this landslide is depicted in Figure 13, and the area that is color-coded blue indicates areas where there have been significant displacements away from satellite sensors, which indicate landslides. Red-coded areas at the side and toe of the landslide indicate movement in the direction of the camera; these uplifts are also not considered when estimating the landslide's volume. The displacement map shows numerous landslide movements over this area, and numerous landslides found on a google earth image of the area confirm this. This may be because the slope is in the direction of the satellite radar, which results in significant radar illumination of the slope surface, as suggested by research by Rosen et al. [58] and Franceschetti and Lanari [57]. the estimated size of the landslide is 9,729 m2. The volume of material displaced by the landslide was assessed to be 583.74 m3 due to the landslide's vertical displacement of -0.06 m.
4.4.3 Location three landslide
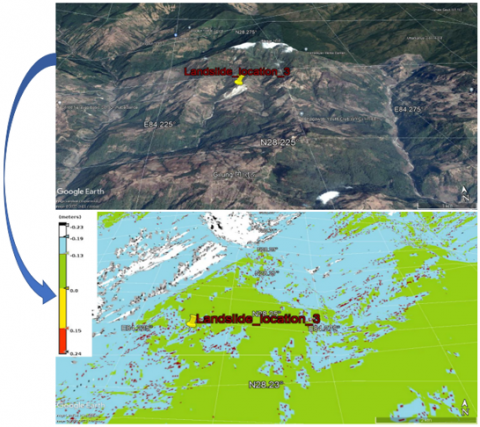
Figure 14 displays the InSAR DEM coherence map over location three's landslide. According to its InSAR coherence map, the landslide location had a low coherence value in the middle and strong coherence on both sides. Also observed over this location were numerous bright spots of high coherence, which may have been caused by good radar penetration due to the area's less dense vegetation as seen in the Google Earth image in Figure 15.
Figure 15 depicts the displacement map that was utilized to verify this landslide. The displacement map shows numerous landslide movements over this area as confirmed by the numerous landslides found on a google earth image of the area. This may be because the site is in the direction of the satellite radar, causing the slope surface to receive a lot of radar illumination. The volume of the material that was displaced is 8,655.71m3, and the area of the landslide was assessed to be 144,078.53m2. It should be emphasized that among the three locations, this landslide's volume displacement is the biggest as can be seen on both google earth image and displacement map.
Figure 14. Google earth image and InSAR coherence map of the location three landslides
Figure 15. Google earth image and displacement map of the location three landslide
It is important to note that not all the landslides in these locations that were visible in the Google Earth image were shown on the displacement map; accordingly, it's conceivable that the steep topography prevented some of them from being detected by radar. The results of this study allowed the evaluation of three landslides on the displacement map produced by the InSAR/DInSAR processing of two Sentinel-1 SAR images. These landslides were then verified using Google Earth images that were taken after the earthquake that caused numerous coseismic landslides in the Nepal region. The success of these findings is comparable to that of Jebur et al. [3], who used repeat pass SAR images from an ALOS-PALSAR satellite's long wavelength SAR to illustrate the capacity of InSAR/DInSAR in forested terrain. The work conducted by Singhroy and Molch [59], which used repeat pass SAR data from ERS satellite for landslide diagnosis, is also comparable to the one presented here. However, these two studies used commercial software and longer wavelength SAR satellite pictures. This study has shown that open-source software and Sentinel-1 short-wavelength SAR can both be useful tools for studying landslides and quickly producing data on landslide disasters. The mid-hill regions of Nepal show significant displacement caused by landslides based on the displacement reported by this study. This has supported Kabi [61] observations, which suggested that the region's sedimentary formation is to blame for the incidence of landslides there.
Several restrictions could have diminished the validity of the study's findings. First, unlike what Jebur et al. [3] accomplished in their study, no field validation measurement was conducted on the reported landslides. The author used a measurement method to validate the DInSAR displacement map, and the outcome was satisfactory with an estimated error of 0.19 RMSE. The pair of SAR images employed in this investigation had a slightly higher than acceptable temporal baseline, which is an additional limiting factor. This limitation may have reduced the precision of our findings, especially when it creates noisy DInSAR interferometric phase. According to the study's findings, it is possible to identify landslides and create data about landslide disasters by examining the huge amount of Sentinel-1 data that the ESA Copernicus programme makes freely available. The task of this study has also been significantly streamlined by the user-friendly SNAP programme, which has simplified some of the critical operations that could be challenging in other SAR processing commercial software. More studies on the precision of using ESA Sentinel-1 satellite data should be undertaken at accessible landslide locations where results can be field validated. To lessen the numerous inaccuracies caused by dense vegetation, the utilization of this short wavelength SAR should also be evaluated on a landslide in a location with less vegetation.
The European Space Agency (ESA) offers a massive archive of free sentinel satellite data that, if studied, could provide prompt and helpful disaster information. As a result, the current study used this data to examine the possibility of landslide identification after coseismic landslides in Nepal. After the Gorkha earthquake on April 25, 2015, InSAR/DInSAR processing employing short wavelength free Sentinel-1 SAR pictures were able to spot landslides. According to the result of this research, this approach can also produce results in challenging and overgrown terrain. The usage of a temporal baseline of 144 days and a perpendicular baseline of 122.51 m had no significant effect on the displacement map's output, even though values greater than this were employed on the ALOS PALSAR satellite and longer wavelength ERS data. Because areas of coherence loss tend to display little substantial or no displacement at all, coherence estimation was proven to be a critical step before InSAR and then DInSAR processing. Landslide detection and volume assessment utilizing InSAR/DInSAR methods in this study demonstrate significant agreement with the findings of other researchers who have utilized this technique.
This study has shown that free sentinel-1 satellite data may be trustworthily processed using InSAR/DInSAR to detect landslides and to produce priceless landslide disaster information. This study indicated several closely parked interferograms attesting to extensive displacement, and the DInSAR interferogram created for this investigation were far from what could be reliably employed. To improve the usage of the differential interferogram to detect ground displacement, more research is required to understand how interferometric noise could be significantly decreased.
[1] Metternicht, G., Hurni, L., Gogu, R. (2005). Remote sensing of landslides: An analysis of the potential contribution to geo-spatial systems for hazard assessment in mountainous environments. Remote sensing of Environment, 98(2-3): 284-303. https://doi.org/10.1016/j.rse.2005.08.004
[2] Chian, S.C., Mulyani, R., Whittle, J., Alarcon, J.E., Wilkinson, S.M. (2010). Post earthquake field investigation of the Mw 7.6 Padang earthquake of 30th September 2009. In 14th European Conference on Earthquake Engineering. Newcastle University.
[3] Jebur, M.N., Pradhan, B., Tehrany, M.S. (2014). Detection of vertical slope movement in highly vegetated tropical area of Gunung pass landslide, Malaysia, using L-band InSAR technique. Geosciences Journal, 18(1): 61-68. https://doi.org/10.1007/s12303-013-0053-8
[4] Highland, L., Bobrowsky, P.T. (2008). The landslide handbook: A guide to understanding landslides, 129. Reston: US Geological Survey.
[5] Guzzetti, F., Manunta, M., Ardizzone, F., Pepe, A., Cardinali, M., Zeni, G., Lanari, R. (2009). Analysis of ground deformation detected using the SBAS-DInSAR technique in Umbria, Central Italy. Pure and applied geophysics, 166(8): 1425-1459. https://doi.org/10.1007/s00024-009-0491-4
[6] Wang, G., Sassa, K. (2003). Pore-pressure generation and movement of rainfall-induced landslides: effects of grain size and fine-particle content. Engineering Geology, 69(1-2): 109-125. https://doi.org/10.1016/S0013-7952(02)00268-5
[7] Cascini, L., Fornaro, G., Peduto, D. (2010). Advanced low-and full-resolution DInSAR map generation for slow-moving landslide analysis at different scales. Engineering Geology, 112(1-4): 29-42. https://doi.org/10.1016/j.enggeo.2010.01.003
[8] Ramesh, M.V. (2014). Design, development, and deployment of a wireless sensor network for detection of landslides. Ad Hoc Networks, 13: 2-18. https://doi.org/10.1016/j.adhoc.2012.09.002
[9] Dong, Y., Li, Q., Dou, A., Wang, X. (2011). Extracting damages caused by the 2008 Ms 8.0 Wenchuan earthquake from SAR remote sensing data. Journal of Asian Earth Sciences, 40(4): 907-914. https://doi.org/10.1016/j.jseaes.2010.07.009
[10] Dai, K., Li, Z., Tomás, R., Liu, G., Yu, B., Wang, X., Stockamp, J. (2016). Monitoring activity at the Daguangbao mega-landslide (China) using Sentinel-1 TOPS time series interferometry. Remote Sensing of Environment, 186: 501-513. https://doi.org/10.1016/j.rse.2016.09.009
[11] Purnamasayangsukasih, P.R., Norizah, K., Ismail, A.A., Shamsudin, I. (2016). A review of uses of satellite imagery in monitoring mangrove forests. InIOP Conference Series: Earth & Env. Sci., 37(1): 12-34. https://doi.org/10.1088/1755-1315/37/1/012034
[12] Hu, B., Li, H., Zhang, X., Fang, L. (2020). Oil and gas mining deformation monitoring and assessments of disaster: Using interferometric synthetic aperture radar technology. IEEE Geoscience and Remote Sensing Magazine, 8(2): 108-134. https://doi.org/10.1109/MGRS.2020.2989239
[13] Noviello, C., Verde, S., Zamparelli, V., Fornaro, G., Pauciullo, A., Reale, D., Peduto, D. (2020). Monitoring buildings at landslide risk with SAR: a methodology based on the use of multipass interferometric data. IEEE Geoscience and Remote Sensing Magazine, 8(1): 91-119. https://doi.org/ 10.1109/MGRS.2019.2963140
[14] Moreira, A., Krieger, G., Hajnsek, I., Papathanassiou, K., Younis, M., Lopez-Dekker, P., Parizzi, A. (2015). Tandem-L: A highly innovative bistatic SAR mission for global observation of dynamic processes on the Earth's surface. IEEE Geoscience and remote sensing magazine, 3(2): 8-23. https://doi.org/10.1109/MGRS.2015.2437353
[15] Jelének, J., Kopačková-Strnadová, V. (2021). Synergic use of Sentinel-1 and Sentinel-2 data for automatic detection of earthquake-triggered landscape changes: A case study of the 2016 Kaikoura earthquake (Mw 7.8), New Zealand. Remote Sensing of Environment, 265: 112634. https://doi.org/10.1016/j.rse.2021.112634
[16] Ullo, S.L., Addabbo, P., Di Martire, D., Sica, S., Fiscante, N., Cicala, L., Angelino, C.V. (2019). Application of DInSAR technique to high coherence Sentinel-1 images for dam monitoring and result validation through in situ measurements. IEEE Journal of Selected Topics in Applied Earth Observations and Remote Sensing, 12(3): 875-890. https://doi.org/10.1109/JSTARS.2019.2896989
[17] Catani, F., Farina, P., Moretti, S., Nico, G., Strozzi, T. (2005). On the application of SAR interferometry to geomorphological studies: estimation of landform attributes and mass movements. Geomorphology, 66(1-4): 119-131. https://doi.org/10.1016/j.geomorph.2004.08.012
[18] Casagli, N., Cigna, F., Bianchini, S., Hölbling, D., Füreder, P., Righini, G., Bianchi, M. (2016). Landslide mapping and monitoring by using radar and optical remote sensing: Examples from the EC-FP7 project SAFER. Remote Sensing Applications: Society and Environment, 4: 92-108. https://doi.org/10.1016/j.rsase.2016.07.001
[19] Yagüe-Martínez, N., Prats-Iraola, P., Gonzalez, F. R., Brcic, R., Shau, R., Geudtner, D., Bamler, R. (2016). Interferometric processing of Sentinel-1 TOPS data. IEEE Transactions on Geoscience and Remote Sensing, 54(4): 2220-2234. https://doi.org/10.1109/TGRS.2015.2497902
[20] Rodriguez-Cassola, M., Baumgartner, S.V., Krieger, G., Moreira, A. (2009). Bistatic TerraSAR-X/F-SAR spaceborne–airborne SAR experiment: description, data processing, and results. IEEE Transactions on Geoscience and Remote Sensing, 48(2): 781-794. https://doi.org/ 10.1109/TGRS.2009.2029984
[21] Lissak, C., Bartsch, A., De Michele, M., Gomez, C., Maquaire, O., Raucoules, D., Roulland, T. (2020). Remote sensing for assessing landslides and associated hazards. Surveys in Geophysics, 41(6): 1391-1435. https://doi.org/10.1007/s10712-020-09609-1
[22] Dai, K., Li, Z., Xu, Q., Bürgmann, R., Milledge, D.G., Tomas, R., Liu, J. (2020). Entering the era of earth observation-based landslide warning systems: A novel and exciting framework. IEEE Geoscience and Remote Sensing Magazine, 8(1): 136-153. https://doi.org/10.1109/MGRS.2019.2954395
[23] Singhroy, V., Ohkura, H., Glenn, N. (2002). Earth observation for landslide assessment. In IEEE International Geoscience and Remote Sensing Symposium, 2: 765-767.
[24] Di Napoli, M., Marsiglia, P., Di Martire, D., Ramondini, M., Ullo, S. L., Calcaterra, D. (2020). Landslide susceptibility assessment of wildfire burnt areas through earth-observation techniques and a machine learning-based approach. Remote Sensing, 12(15): 2505. https://doi.org/10.3390/rs12152505
[25] Ambrosi, C., Strozzi, T., Scapozza, C., Wegmüller, U. (2018). Landslide hazard assessment in the Himalayas (Nepal and Bhutan) based on Earth-Observation data. Engineering Geology, 237: 217-228. https://doi.org/10.1016/j.enggeo.2018.02.020
[26] Open Access Hub (2014-2019). Welcome to the Copernicus Open Access Hub. https://scihub.copernicus.eu/, accessed on 07 November 2019.
[27] Potin, P., Rosich, B., Grimont, P., et al. (2016). Sentinel-1 mission status. In Proceedings of EUSAR 2016: 11th European Conference on Synthetic Aperture Rada, pp. 1-6.
[28] Yamada, Y. (2001). Detection of flood-inundated area and relation between the area and micro-geomorphology using SAR and GIS. In IGARSS 2001. Scanning the Present and Resolving the Future. Proceedings. IEEE 2001 International Geoscience and Remote Sensing Symposium (Cat. No. 01CH37217), 7: 3282-3284. https://doi.org/10.1109/IGARSS.2001.978329
[29] Dong, J., Zhang, L., Li, M., Yu, Y., Liao, M., Gong, J., Luo, H. (2018). Measuring precursory movements of the recent Xinmo landslide in Mao County, China with Sentinel-1 and ALOS-2 PALSAR-2 datasets. Landslides, 15(1): 135-144. https://doi.org/10.1007/s10346-017-0914-8
[30] Smail, T., Abed, M., Mebarki, A., Lazecky, M. (2022). Earthquake-induced landslide monitoring and survey by means of InSAR. Natural Hazards and Earth System Sciences, 22(5): 1609-1625. https://doi.org/10.5194/nhess-22-1609-2022
[31] Liu, X., Zhao, C., Zhang, Q., et al. (2021). Three-dimensional and long-term landslide displacement estimation by fusing C-and L-band SAR observations: A case study in Gongjue County, Tibet, China. Remote Sensing of Environment, 267: 112745. https://doi.org/10.1016/j.rse.2021.112745
[32] Tzouvaras, M., Danezis, C., Hadjimitsis, D.G. (2020). Differential SAR Interferometry Using Sentinel-1 Imagery-Limitations in Monitoring Fast Moving Landslides: The Case Study of Cyprus. Geosciences, 10(6): 236. https://doi.org/10.3390/geosciences10060236
[33] Government of Nepal Central Bureau of Statistics. National population and housing sensors. National Planning Commission Secretariat Kathmandu, Nepal. 2011. https://unstats.un.org/unsd/demographic/sources/census/wphc/nepal/nepal-census-2011-vol1.pdf.
[34] Allen, C.R., St. Amand, P., Richter, C.F., Nordquist, J.M. (1965). Relationship between seismicity and geologic structure in the southern California region. Bulletin of the Seismological Society of America, 55(4): 753-797. https://doi.org/10.1785/BSSA0550040753
[35] Anderson, J. G. (1979). Estimating the seismicity from geological structure for seismic-risk studies. Bulletin of the Seismological Society of America, 69(1): 135-158. https://doi.org/10.1785/BSSA0690010135
[36] Snelling, P.E., Godin, L., McKinnon, S.D. (2013). The role of geologic structure and stress in triggering remote seismicity in Creighton Mine, Sudbury, Canada. International Journal of Rock Mechanics and Mining Sciences, 58: 166-179. https://doi.org/10.1016/j.ijrmms.2012.10.005
[37] King, V.M., Block, L.V., Yeck, W.L., Wood, C.K., Derouin, S.A. (2014). Geological structure of the Paradox Valley Region, Colorado, and relationship to seismicity induced by deep well injection. Journal of Geophysical Research: Solid Earth, 119(6): 4955-4978. https://doi.org/10.1002/2013JB010651
[38] Gurung, T.B. (2017). Chapter III. Aquatic biodiversity for food and agriculture in Nepal. The state of Nepal’s biodiversity for food and agriculture (BK Joshi, AK Acharya, D Gauchan and P Chaudhary, eds). Ministry of Agricultural Development, Kathmandu, Nepal, pp. 37-48. https://www.fao.org/3/CA3497EN/ca3497en.pdf.
[39] Ambraseys, N.N., Douglas, J. (2004). Magnitude calibration of north Indian earthquakes. Geophysical Journal International, 159(1): 165-206. https://doi.org/10.1111/j.1365-246X.2004.02323.x
[40] Bilham, R. (2004). Earthquakes in India and the Himalaya: tectonics, geodesy and history. Annals of GEOPHYSICS, 2-3/47. http://hdl.handle.net/2122/798
[41] Ambraseys, N., Jackson, D. (2003). A note on early earthquakes in northern India and southern Tibet. Current Science, 570-582. http://www.jstor.org/stable/24107477.
[42] Goda, K., Kiyota, T., Pokhrel, R.M., Chiaro, G., Katagiri, T., Sharma, K., Wilkinson, S. (2015). The 2015 Gorkha Nepal earthquake: insights from earthquake damage survey. Front. Built Environ., 1: 8. https://doi.org/10.3389/fbuil.2015.00008
[43] Collins, B.D., Jibson, R.W. (2015). Assessment of existing and potential landslide hazards resulting from the April 25, 2015 Gorkha, Nepal earthquake sequence, 2015-114. US Geological Survey. https://doi.org/10.3133/ofr20151142
[44] Gautam, D., Bhetwal, K.K., Rodrigues, H., Neupane, P., Sanada, Y. (2015). Observed damage patterns on buildings during 2015 Gorkha (Nepal) earthquake. In Proceedings of 14th international symposium on new technologies for urban safety of mega cities in Asia, pp. 29-31.
[45] Kargel, J.S., Leonard, G.J., Shugar, D.H., Haritashya, U.K., Bevington, A., Fielding, E.J., Young, N. (2016). Geomorphic and geologic controls of geohazards induced by Nepal’s 2015 Gorkha earthquake. Science, 351(6269): aac8353. https://doi.org/10.1126/science.aac8353
[46] Sheppard, P.S., Landry, M.D. (2016). Lessons from the 2015 earthquake (s) in Nepal: implication for rehabilitation. Disability and Rehabilitation, 38(9): 910-913. https://doi.org/10.3109/09638288.2015.1064482
[47] Lindsey, E.O., Natsuaki, R., Xu, X., Shimada, M., Hashimoto, M., Melgar, D., Sandwell, D.T. (2015). Line-of-sight displacement from ALOS-2 interferometry: Mw 7.8 Gorkha Earthquake and Mw 7.3 aftershock. Geophysical Research Letters, 42(16): 6655-6661. https://doi.org/10.1002/2015GL065385
[48] Massonnet, D., Feigl, K.L. (1998). Radar interferometry and its application to changes in the Earth's surface. Reviews of Geophysics, 36(4): 441-500. https://doi.org/10.1029/97RG03139
[49] Mondini, A.C., Santangelo, M., Rocchetti, M., Rossetto, E., Manconi, A., Monserrat, O. (2019). Sentinel-1 SAR amplitude imagery for rapid landslide detection. Remote Sensing, 11(7): 760. https://doi.org/10.3390/rs11070760
[50] Mondini, A.C. (2017). Measures of spatial autocorrelation changes in multitemporal SAR images for event landslides detection. Remote Sensing, 9(6): 554. https://doi.org/10.3390/rs9060554
[51] Schlögel, R., Doubre, C., Malet, J.P., Masson, F. (2015). Landslide deformation monitoring with ALOS/PALSAR imagery: A D-InSAR geomorphological interpretation method. Geomorphology, 231: 314-330. https://doi.org/10.1016/j.geomorph.2014.11.031
[52] Singhroy, V., Mattar, K.E., Gray, A. (1998). Landslide characterisation in Canada using interferometric SAR and combined SAR and TM images. Advances in Space Research, 21(3): 465-476. https://doi.org/10.1016/S0273-1177(97)00882-X
[53] Colesanti, C., Wasowski, J. (2006). Investigating landslides with space-borne Synthetic Aperture Radar (SAR) interferometry. Engineering Geology, 88(3-4): 173-199. https://doi.org/10.1016/j.enggeo.2006.09.013
[54] Wasowski, J., Bovenga, F. (2014). Investigating landslides and unstable slopes with satellite Multi Temporal Interferometry: Current issues and future perspectives. Engineering Geology, 174: 103-138. https://doi.org/10.1016/j.enggeo.2014.03.003
[55] Simons, M., Rosen, P.A. (2007). Interferometric synthetic aperture radar geodesy. Geodesy, 3: 391-446. https://doi.org/10.1016/B978-044452748-6.00059-6
[56] Singh, L.P., Van Westen, C.J., Champati Ray, P.K., Pasquali, P. (2005). Accuracy assessment of InSAR derived input maps for landslide susceptibility analysis: a case study from the Swiss Alps. Landslides, 2(3): 221-228. https://doi.org/10.1007/s10346-005-0059-z
[57] Franceschetti, G., Lanari, R. (2018). Synthetic aperture radar processing. CRC press. https://doi.org/10.1201/9780203737484
[58] Rosen, P.A., Hensley, S., Joughin, I.R., Li, F.K., Madsen, S.N., Rodriguez, E., Goldstein, R.M. (2000). Synthetic aperture radar interferometry. Proceedings of the IEEE, 88(3): 333-382. https://doi.org/10.1109/5.838084
[59] Singhroy, V., Molch, K. (2004). Characterizing and monitoring rockslides from SAR techniques. Advances in Space Research, 33(3): 290-295. https://doi.org/10.1016/S0273-1177(03)00470-8
[60] Ferretti, A., Monti-Guarnieri, A.V., Prati, C.M., Rocca, F., Massonnet, D. (2007). INSAR Principles B. ESA publications.
[61] Kabi, P.P. (2013). Chure forestry conservation and management plan: A case study of Arghakhanchi district, Nepal. Journal of Geography and Regional Planning, 6(5): 172-183. https://doi.org/10.5897/JGRP12.088