Zainab A. Al-Salihi* | Ammar Hatem Kamel | Isam M. Abdulhameed
© 2022 IIETA. This article is published by IIETA and is licensed under the CC BY 4.0 license (http://creativecommons.org/licenses/by/4.0/).
OPEN ACCESS
Hydrologists, water managers, and policymakers are all concerned about the potential implications of climate change on water supplies. This paper describes development of water resources management in northern Iraq. The study looks at three hydrological variables that represent various stages of the hydrological cycle. The hydrological variables are discharge, rainfall, and temperature. The result showed that the volume of water for Great Zab River reduced from 264 billion m3 for the period (1980-1999) to 209 billion m3 for the period (2000-2020). Due to the absence of dams on the river mainstream, therefore, the Great Zab can be considered as an indicator of the climate change effects. Additionally, the volume of water for Lesser Zab River reduced from 494 billion m3 for the period (1932-1999) to 0.86 billion m3 for the period (2000-2020). For Great Zab, the maximum and the minimum annual rainfall was 309.44 mm in 1994 and 104.57 mm in 1999 for the period (1982-1999) respectively, whilst the maximum and minimum annual rainfall was 430.05 mm in 2018 and 152.43 mm in 2017 for the period (2000-2020) respectively. Accordingly, the climate changes have a significant impact on Tigris River in the northern of Iraq.
climate change, great Zab, lesser Zab, Tigris River, trend line
2.1 Study area
Khbour, Greater Zab, Lesser Zab, Al-Adhaim, and Diyala Rivers are the five primary tributaries of the Tigris River (Figure 3). These tributaries are located on the Tigris River's left bank between latitudes 33.2 N and 37.3 N and longitudes 42.9 E and 46.9 E, and they contribute considerably to the Tigris' stream. These tributaries, with the exception of the Al-Adhaim River, are shared by Iraq and Turkey or Iraq and Iran [17]. In this paper the Greater Zab, the Lesser Zab, and the Tigris River downstream of Mosul dam will be taken as a study area.
Figure 3. The basins of the five tributaries in northeast Iraq [17]
2.1.1 Greater Zab
The Greater Zab is a tributary of the Tigris River in northern Iraq (Figure 4), between 36° N and 38° N latitudes and 43°18' E and 44°18' E longitudes [19]. The river starts in a hilly area of Turkey at a height of roughly 4,168 m a.m.s.l (ESCWA), with Turkey accounting for 34.8 percent of the watershed [17-23]. The Greater Zab and its tributaries have a catchment area of 26,473 (km2). The river basin receives the majority of its precipitation in the winter and spring, with annual rainfall ranging from 350 to 1000 mm. The following is a typical distribution of precipitation in the watershed throughout a year: 48.9% in winter as snowfall, 37.5% in spring, 12.9% in autumn, and 0.57% in summer [24]. Before they meet around 49 kilometers south of Mosul, in Sharkat city, this river's discharge is about 70% that of the Tigris [19]. In terms of water supply, the Greater Zab River is the greatest Tigris tributary. The Greater Zab is one of the few unregulated rivers in the region since no dams have been built. As a result, the Great Zab plays a critical role in assessing the impact of climate change on Iraq's rivers when it comes to examining climate change in Iraq.
Figure 4. Location of Greater Zab [19]
2.1.2 Tigris River in Mosul city
Mosul, where the Tigris River flows through, has a hot semi-arid climate that borders on Mediterranean, with extremely hot, long, dry summers, brief and mild autumn and spring seasons, and moderately rainy, reasonably temperate winters. The Tigris River in Mosul has been analyzed in this study based on the outflow from the Mosul Dam for the period (1986-1999) and (2000-2020).
2.1.3 Lesser Zab
Lesser Zab (also known as Little or Lower Zab) is an Iranian mountain range in the northeastern Zagros Mountains (see Figure 3). The river travels through steep valleys linked by various tiny streams in the basin's upstream section before flowing across flat territory until entering the Tigris River near Fatah [25]. The climate of the basin is arid to semi-arid, with wet winters and dry summers. The average yearly temperature ranges from 10 degrees Celsius in the north to 22 degrees Celsius in the south. The average annual rainfall in the hilly north varies from 1500 mm to 350 mm in the lowlands of the south. Together, the Greater and Lesser Zab produce around 50–60% of Tigris flow. On the Iraqi side of the river, the Dukan and Dibis dams have been built for agricultural use, electricity, and flow management. Grasslands represent approximately 70% of the watershed, with agriculture covering the remaining 30% [26].
2.2 Methodology
In a changing climate, trend analysis for hydrological parameters is critical for recommending future water resource management methods. The Data was collected from the required stations for the chosen rivers (Figure 5). According to the available data, the trend lines between years and hydrologic parameters, such as rain, and discharges, as well as temperature, were drawn using the Microsoft Excel program. The trend line between discharge and years has been drawn for two periods (1932-1999) and (2000-2020) for the rivers (because the Turkish government has finished constructing the majority of the dams in 2000, and after 2000 the effects of climate change are beginning to manifest, these two periods has been chosen). The trend lines were then examined to determine if there are any implications for climate change.
Figure 5. Flow chart of methodology
In this section, the trend analysis results will be presented for each variable at the annual scales and some of the result at the monthly scales. For the period before 2000, the discharge from the Mosul Dam was used for estimation of incoming water and river discharge for the Tigris River analysis, where the highest monthly discharge was 3380 m3/sec in April 1988 and the lowest discharge was 88 m3/sec in December 1986 during the period 1932-1999. The trend line (see Figure 6) of Tigris River in Mosul city for the period (1986-1999) shows a depression.
Figure 6. Trend line of annual average discharge for Tigris River for the period (1986-1999)
As shown in Figure 7, the rain trend line for Tigris River is stable, where the maximum annual rainfall was 391.18 mm in 1996 and the minimum annual rainfall was 155.7 mm in 1999 for the period (1982-1999). As shown in Figure 8 the trend line for temperature shows a rise. Where the maximum average monthly temperature was 34.3 © in July and the minimum average monthly temperature was 5.5 in © in January for the period (1981-1999).
Figure 7. Trend line of annual rainfall for Tigris River for the period (1981-1999)
Figure 8. Trend line of temperature of Tigris River for the periods (1981-1999) & (2000-2020)
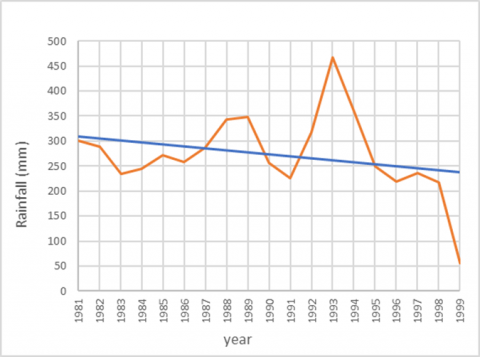
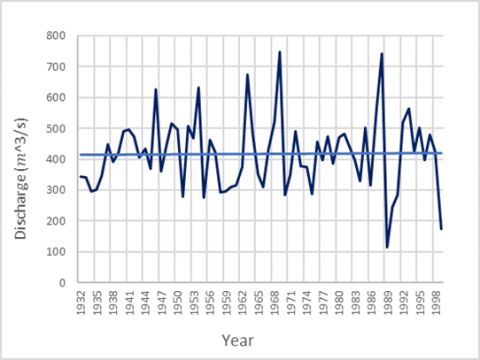
For the Lesser Zab analysis, Altun Kupri station was used for estimation of incoming water and river discharge, where the highest monthly discharge was 1433 m3/sec in March 1988 and the lowest discharge was 19.8 m3/sec in September 1951 during the period 1932-1999. As shown in Figure 9 the trend line for Lesser Zab shows a rise for the period (1932-1999). The trend line of precipitation shows a depression for the period (1982-1999), where the maximum annual rainfall was 467.45 mm (see Figure 10) in 1993 and the minimum annual rainfall was 56.05 mm in 1999 for the period.
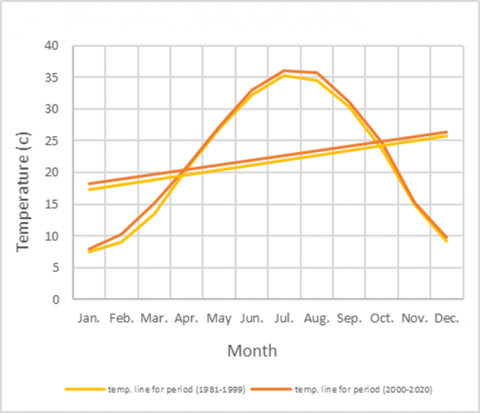
As shown in Figure 11 it’s worth noting that the trend line temperature for Lesser Zab shows a rise. Where, the maximum average monthly temperature was 35.34 © in July, and the minimum average monthly temperature was 7.53 mm in January for the period (1981-1999).
Figure 9. Trend line of annual average discharge for Lesser Zab for the period (1932-1999)
Figure 10. Trend line of annual rainfall for Lesser Zab for the period (1981-1999)
Figure 11. Trend line of temperature of Lesser Zab for the periods (1981-1999) & (2000-2020)
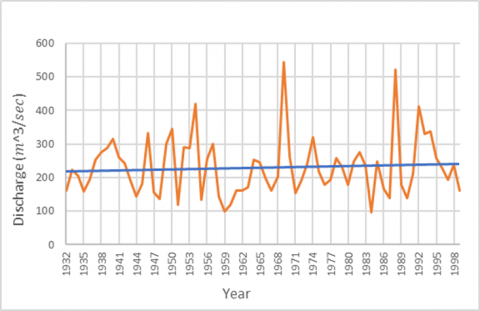
For the Great Zab River analysis, Asky Kalak station was used for estimation of incoming water and river discharge, where the highest monthly discharge was 1780 m3/sec in April 1969 and the lowest discharge was 34 m3/sec in 1989 during the period 1932-1999. The trend line for Great Zab is stable over the years (1932-1999) as shown in Figure 12.
Figure 12. Annual average discharge for Great Zab for the period (1932-1999)
In terms of rain, the trend line for period (1982-1999) shows a small depression (see Figure 13). The temperature trend line for Great Zab (see Figure 14) also shows a rise, where the maximum average monthly temperature was 34.53 © in July and the minimum average monthly temperature was 6.21 © in January for the period (1981-1999). For the period after 2000, the trend line of discharge for Tigris River downstream Mosul dam is stable as shown in Figure 15.
Figure 13. Trend line of annual rainfall for Great Zab for the period (1981-1999)
Figure 14. Trend line of temperature of Great Zab for the periods (1981-1999) & (2000-2020)
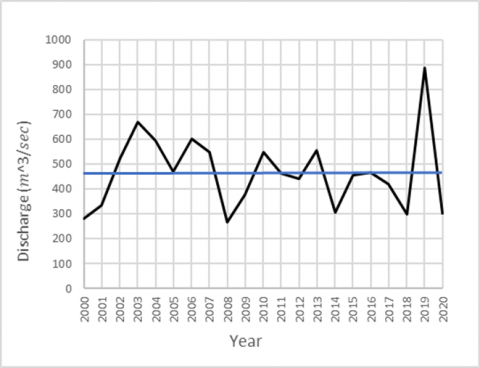
Figure 15. Annual average discharge for Tigris River for the period (2000-2020)
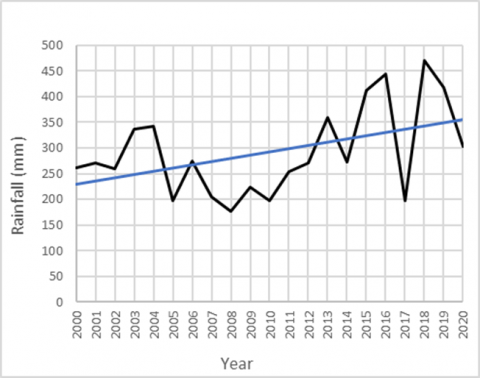
Figure 16. Trend line of annual rainfall for Tigris River for the period (2000-2020)
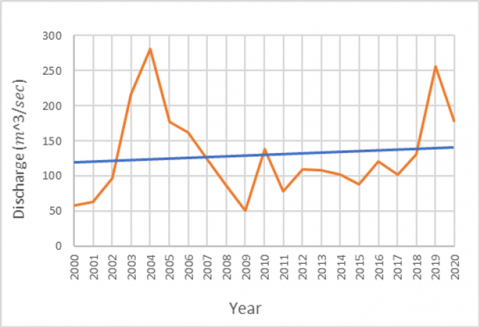
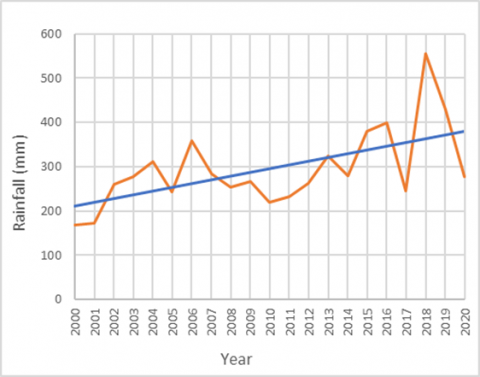
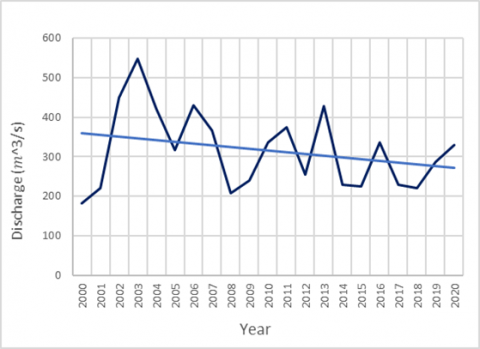
With the obvious influence of climate change, the highest average monthly discharge was 2837 m3/sec in April 2019 and the lowest average monthly discharge was 115 m3/sec in April 2001. In terms of rain, the trend line for the period (2000-2020) shows a rise (see Figure 16). The maximum annual rainfall was 391.18 mm in 1996 and the minimum annual rainfall was 155.7 mm in 1999. For temperatures, it can be noticed that they have risen recently, where the maximum average monthly temperature was 35.21 in July, and the minimum average monthly temperature was 5.99 © in January (see Figure 8). For Lesser Zab River discharges, the trend line after the period 2000 shows a little rise (see Figure 17), where the highest monthly discharge was 1433 m3/sec in March 1988 and the lowest discharge was 19.8 m3/sec in September 1951. As shown in Figure 18, the trend line for precipitation shows a rise, where the maximum annual rainfall was 555.06 mm in 2018 and the minimum annual rainfall was 167.6 mm in 2000. It's worth noting that the temperature trend line in Lesser Zab River has lately climbed (see Figure 11), where the maximum average monthly temperature was 36 © in July, and the minimum average monthly temperature was 7.92 © in January. The Great Zab River discharge with the obvious influence of climate change, the highest average monthly discharge was 1600 m3/sec in May 2003 and the lowest average monthly discharge was 50 m3/sec in September 2017, and the monthly general rate decreased from 990 m3/sec in April during the first period to 730 m3/sec in April in the second period. It should be noted that the highest rate of discharges was in the months of April and May, which clearly indicates that they were greatly affected by the melting of snow and their quantities.
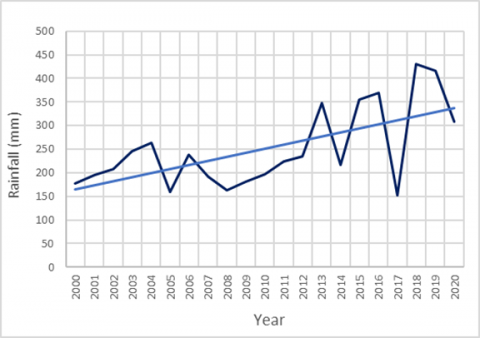
In Figure 19, it is quite clear that the trend line of Great Zab shows a depression. The trend line for rain after the period 2000 shows a rise, where the maximum annual rainfall was 430.05 mm in 2018 and the minimum annual rainfall was 152.43 mm in 2017 for the period (see Figure 20). it can be noticed that temperatures have risen recently, as shown in Figure 15, which is an indication of climate change's consequences. Where the maximum average monthly temperature was 35.41 © in July, and the minimum average monthly temperature was 6.69 © in January.
Figure 17. Annual average discharge for Lesser Zab for the period (2000-2020)
Figure 18. Trend line of annual rainfall for Lesser Zab for the period (2000-2020)
Figure 19. Annual average discharge for Great Zab for the period (2000-2020)
Figure 20. Trend line of annual rainfall for Great Zab for the period (2000-2020)
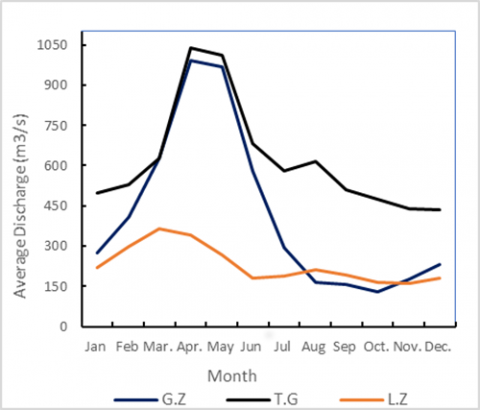
Figure 21. Average monthly discharge before 2000 for Tigris River, Lesser Zab, and Great Zab 38%
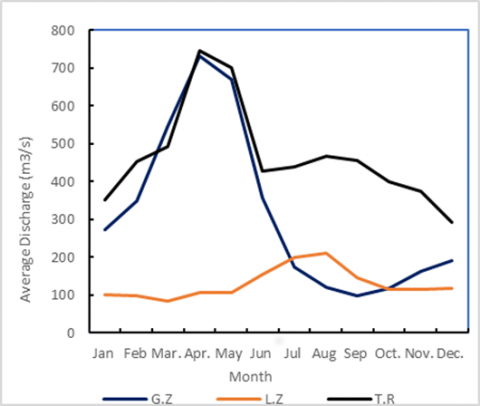
Figures 21 and 22 shows the monthly average discharge for Great Zab, Lesser Zab, and Tigris River downstream of Mosul Dam for the two periods. It is clear that the Great Zab discharge in March is almost equal to the Tigris River discharge and yet there is no dam control the river. Table 1 shows the percentage of Lesser Zab and Great Zab from Tigris River (downstream of Mosul Dam) for the period (1932-1999) and Table 2 for the period (2000-2020).
Figure 22. Average monthly discharge after 2000 for Tigris River, Lesser Zab, and Great Zab 38%
Table 1. The percentage of discharges of Great Zab (G.Z) and Lesser Zab (L.Z) from Tigris River for the period before 2000 (all discharge in m3/sec)
|
Months |
T. R |
G. Z |
L.Z |
% G. Z |
% L. Z |
|
Jan. |
498 |
276 |
218.27 |
55 |
44 |
|
Feb. |
529 |
410 |
297.92 |
78 |
56 |
|
Mar. |
626 |
627 |
365.88 |
100 |
58 |
|
Apr. |
1040 |
990 |
339.64 |
95 |
33 |
|
May |
1010 |
969 |
266.17 |
96 |
26 |
|
Jun. |
684 |
582 |
179.47 |
85 |
26 |
|
Jul. |
579 |
295 |
189.13 |
51 |
33 |
|
Aug. |
615 |
166 |
211.43 |
27 |
34 |
|
Sep. |
511 |
157 |
191.89 |
31 |
38 |
|
Oct. |
474 |
131 |
164.31 |
28 |
35 |
|
Nov. |
440 |
177 |
159.78 |
40 |
36 |
|
Dec. |
437 |
233 |
180.54 |
53 |
41 |
|
Aver. |
620.25 |
417.75 |
230.37 |
62 |
38 |
Table 2. The percentage of discharges of Great Zab and Lesser Zab from Tigris River for the period after 2000 (all discharge in m3/sec)
|
Months |
T. R |
G. Z |
L.Z |
% G. Z |
% L. Z |
|
Jan. |
351 |
273.48 |
100.76 |
78 |
29 |
|
Feb. |
453 |
348.86 |
97.52 |
77 |
22 |
|
Mar. |
492 |
546 |
85.76 |
100 |
17 |
|
Apr. |
746 |
731 |
106 |
98 |
14 |
|
May |
702 |
668.71 |
105.67 |
95 |
15 |
|
Jun. |
429 |
357.43 |
154.57 |
83 |
36 |
|
Jul. |
439 |
174.62 |
200.29 |
40 |
46 |
|
Aug. |
468 |
122.38 |
211.67 |
26 |
45 |
|
Sep. |
455 |
98 |
146.81 |
22 |
32 |
|
Oct. |
400 |
118.4 |
115.38 |
30 |
29 |
|
Nov. |
374.7 |
162.24 |
116.05 |
43 |
31 |
|
Dec. |
292 |
191.14 |
118.91 |
65 |
41 |
|
Aver. |
466.81 |
316.02 |
129.949 |
64 |
30 |
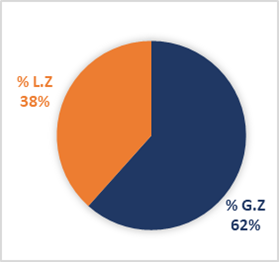
Figure 23. Pie chart for the percentage of Great Zab and Lesser Zab from Tigris River for the period before 2000
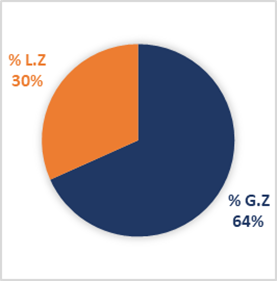
Figure 24. Pie chart for the percentage of Great Zab and Lesser Zab from Tigris River for the period after 2000
Figure 23 and 24 shows the percentage of Lesser Zab and Great Zab from Tigris River for the period before 2000, and after 2000. Before 2000, Lesser Zab River is representing a percent of 38 from the Tigris River, whilst the Great Zab River represents a percent of 62 from the Tigris River. For the period after 2000, Lesser Zab River is representing a percent of 30 from the Tigris River, whilst the Great Zab River represents a percent of 64 from the Tigris River.
A larger number of significant trends have been found in several hydrological variables in the Great Zab, Lesser Zab, and Tigris River Basins than would be expected by chance.
Noteworthy results were a steady trend in the annual flow for Great Zab River for the period (1932-1999), a decreasing trend in the annual flow for the period (2000-2020). Consequently, it is an indication of climate change's influence on the Great Zab River, even though there is no dam on it to control the flow.
It is worth mentioning that the choice of these two periods (1932-1999 and 2000-2020) was based on two factors, the first is that the Turkish government has finished constructing the majority of the dams at the end of 2000, and the other is the effects of climate change after 2000, that were beginning to manifest. Therefore, by comparing these two periods, the effects of the climate change on the rivers that were chose to analyze in this study can be known.
From Figures 21 and 22 it can be seen that in March, the great Zab flow is equal to the Tigris flow. The percentage of Great Zab before 2000 was 62% from the Tigris River and percentage of Lesser Zab from Tigris River was 38%, while the percentages after 2000 was 64% and 30% for great Zab and Lesser Zab from Tigris River successively.
According to the results that showed that the volume of water for Great Zab River reduced from 264 billion m3 for the period (1980-1999) to 209 billion m3 for the period (2000-2020), climate change is undeniably one of Iraq's most significant challenges, having serious implications for water resources, the environment, and the economy, notably in the agricultural sector.
The lesser Zab result revealed that dams in Syria and Turkey had a greater impact than climate change, as average rainfall rose from 272.77 mm before 2000AD to 295.14 mm after 2000AD, but flow reduced from 229.56 (m3/sec) before 2000AD to 129.95 (m3/sec) after 2000AD.
The effect of the dams in Syria and Turkey on the Tigris River is also greater than that of climate change, since average rainfall increased from 259.24 mm before 2000AD to 292.72 mm after 2000AD, but discharge declined from 620.21 (m3/sec) before 2000AD to 466.67 (m3/sec) after 2000AD.
The Great Zab result revealed that climate change has a greater impact because there are no dams on the river, and the discharge has fallen from 417.74 (m3/sec) before 2000AD to 315.57 (m3/sec) after 2000AD.
In terms of temperature, the data show that it rose after 2000AD compared to the previous period, which may be interpreted as a climate change influence on the rivers.
[1] Bergkamp, G.J.J., Orlando, B., Burton, I. (2003). Change: Adaptation of water resources management to climate change. IUCN. http://www.iucn.orghttp://www.waterandnature.org.
[2] The Physical science basis summary for policymakers working group i contribution to the sixth assessment report of the intergovernmental panel on climate change. https://www.ipcc.ch/report/ar6/wg1/downloads/report/IPCC_AR6_WGI_SPM_final.pdf.
[3] Ehsani, N., Vörösmarty, C., Fekete, B., Stakhiv, E. (2017). Reservoir operations under climate change: Storage capacity options to mitigate risk. Journal of Hydrology, 55: 435-446. http://dx.doi.org/10.1016/j.jhydrol.2017.09.008
[4] Atkins. (2013). FD2628 Impact of Climate Change on Dams & Reservoirs Final Guidance Report.
[5] Tabari, H. (2020). Climate change impact on flood and extreme precipitation increases with water availability. Scientific Reports, 10(1): 13768. http://dx.doi.org/10.1038/s41598-020-70816-2
[6] Garbrecht, J.D., Piechota, T.C. (2005). Climate variations, climate change, and water resources engineering. American Society of Civil Engineers. http://dx.doi.org/10.1061/9780784408247
[7] ISAB. (2007). Independent scientific advisory board climate change impacts on Columbia river basin fish and wildlife. https://www.nwcouncil.org/reports/climate-change-impacts-on-columbia-river-basin-fish-and-wildlife/.
[8] Wodon, Q., Liverani, A., Joseph, G., Bougnoux, N. (2014). Climate change and migration: evidence from the Middle East and North Africa. World Bank Publications.
[9] Price, R. (2018). Environmental risks in Iraq. K4D Helpdesk Report. Brighton, UK: Institute of Development Studies.
[10] Lelieveld, J., Hadjinicolaou, P., Kostopoulou, E., Chenoweth, J., El Maayar, M., Giannakopoulos, C., Hannides, C., Lange, M.A., Tanarhte, M., Tyrlis, E., Xoplaki, E. (2012). Climate change and impacts in the Eastern Mediterranean and the Middle East. Climatic Change, 114(3): 667-687. http://dx.doi.org/10.1007/s10584-012-0418-4
[11] Kamel, A.H., Afan, H.A., Sherif, M., Ahmed, A. N., El-Shafie, A. (2021). RBFNN versus GRNN modeling approach for sub-surface evaporation rate prediction in arid region. Sustainable Computing: Informatics and Systems, 30: 100514. http://dx.doi.org/10.1016/j.suscom.2021.100514
[12] Sulaiman, S.O., Najm, A.B.A., Kamel, A.H., Al-Ansari, N. (2021). Evaluate the optimal future demand of water consumption in al-Anbar province in the west of Iraq. International Journal of Sustainable Development and Planning, 16(3): 457-462. http://dx.doi.org/10.18280/IJSDP.160306
[13] Adamo, N., Al-Ansari, N., Sissakian, V.K., Knutsson, S., Laue, J. (2018). Climate change: consequences on Iraq’s environment. Journal of Earth Sciences and Geotechnical Engineering, 8(3): 43-58.
[14] Sulaiman, S.O., Kamel, A.H., Sayl, K.N., Alfadhel, M.Y. (2019). Water resources management and sustainability over the Western desert of Iraq. Environmental Earth Sciences, 78(16): 495. http://dx.doi.org/10.1007/s12665-019-8510-y
[15] Al-Hasani, A.A. (2021). Trend analysis and abrupt change detection of streamflow variations in the lower Tigris River Basin, Iraq. International Journal of River Basin Management, 19(4): 523-534. http://dx.doi.org/10.1080/15715124.2020.1723603
[16] Issa, I.E., Al-Ansari, N., Sherwany, G., Knutsson, S. (2014). Expected future of water resources within Tigris–Euphrates rivers basin, Iraq. Journal of Water Resource and Protection, 6(5): 421-432. http://dx.doi.org/10.4236/jwarp.2014.65042
[17] Abbas, N., Wasimi, S.A., Al-Ansari, N., Nasrin Baby, S. (2018). Recent trends and long-range forecasts of water resources of northeast Iraq and climate change adaptation measures. Water, 10(11): 1562. http://dx.doi.org/10.3390/w10111562
[18] Tamween Ajeel AL-Heetimi, O., Abidalla, W.A., Abbas Jaber, J. (2015). Flood forecasting in upper Zab River using SWAT hydrological model. Journal of Kerbala University, 11(4): 133-144.
[19] Osman, Y., Al-Ansari, N., Abdellatif, M. (2019). Climate change model as a decision support tool for water resources management in northern Iraq: A case study of Greater Zab River. Journal of Water and Climate Change, 10(1): 197-209. http://dx.doi.org/10.2166/wcc.2017.083
[20] Mohammed, R.J. (1989). Development of A Mathematical Model for Wadi Horan Catchment. M. Sc. Thesis.
[21] Al-Ansari, N., Knutsson, S. (2011). Water and climate change in the MENA-region adaptation, mitigation, and best practices. International Conference Possibilities of Restoring the Iraqi Marshes Known as The Garden of Eden.
[22] Al-Ansari, N. (2013). Management of water resources in Iraq: Perspectives and prognoses. Engineering, 5(6): 667-684. http://dx.doi.org/10.4236/eng.2013.58080
[23] United Nations. Economic and Social Commission for Western Asia. and Bundesanstalt für Geowissenschaften und Rohstoffe., Inventory of shared water resources in western Asia.
[24] Abdulla, F., Al-Badranih, L. (2000). Application of a rainfall-runoff model to three catchments in Iraq. Hydrological Sciences Journal, 45(1): 13-25. http://dx.doi.org/10.1080/02626660009492303
[25] Sissakian, V.K., Al-Ansari, N., Adamo, N., Knutsson, S., Laue, J. (2018). Geology of the Tigris River with emphasize on the Iraqi Part. Journal of Earth Sciences and Geotechnical Engineering, 8(3): 145-166.
[26] Al-Faraj, F., Shami, A., Abdulqadir, H., Kareem, K. (2015). The preparation of the world bank’s country water resources assistance strategy for Iraq. http://dx.doi.org/10.13140/RG.2.1.2702.8323