Ghadeer Jamal Hasham | Majeed Mattar Ramal*
© 2022 IIETA. This article is published by IIETA and is licensed under the CC BY 4.0 license (http://creativecommons.org/licenses/by/4.0/).
OPEN ACCESS
This study aims to assess the water quality of the Euphrates river in the section Fallujah Euphrates Reach (FER), in the city of Fallujah, western Iraq. Six heavy metals: $C r^{3+}$, $\mathrm{Fe}^{2+}$, $\mathrm{Zn}^{+2}$, $\mathrm{Mn}^{+2}$, $N i^{+2}$ and $P b^{+2}$ and ten water stations were chosen for the purpose of knowing whether or not these minerals are available in this important section of the Euphrates river and their concentrations in the river water because these minerals are harmful to health due to its lack of decomposition and accumulation within the organs of the body of living organisms. The samples were analyzed using Inductively Coupled Plasma Atomic Emission Spectrometry ICP-OES. Heavy Metal Pollution Index (HMPI), Heavy Metal Evaluation Index (HMEI), and Contamination Degree (CD) were employed to evaluate water quality. The findings were revealed that concentration of $F e^{2+}$, $N i^{+2}$, and $Z n^{+2}$ exceeded the permissible limits based on Iraqi standard IQS, World Health Organization WHO, and United States Environmental Protection Agency USEPA standards, whereas $\mathrm{Cr}^{3+}$, $P b^{+2}$, and $M n^{+2}$ concentrations were non-existent. Based on HMPI, HMEI and CD values, pollution of the Euphrates river is low. which indicates a small amount of pollution, and because the Euphrates water discharge is high, the concentration of heavy metals does not affect the river water. According to national and international guidelines, FER suffers from a low level of heavy metal pollution. However, the (CD), (HMPI), and (HMEI) indices indicated that FER water quality was satisfactory. In other words, the water quality of the Euphrates river in the current study reach is good, but that does not mean that the water is used without treatment to be pumped into the city. It has a low pollution rate, but that may have a negative impact on the health of consumers.
water quality assessment, HMPI, HMEI, CD
Water scarcity is spreading across the world, and the strain on current water resources is increasing as a result of rising demand in a variety of sectors, including household use, industrial use, hydropower generation, and agriculture. Water availability in Iraq is highly variable both spatially and temporally, and the country has experienced significant water scarcity as a result of dams built in riparian countries on the Tigris and Euphrates, in addition to the influence of several hydrological factors [1]. The water demand in Iraq is increasing due to the growth of the population, and the freshwater supply's long-term viability is jeopardized as a result of widespread groundwater depletion, pollutants in surface water, and climate change. Iraq is located in arid and semiarid zones and suffers from high temperatures and decreases in rainfall amounts, which cause water shortages and have inadequate freshwater resources to suit the requirements of the local people [2]. The quality of Iraq's surface water has also worsened as a result of the rise in wastewater dumped into rivers without proper treatment, fast population expansion, mismanagement of water resources, and drought caused by climate change as a result of Iraq's political instability. This puts a strain on water treatment plants' processes (WTPs). Water loss and microbiological contamination may occur as it enters the distribution system [3].
Iraq's drinking water is supplied by rivers, lakes, wells, and springs. These sources are exposed to a range of contaminants as a result of non-point and point sources such as sewage, agricultural, and industrial wastes, which are difficult to regulate, monitor, and analyze. The chemical, physical, and biological properties of water are used to define its quality [4]. Iraq drew approximately 42.8 km3 of water in 1990, which was used for agriculture (90%), household (4%), and industrial (6%) purposes. Agriculture consumes 85 percent of the water withdrawn, according to the most recent projections. are available in 100% of urban areas but only 54% of rural areas. This is a common misunderstanding [5].
In recent years, the water has suffered from increased pollution problems as a result of the introduction of chemicals and compounds into the environment, causing a disturbance in the balance of their components, including biotic and abiotic components, when compared to natural circumstances. This might be due to human activity, which causes biological, physical, and chemical changes in key environmental metals such as air, water, and soil. Increased quantities of contaminants, particularly heavy metals, have harmed the aquatic ecosystem [6]. The contamination of heavy metals is a global problem, albeit the severity and extent of pollution is spatially fluctuated. Leastwise 20 type of metals are classified as hazardous, with half of them being discharged into the environment in amounts that pose serious health hazards. Because of their persistence, bio-magnification, and accumulation in the food chain, the discharge of heavy metals without effective treatment poses a substantial risk to public health, which causes reduced growth and development, cancer, organ damage, nervous system damage, and death in extreme situations [7]. Iraq's death rate has been rising, according to estimates by the World Health Organization. Malignant neoplasms claimed the lives of 2738 people in 2017, 21766 people in 2018, and 22737 people in 2019 [8].
Surface water pollution with harmful heavy metals and increased nutrients is a major problem globally owing to natural processes such as erosion, air deposition, and mineral weathering, as well as human activities such as agricultural, industrial, and urban operations. Because heavy metal buildup in aquatic ecosystems can pose a threat to humans and wildlife, researchers have been working on detecting trace metals and assessing their impact on the watery environment [9]. Cu, Fe, Mn, Ni, and Zn are necessary micronutrients for animals and plants, while Cd, Cr, Pb, and Co have no known physiological effects [10]. The metal ions' toxicity to mammalian systems is caused by their chemical interaction with the membrane system, enzymes, and cellular structural proteins. The organs that acquire the largest quantities of the metal in vivo are generally the target organs of certain metal toxicities. In man and other experimental animals, metals have been demonstrated to induce acute and chronic poisoning. The negative consequences of specific heavy metals are briefly discussed in Table 1 [11].
Table 1. Heavy metals origin and health impacts
|
HMs |
Target organs |
Primary sources |
Clinical effects |
|
Mn |
Nervous system |
Fumes and Industrial dust. |
Peripheral and central Neuropathies. |
|
Pb |
Renal, Hematopoietic and Nervous system |
Polluted of food and from fumes and industrial dust. |
Anemia, disorders central nervous, Encephalopathy and peripheral Neuropathy. |
|
Ni |
Skin and pulmonary |
Aerosols, industrial dust. |
Dramatis, Cancer. |
|
Cr |
Pulmonary |
Polluted of food and from fumes and industrial dust. |
Ulcer, Respiratory cancer and perforation of Nasal septum. |
|
Fea |
Liver, Cardiovascular system, and Kidneys |
Drinking water, iron pipes, cookware, and preparations. |
Excess iron in the body causes liver and kidney damage while decreases iron causes Anemia. |
|
Znb |
Digestive and immune system, growth, hormones |
Glavanizing, plating iron and steel and its found inside fish. |
Diabetes, Anemia, Skin inflammation, Nausea. |
The heavy metal pollution index (HMPI) was used to assess the concentrations of heavy metals Mn, Fe, Sr, As, Pb, Cr, Cu, Se, Al, and Ni in two Antalya streams, Goksu and Duden [14]. The result of analyzing the concentration of heavy metals using HMPI showed that the minerals are arranged as follows in the Goksu stream from the highest concentration: Sr > Fe > Al > Ni > As > Cu > Mn> Pb > Cr > Se, while the order of concentration of heavy metals in Duden was as follows: Sr > Fe > Al > Mn > As > Ni > Cu > Pb > Cr > Se. where the water samples were classified as good, bad, and very bad in most of the sites. It was found that both Al and Sr concentrations exceeded the permissible limit in both streams. This may be caused by urbanization in those areas or the influence of human factors [14]. Khan et al. measured the concentration of heavy metals in the Gomti river to assess its pollution status using the heavy metal pollution index. They found that the average value of the HMPI is higher than 100, which indicates a critical state of pollution because 30% of the sites had an index value of less than the high pollution level, while 60% of the sites had an index value higher than 100, which indicates a severe pollution condition [15].
This study aims to assess the heavy metals concentrations of water within the Euphrates river in the specific section of the study extending from the Saqlawiyah Bridge to Fallujah Dam in Anbar Governorate. Indicators of heavy metal contamination were used, including the heavy metal pollution index (HMPI), the heavy metal evaluation index (HMEI), and the contamination degree (CD), to assess the water quality of the Euphrates river. About thirty water samples were collected monthly, where three samples were taken from each station and mixed together to represent one sample for each station. The indicators of contamination of the three heavy metals mentioned above were applied to evaluate the water quality of Euphrates river and then compare the results of the indicators with permitted limits to identify the appropriateness of the Euphrates river for drinking purposes. The application of these indicators depends on several variables. For example, the application of the heavy metals pollution index depends on the measured concentrations of metals and the recommended values by adopting different standard specifications and ideal concentrations in addition to the number of measured metals and the unit weight for each metal, while the application of the heavy metals evaluation index depends on the maximum admissible concentration (MAC), as well as the pollution degree index depends on the maximum standard permissible value.
2.1 Study area
The Euphrates river originates in Turkey's southeast. It is the longest river in southwest Asia, measuring 2781 kilometers in length. It has a catchment area of 444,000 km2, with 17.1% in Syria, 28% in Turkey, and 39.9% in Iraq [16]. It is one of Iraq's longest rivers, with five major tributaries running through it. However, there are no tributaries within Iraq. The river travels from Turkey's eastern highlands, via Syria, and from the middle western portion enters into Iraqi territory, where it flows westward across Iraq's middle region before joining the Tigris River in the south [17].
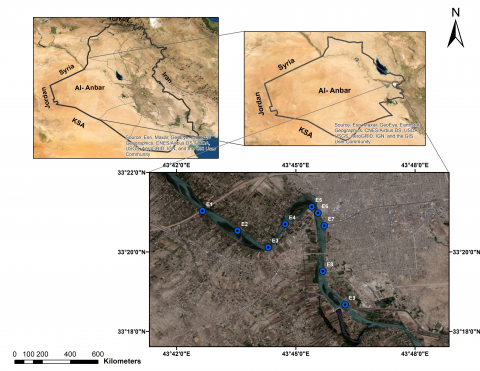
Figure 1 shows the study area of the Fallujah Euphrates Reach (FER).
The Euphrates river flows through Fallujah city, which is situated between two longitudes and latitudes (43°44'58" – 43°49'33") east and (33°21'09" – 33°17'47") north in the northern hemisphere, and it lies 60 kilometers west of Baghdad and 47 kilometers east of Ramadi, the administrative capital of Anbar Governorate [18]. The river flows through the Anbar governorate and crosses the Syrian border, and it is a major water supplier for two large cities (Ramadi and Fallujah) as well as some villages and towns [19]. Where the river represents the main source of drinking water as well as being used in industrial and agricultural activities, it represents an estuary for water treatment plants and sewage plants [20, 21].
Figure 1. Study area site and sampling stations
2.2 Sampling
Water samples were collected using high-quality polyethylene bottles with a capacity of 1 L, where the polyethylene bottles were washed with water and then rinsed with nitric acid HNO3 and kept for a whole night before being used to collect samples. Water samples were collected from 10 locations along the Euphrates river at a rate of once per month. The samples were taken from the left and right banks and from the middle point inside the river for each sampling location along the course of the river. The samples are collected approximately 30 cm under the surface water where the sampling bottle is immersed under the water and its mouth is closed with a stopper, directing the nozzle against the water stream and raising the stopper [22]. The sample must be kept in the refrigerator at room temperature (1 $\mp$ 4℃) until it reaches the laboratory. A map (Garmin GPS map 60 Csx) was used to locate sampling locations for coordinate availability.
2.3 Materials
The concentration of heavy metals in water samples have been estimated using inductively coupled plasma atomic emission spectrometry (ICP-OES) type HORIBA (France) with a torch type of silica.
2.4 Heavy metal pollution assessment
2.4.1 Heavy metal pollution index (HMPI)
The heavy metal pollution index (HPI) is a grading system that calculates the combined impact of specific heavy metals on water quality. The rating system assigns a random number between zero and one, and its selection is based on the relative relevance of specific quality factors [8, 23, 24]. The total influence of individual HMs on the quality of surface water is represented by this index. Each HM is assigned a score based on its relative importance, which is inversely proportional to the suggested standard value for that HM [25]. In this study, the weighting value is inversely proportional to the standard value based on the Eq. (1) [24]. HMPI calculated by applying Eq. (2) [25, 26].
HMPI=$\frac{\sum_{i=1}^{n} W_{i} Q_{i}}{\sum_{i=1}^{n} W_{i}}$ (1)
$Q_{i}=\sum_{i=1}^{n}\left|\frac{M_{i}-I_{i}}{S_{i}-I_{i}}\right|$×100 (2)
where, Wi is unit weighting of the ith HMs, Qi is the sub-index of ith HMs, n is Total number of HMs, Ii is Ideal value of ith HMs, Si is standards value of ith HMs, Mi is examined concentration of ith HMs in (µg/L).
Water quality can be classified into three classes based on HMPI, involving low pollution of HMS (below 100), threshold risk (equal to 100), and high risk (above 100). When HPI is greater than 100, it means the water is unsafe for human consumption [8, 24]. The minus sign (-) denotes the numerical difference between the two numbers, with the algebraic sign being ignored [25]. WHO recommendations were used to calculate the maximum concentration limit (MCL) [26]. The parameters of heavy metal for the calculation of water quality indices (WQIs) are illustrated in Table 2.
Table 2. Heavy metals factors applied for water quality Index (WQI) [8, 26]
|
HMs |
MCL (µg/l) |
Wi |
Ii |
Si |
Hmax (µg/l) |
|
Zn |
5000 |
0.0002 |
3000 |
5000 |
5000 |
|
Pb |
1.5 |
0.70 |
10 |
100 |
1.5 |
|
Cr |
50 |
0.02 |
50 |
1 |
50 |
|
Mn |
50 |
0.02 |
500 |
100 |
50 |
|
Fe |
300 |
0.003 |
200 |
300 |
200 |
|
Ni |
20 |
0.05 |
20 |
20 |
20 |
CD denotes the HMs' combined negative influence on surface water [27]. CD represents the total of all concentration factors. The contamination degree must be determined separately for each sample that exceeds the standard value. The CD index is calculated in Eq. (3) as follows:
$\mathrm{CD}=\sum_{i=1}^{n} C f_{i}$ (3)
$C f_{i}=\frac{C A_{i}}{C N_{i}}-1$ (4)
where, CD is contamination degree; Cfi is contamination Factor for ith of HM; CAi is measured or analytical value for ith parameter; CNi is Standard permissible value for ith parameter.
The degree of pollution between sites can be classified in three classes depending on the value of CD, which included, low pollution at (CD<1), moderate pollution at (CD>1) and high pollution at (CD>3) [28].
2.4.3 Heavy metal evaluation index (HMEI)
HMEI provides data on the comprehensive water quality concerning heavy metals [29]. This index was estimated based on Eq. (5) below [30].
HMEI $=\sum_{i=1}^{n} \frac{H_{C}}{H_{M A C}}$ (5)
where:
$H_{C}$ : Is represent the monitored value.
$H_{M A C}$ : Is represent the maximum admissible concentration (MAC) of the ith parameter.
The HMEI is grouped into three groups: low (HMEI less than 10), medium (which is a value of HMEI between 10 and 20), and high (HMEI above 20).
3.1 Concentration of heavy metals
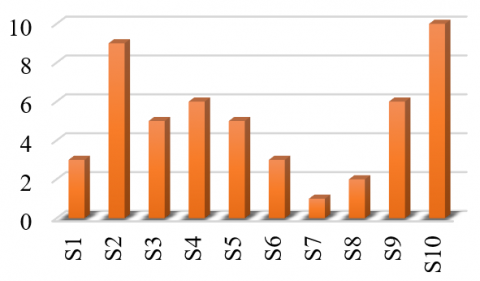
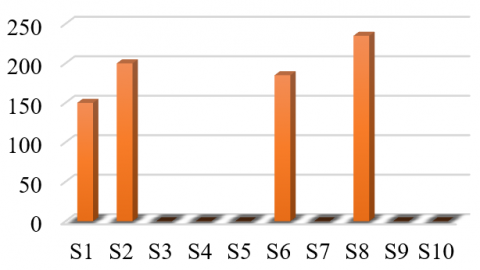
The levels of heavy metals acquired from the Fallujah Euphrates Reach (FER) in the studied region are determined objectively in Table 3. The concentration of $\mathrm{Cr}^{3+}$, $P b^{+2}$ and $M n^{+2}$ were below detection levels (BDL), The concentration of $F e^{2+}$, $\mathrm{Zn}^{+2}$ and, $N i^{+2}$ are listed in Figures 2, 3 and 4 respectively. According to the possible results, the concentrations of $F e^{2+}$, $\mathrm{Zn}^{+2}$, $N i^{+2}$ exceeded the levels required for standard specifications, while all of the $\mathrm{Cr}^{3+}$, $M n^{+2}$, and $P b^{+2}$ concentrations were very low and can be considered non-existent, meaning that their concentration is almost zero. Table 3 shows the heavy metal levels in water samples obtained from the research region. The concentration of heavy metals Involved in the water samples is arranged in this way: $\mathrm{Zn}^{+2}>F e^{2+}$, $>\mathrm{Ni}^{+2}>\mathrm{Cr}^{3+}=\mathrm{Pb}^{+2}=M n^{+2}$. The concentration of $\mathrm{Zn}^{+2}$ ranged from 235 to 0 µg/l, with a (average ± standard deviation) (Avge. ± SD) of 101.467 ± 77 µg/l, exceeding the guidelines of Iraqi standards (IQS), USEPA, and World Health Organization (WHO) in all sites. The average value of $F e^{2+}$ was located between 10 and 1 µg/l) with (Avge. ± SD) of (2.905933 ± 5 µg/l) with its concentration exceeding the recommended limits for IQS, USEPA, and WHO specifications. The average value of $N i^{+2}$ ranged from (4–0 µg/l) with an (Avge. ± SD) of (1.100505 ±1.9 µg/l) with its concentration exceeding the recommended limits for IQS, USEPA, and WHO specifications, while the concentration of ($\mathrm{Cr}^{3+}$, $M n^{+2}$, and $P b^{+2}$) were below detection levels (BDL). Based on USEPA, Iraqi standard IQS, and WHO standards for drinking water, the Euphrates river was slightly polluted with heavy metals such as $F e^{2+}$, $\mathrm{Zn}^{+2}$, and $N i^{+2}$, which making it suitable for drinking and human consumption. The WQIs of each sample site were calculated separately following worldwide criteria [29], and are characterized by the HMPI, contamination degree CD, and heavy metal evaluation index HMEI. According to IQS, the values of HMPI were ranged between (5.511192 - 0.060496) with (Avge. ± SD) of (1.499237 ± 2.621113), according to WHO the values of HMPI were ranged between (0.207555 - 0.020756) with (Avge. ± SD) of (0.059136 ± 0.109531), and the values of HMPI were ranged between (0.174886 - 0.017489) with (Avge. ± SD) of (0.049828 ± 0.092291) according to USEPA. According to the findings of WQIs, the values of HMPI in all stations did not exceed the ultimate limit of 100.
The HMPI was calculated by averaging the concentration data of all stations and HMs and found to be 2.62111, 0.109531, and 0.092291 based on Iraqi standards (IQS), WHO, and USEPA recommendations. All of these values were less than the critical value (100) of HMPI.
Figure 2. Iron (Fe) concentration (µg/L)
*S1, S2, …, S10 is represent arrange of stations for taking samples
Figure 3. Zinc (Zn) concentration (µg/L)
Table 3. Average heavy metals (µg/L) and WQIs (HMPI, HMEI and CD)
|
Stations |
Average HMS concentration (µg/l) |
Water Quality index (WQI) |
|
||||||||||
|
Cr |
Fe |
Zn |
Pb |
Ni |
Mn |
HMPI (IQS) |
HMPI (WHO) |
HMPI (USEPA) |
HMEI (IQS) |
HMEI (WHO) |
HMEI (USEPA) |
CD |
|
|
S1 |
B.D.L |
3 |
150 |
B.D.L |
3 |
B.D.L |
4.110 |
0.0734 |
0.06191 |
1.1433 |
0.7471 |
0.6295 |
-5.805 |
|
S2 |
B.D.L |
9 |
200 |
B.D.L |
4 |
B.D.L |
5.511 |
0.2017 |
0.1699 |
1.6152 |
1.3075 |
1.1017 |
-5.715 |
|
S3 |
B.D.L |
5 |
B.D.L |
B.D.L |
2 |
B.D.L |
2.752 |
0.1037 |
0.08744 |
0.6352 |
0.3113 |
0.2623 |
-5.875 |
|
S4 |
B.D.L |
6 |
B.D.L |
B.D.L |
2 |
B.D.L |
2.758 |
0.1245 |
0.10493 |
0.6533 |
0.3735 |
0.3147 |
-5.87 |
|
S5 |
B.D.L |
5 |
B.D.L |
B.D.L |
2 |
B.D.L |
2.752 |
0.1037 |
0.08744 |
0.6352 |
0.3113 |
0.2623 |
-5.875 |
|
S6 |
B.D.L |
3 |
185 |
B.D.L |
2 |
B.D.L |
2.751 |
0.0760 |
0.06411 |
0.9346 |
0.8779 |
0.7397 |
-5.848 |
|
S7 |
B.D.L |
1 |
B.D.L |
B.D.L |
2 |
B.D.L |
2.728 |
0.0207 |
0.01748 |
0.8983 |
0.0622 |
0.0524 |
-5.895 |
|
S8 |
B.D.L |
2 |
235 |
B.D.L |
1 |
B.D.L |
1.387 |
0.0590 |
0.04977 |
0.7350 |
1.0024 |
0.8447 |
-5.893 |
|
S9 |
B.D.L |
6 |
B.D.L |
B.D.L |
1 |
B.D.L |
1.397 |
0.1245 |
0.10493 |
0.1088 |
0.3735 |
0.3147 |
-5.92 |
|
S10 |
B.D.L |
10 |
B.D.L |
B.D.L |
B.D.L |
B.D.L |
0.060 |
0.2075 |
0.17488 |
0.1814 |
0.6226 |
0.5246 |
-5.95 |
|
Min |
0.0 |
1 |
0.0 |
0.0 |
0.0 |
0.0 |
0.060 |
0.0207 |
0.01748 |
0.1088 |
0.0622 |
0.0524 |
-5.95 |
|
Max |
0.0 |
10 |
235 |
0.0 |
4 |
0.0 |
5.511 |
0.2075 |
0.17488 |
1.6152 |
1.3075 |
1.1017 |
-5.715 |
|
Avar |
0.0 |
5 |
77 |
0.0 |
1.9 |
0.0 |
2.621 |
0.1095 |
0.09229 |
0.7540 |
0.5990 |
0.5047 |
-5.864 |
|
S.D |
0.0 |
2.90 |
101.4 |
0.0 |
1.10 |
0.0 |
1.499 |
0.0591 |
0.04982 |
0.4383 |
0.3830 |
0.3227 |
0.065 |
|
Guide-line |
50 |
300 |
5000 |
1.5 |
20 |
50 |
100 |
100 |
100 |
10 |
10 |
10 |
1 |
Figure 4. Nickel (Ni) concentration (µg/L)
3.2 Water quality indices (WQIs)
The heavy metal evaluation index (HMEI) was applied for the purpose of evaluating the water quality of the Euphrates river in the study area section and indicating the suitability of the river water for drinking purposes. The values of HMEI were ranged from 0.108892 to 1.615245 with (Average ±S.D) value of (0.754083±0.438366) according to the IQS recommendation, and the value of HMEI according to the WHO recommendation was ranged from 0.062267 to 1.307597 with (Average ±S.D) value of (0.599004±0.383037), while the value of HMEI according to the USEPA recommendation was located between 0.052466 and 1.101784 with an (Average ±S.D) value of (0.504722 ±0.322747). The results show that the HMEI values in all stations and for three standard specifications are less than the recommended low pollution value of 10. The lowest value of the HMEI was according to the Iraqi standard, at the S9, which represents the upstream of Fallujah dam, while the lowest value of the indicator appeared by adopting WHO and USEPA specifications at the S7, respectively. The HMEI, which is derived using average concentration measurements from all HMs and all stations according to IQS, WHO, and USEPA, is 0.754083, 0.599004, and 0.504722, respectively, which is lower than the critical limit. The contamination degree (CD) was used as a standard for determining the extent of water pollution with heavy metals. The value of CD ranged from-5.95 to-5.715 with an average ±S.D value of (-5.8646±0.065444). The CD value in all stations is less than 1, which indicates that the pollution is low in this section according to the approved classification of low pollution by Ghaderpoori et al. [26]. The concentration of iron, nickel, and zinc was higher than the values recommended by the specifications of IQS (100, 200, 5000) (µg/l), WHO (300,70,3000) µg/l), and USEPA (300, -, 5000) µg/l), while the concentration of chromium, lead, and manganese was less than the permissible concentration. That is, it is less than the level to which the device ICP-OES is sensitive, and it also has lower values of HMPI, HMEI, and CD. Despite the high concentration of some heavy metals in the stations, it did not affect the quality of the water, because of the high discharge of the Euphrates river in this section, which ranges from 300-365m3/sec. The current concentration of some heavy metals does not affect the quality of the water because the river has high drainage. Therefore, the water quality of the Euphrates river is suitable for drinking purposes because all the indicators are lower than the level that represents low pollution, but it is recommended to sterilize it when entering the stations and going through all stages of purification in order to preserve the health of consumers.
The importance of this study comes from the importance of this section as an important source of drinking water for the city of Fallujah , one of the largest cities in Anbar Governorate , for the purpose of Knowing if the river water contains heavy metals or not and to indicate the extent of their concentrations within or exceeding the permissible level because of the danger of these minerals to the life of all living organisms so the water quality of Fallujah Euphrates Reach (FER) was analyzed by using ICP-OES to measure the concentration of six heavy metals (Fe, Zn, Ni, Cr, Pb, and Mn). The results of the analysis showed that the concentration of Fe, Zn, and Ni in all stations was higher than the concentration recommended in the standard specifications of IQS, WHO, and USEPA, while the device did not detect concentrations of Cr, Pb, and Mn because their concentrations in the water may be very low, or they may not be present in the water samples at all. On the other hand, the values of each HMPI, HMEI, and Cd in all stations were low as they were less than the low level of pollution. Thus, the Euphrates river water in the section (FER) is classified as low risk, and the presence of concentrations of some minerals did not affect the quality of the water because the river has high drainage, which means that there are few health and environmental problems, but the quality of the water must be taken care of, even if it is low in pollution and not used directly from the river. Rather, it is withdrawn from stations and passes through several stages in order to be purified and then pumped back into the city.
[1] Al-Ani, R.R., Al Obaidy, A.H.M.J., Badri, R.M. (2014). Assessment of water quality in the selected sites on the Tigris River, Baghdad-Iraq. International Journal of Advanced Research, 2(5): 1125-1131.
[2] Ameen, H.A. (2019). Spring water quality assessment using water quality index in villages of Barwari Bala, Duhok, Kurdistan Region, Iraq. Applied Water Science, 9(8): 1-12. https://doi.org/10.1007/s13201-019-1080-z
[3] Mahmood, W., Ismail, A.H., Shareef, M.A. (2019). Assessment of potable water quality in Balad city, Iraq. In IOP Conference Series: Materials Science and Engineering, 518(2): 022002. https://doi.org/10.1088/1757-899X/518/2/022002
[4] Ewaid, S.H., Abed, S.A. (2017). Water quality index for al-gharraf river, southern Iraq. Egyptian Journal of Aquatic Research, 43(2): 117-122. https://doi.org/10.1016/j.ejar.2017.03.001
[5] Al-Ansari, N.A. (2013). Management of water resources in Iraq: Perspectives and prognoses. Engineering, 5(8): 667-684. https://doi.org/10.4236/eng.2013.58080
[6] Al-Taher, Q.M., Akbar, M.M., Al-Qarooni, I.H. (2020). Estimation of heavy metals in water, sediments and bioaccumulation in pseudodontopsis Euphraticus and bellamya bengalensis in Euphrates river in al-nassiriyah city/south of Iraq. Plant Archives, 20(2): 1454-1460.
[7] Akpor, O.B., Muchie, M. (2010). Remediation of heavy metals in drinking water and wastewater treatment systems: processes and applications. International Journal of Physical Sciences, 5(12): 1807-1817. https://doi.org/10.5897/IJPS.9000482
[8] Ramal, M.M., Jalal, A.D., Abdulhameed, U.H. (2021). Heavy metal assessment in taps drinking water of Ramadi city using water quality Indices, Anbar Province, Iraq. International Journal of Sustainable Development and Planning, 16(7): 1349-1357. https://doi.org/10.18280/ijsdp.160715
[9] Li, S., Zhang, Q. (2010). Risk assessment and seasonal variations of dissolved trace elements and heavy metals in the Upper Han River, China. Journal of Hazardous Materials, 181(1-3): 1051-1058. https://doi.org/10.1016/j.jhazmat.2010.05.120
[10] Salah, E.A.M., Al-Hiti, I.K., Alessawi, K.A. (2015). Assessment of heavy metals pollution in Euphrates river water, Amiriyah Fallujah, Iraq. Journal of Environment and Earth Science, 5(15): 12.
[11] Mahurpawar, M. (2015). Effects of heavy metals on human health. International Journal of Research-Granthaalayah, 2394-3629.
[12] Alomary, A., Al-Momani, I.F., Obeidat, S.M., Massadeh, A.M. (2013). Levels of lead, cadmium, copper, iron, and zinc in deciduous teeth of children living in Irbid, Jordan by ICP-OES: Some factors affecting their concentrations. Environmental Monitoring and Assessment, 185(4): 3283-3295. https://doi.org/10.1007/s10661-012-2790-y
[13] Jamshaid, M., Khan, A.A., Ahmed, K., Saleem, M. (2018). Heavy metal in drinking water its effect on human health and its treatment techniques-A review. International Journal of Biosciences, 12(4): 223-240. https://doi.org/10.12692/ijb/12.4.223-240
[14] Leventeli, Y., Yalcin, F., Kilic, M. (2019). An investigation about heavy metal pollution of duden and goksu streams (Antalya, Turkey). Applied Ecology and Environmental Research, 17(2): 2423-2436. https://doi.org/10.15666/aeer/1702_24232436
[15] Khan, R., Saxena, A., Shukla, S. (2020). Evaluation of heavy metal pollution for River Gomti, in parts of Ganga Alluvial Plain, India. SN Applied Sciences, 2(8): 1-12. https://doi.org/10.1007/s42452-020-03233-9
[16] Ghalib, H.S., Ramal, M.M. (2021). Spatial and temporal water quality evaluation of heavy metals of Habbaniyah Lake, Iraq. International Journal of Design & Nature and Ecodynamics, 16(4): 467-475. https://doi.org/10.18280/ijdne.160414
[17] Al-Ansari, N., Adamo, N. (2018). Present water crises in iraq and its human and environmental implications. Engineering, 10: 305-319. https://doi.org/10.4236/eng.2018.106021
[18] Sissakian, V.K., Al-Ansari, N., Adamo, N., Knutsson, S., Laue, J. (2018). Geology of the Euphrates River with emphasize on the Iraqi part. Journal of Earth Sciences and Geotechnical Engineering, 8(3): 167-185.
[19] Al Fahdawi, Y.M.N., Al Ramahi, F.K.M., Alfalahi, A.S.H. (2021). Measurement albedo coefficient for land cover (Lc) and land use (Lu), using remote sensing techniques, a study case: Fallujah city. Journal of Physics: Conference Series, 1829(1): 012003. https://doi.org/10.1088/1742-6596/1829/1/012003
[20] Saod, W.M., Yosif, Y.M., Abdulrahman, M.F., Mohammed, A.H. (2021). Water quality index along the Euphrates between the cities of Al-Qaim and Falluja: A comparative study. In IOP Conference Series: Earth and Environmental Science, 779(1): 012058. https://doi.org/10.1088/1755-1315/779/1/012058
[21] Mahmood, B. (2021). Environmental properties and analysis of the Euphrates river within Anbar governorate in Iraq: A review. Iraqi Journal of Desert Studies, 150-163. https://doi.org/10.36531/ijds/21110109
[22] https://preventmedic.blogspot.com/2015/09/Standard-Methods.html, accessed on 24 March 2022.
[23] Tiwari, A.K., De Maio, M., Singh, P.K., Mahato, M.K. (2015). Evaluation of surface water quality by using GIS and a heavy metal pollution index (HPI) model in a coal mining area, India. Bulletin of Environmental Contamination and Toxicology, 95(3): 304-310. https://doi.org/10.1007/s00128-015-1558-9
[24] Kumar, V., Parihar, R.D., Sharma, A., et al. (2019). Global evaluation of heavy metal content in surface water bodies: A meta-analysis using heavy metal pollution indices and multivariate statistical analyses. Chemosphere, 236: 124364. https://doi.org/10.1016/j.chemosphere.2019.124364
[25] Ramal, M.M., Abdulhameed, U.H., Jalal, A.D. (2021). Trace elements risk assessment in taps drinking water of Ramadi City, Anbar Province, Iraq. International Journal of Safety and Security Engineering, 11(6): 623-634. https://doi.org/10.18280/ijsse.110602
[26] Ghaderpoori, M., kamarehie, B., Jafari, A., Ghaderpoury, A., Karami, M. (2018). Heavy metals analysis and quality assessment in drinking water – Khorramabad city, Iran. Data in Brief, 16: 685-692. https://doi.org/10.1016/j.dib.2017.11.078
[27] Edet, A.E., Offiong, O.E. (2002). Evaluation of water quality pollution indices for heavy metal contamination monitoring. A study case from Akpabuyo-Odukpani area, Lower Cross River Basin (southeastern Nigeria). GeoJournal, 57(4): 295-304. https://doi.org/10.1023/b:gejo.0000007250.92458.de
[28] Mukanyandwi, V., Kurban, A., Hakorimana, E., Nahayo, L., Habiyaremye, G., Gasirabo, A., Sindikubwabo, T. (2019). Seasonal assessment of drinking water sources in Rwanda using GIS, contamination degree (Cd), and metal index (MI). Environmental Monitoring and Assessment, 191(12): 1-13. https://doi.org/10.1007/s10661-019-7757-9
[29] Zakir, H.M., Sharmin, S., Akter, A., Rahman, M.S. (2020). Assessment of health risk of heavy metals and water quality indices for irrigation and drinking suitability of waters: a case study of Jamalpur Sadar area, Bangladesh. Environmental Advances, 2: 100005. https://doi.org/10.1016/j.envadv.2020.100005
[30] Kuntamalla, S., Madhusudan, N., Sakram, G., Saxena, P.R. (2018). Assessment of heavy metal indices for groundwater of granitic terrain in south western part of Rangareddy District, Telangana State, India. Environmental Science. Corpus ID: 212585931.