Julio Cesar Morales Hernández | Oscar Frausto Martinez* | Bartolo Cruz Romero | Jorge Ignacio Chavoya Gama | Fátima Maciel Carrillo González
© 2022 IIETA. This article is published by IIETA and is licensed under the CC BY 4.0 license (http://creativecommons.org/licenses/by/4.0/).
OPEN ACCESS
The Mexican Pacific coast is frequently affected by meteorological systems that cause rain. These events are beneficial when they precipitate in the internal valleys of the basins and water is captured from the highlands by filtration, recharging the aquifers, and allowing surface runoff through rivers and runoffs that are the natural sources of freshwater. On the other hand, these systems are adverse when they precipitate in excess, and additionally, they are associated with bad decisions and urban planning errors that put at risk the life and patrimony of some social sectors, this aspect has become a national security issue for the authorities. The region of Bahia de Banderas has a rainwater drainage network through open-pit channels that partially cover the urban area, a situation that puts the population and its assets at risk since rain considered common causes significant puddles, a situation that is progressively worsening, but the great danger of an extraordinary amount of rain, as has occurred in the past, is represented by the hydrological basins that cross or are adjacent to it, an aspect that will be discussed in greater detail in this article.
watersheds, vulnerability, Jalisco, extreme precipitation
Due to its location and geographical characteristics, Mexico is exposed to the occurrence of hydro-meteorological phenomena, mainly tropical cyclones, river and coastal flooding, intense winds, cold and heat waves, snowfalls, hailstorms, etc. [1]. Related to these phenomena are also severe local storms of high intensity and short duration that cause floods and landslides. On the other hand, there are regions of the country that are affected by water shortages for prolonged periods, causing floods and landslides. Other regions are affected by winter systems.
These weather phenomena that cause rain, on the one hand, are adverse when excessive and are associated with human error, but, on the other hand, bring benefits, since it is the only source of freshwater. Mexico has many hydrological basins, due to the rugged relief; these are of great importance because they capture the water that rains, an aspect that has gradually become a matter of national security.
In the region, the accelerated growth of Puerto Vallarta and its surroundings, including nearby towns in the south of Nayarit, exceeded by far the expectations of having a storm drainage network, a situation that is currently suffered because the rainfall considered common, causes significant puddles, a situation that is gradually accentuated, with more notable rains. With more heavy rains, called copious, rivers and streams overflow, recurrently affecting certain neighborhoods with the loss or damage of household goods, but with the occurrence of a severe local storm defined by the amount of rainfall, or a so-called torrential rain, the effects it would cause in urban areas that are gradually growing in vulnerability, would be disastrous.
In Puerto Vallarta, there is also a latent potential risk that implies the danger of extraordinary flash floods, an experience with which the current generations are not familiar, because the return period is very long, that is to say, it has not occurred in the last decades. The urban area has an adjacent hydrological basin (exoreic) and others that cross certain neighborhoods, also exoreic but geographically known as watersheds, since, starting from a watershed. It is to say that the highest limit that divides the fall of rainwater between two adjacent and opposite slopes, but which finally discharge their waters individually into the sea, of course, another aspect of risk is that part of the urban area is located precisely at the mouth of these basins (Figure 1).
There is also interest in society to carry out the change of land use and build new settlements with a criterion of high added value and, under a series of unfounded arguments, these settlements may be in risk areas, ignoring Civil Protection reports. which will undoubtedly cause disasters and will be blamed on climate change.
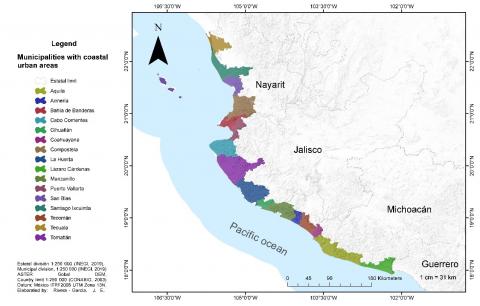
Figure 1. Hydrologic basins of the coastal zone of western Mexico
It is of great importance to take into consideration watersheds, without establishing municipal or state boundaries, in planning for the mitigation of the effects of disasters and sustainable development; it is necessary to examine the main obstacles to the implementation of such actions and to identify priority actions to promote the rational management of hydrological basins as an integral element of disaster risk prevention and mitigation, as well as in reconstruction plans [2]. For this purpose, the objective of this work is not to obtain exact dimensions with calculation in diverse parameters as it exists in some studies for the use of the vital liquid, but to visualize to have an instantaneous concept of the danger that these open canopies represent to the sky waiting for the fall of water that later will pass near or through these settlements.
Accelerated urban growth is one of the phenomena that characterize coastal areas, especially in Mexico; this spatial and demographic growth increases the demand for natural resources that is reflected in a transformation of natural landscapes [3, 4]. Urbanization and land-use change have direct effects on natural systems such as vegetation, soil, water infiltration, quantity, and flow of surface runoff, among others [5, 6]. Moreover, when natural systems are of wide spatial contrast (coasts with wide relief energy, forest, climatic, and water diversity [7, 8]). Floods in urban areas are divided into four categories: local, riverine, coastal, and flash floods [9].
Urbanization is one of the main characteristics of this century [10], where diverse and constantly changing economic activities converge [11], with great influence on the hinterland [12], and where competitions and landscape transformations are constant [13]. In addition to the above, the absence of data on the physical characteristics of watersheds, meteorological data and history of adverse events is recurrent in these areas of extensive urban growth [14, 15].
Due to its location and geographic characteristics, the coasts of the Mexican Republic are exposed to dangerous natural events, of which hydrometeorological phenomena (mainly tropical cyclones, river and coastal flooding, intense winds, cold and heat waves, snowfall, hailstorms, etc., are more recurrent) [16]. Associated with these phenomena, severe local storms of high intensity and short duration occur, causing floods and landslides [17], which are reflected in rapid response in landslides and water scale level along the valley, with flash floods, infrastructure damage, and loss of life [11, 18].
Given this scenario, public actions have been implemented to mitigate disasters, where Mexico's Marine and Coastal Policy [19] points out three major strategies in Objective I (Contribute to improving the living conditions of coastal populations through the sustainable use of natural resources, comprehensive coastal and marine planning, and the reduction of vulnerability to climate change, seeking in parallel the more equitable distribution of the wealth generated):
- Support the implementation of Urban Development Programs in coastal municipalities, with criteria for the social use of coastal spaces in tourist areas (1.3).
- Support the design, implementation and/or coordination of vulnerability reduction actions within the framework of the State Climate Change Programmes and public policy instruments on climate change (strategy 1.4).
- Promote the identification of areas with potential for the relocation of human settlements and/or urban infrastructure located in risky zones (strategy 1.5).
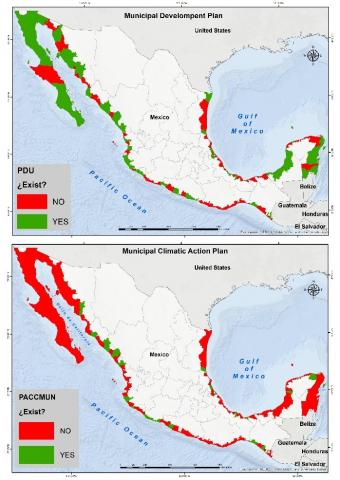
Thus, three public policy inputs are strategic for coastal zone planning for disaster prevention at the local level: the municipal urban development plan, the municipal climate action plan, and the Municipal Risk Atlas (Figure 2). Forty-two percent of Mexico's coastal municipalities have an urban development plan in effect in 2017; as for the existence of a municipal climate action plan, only 15% of Mexico's coastal municipalities report a plan and only 65% of municipalities have a municipal hazard or risk atlas, although they are outdated and only 5% comply with having an atlas that is no more than 5 years old.
In this context, this study aims to characterize the urbanization relationships in three watersheds of the city of Puerto Vallarta, Jalisco – Mexico; a city characterized by extreme urbanization rates in the last 50 years [20], transformations of the natural landscape [21] and 12 declarations for extreme hydrometeorological and climatic events in the period from 2000 to 2020. Of these declarations, five are for disasters associated with two hurricanes (2006 and 2015), two severe or atypical rain events (2002 and 2015) and a prolonged and atypical drought (2000); six are emergency declarations corresponding to a warm wave (2018), three hurricanes (Kenna, Jova and Patricia) and two atypical rains (in 2015 and tropical storm Narda) [22].
Figure 2. Inputs for coastal planning in Mexico
The world’s cities are facing different challenges than those faced 20 years ago [23]. The main ones being: urban growth, changes in population and family structure, the growth of the suburbs and informal settlements, as well as provision of quality basic services. Currently, 54% of the world's population lives in urban areas [24]. In Mexico, 72% of the population lives in cities [25]. The national urban system has been transformed and integrated from 384 cities, where growth is mainly focused on medium-sized cities [26].
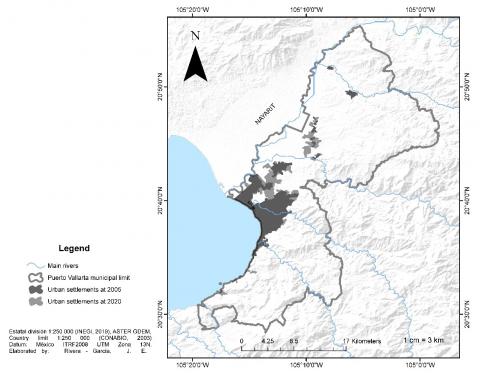
Finally, in the Mexican coastal context, there are 96 cities and 151 municipalities [27]. The municipality of Puerto Vallarta, Jalisco, is made up of 104 localities (urban and rural) of which 24 are seasonal, concentrating 98% of the total population of the municipality, which amounts to 291, 839 inhabitants [28]. Human settlements are mainly concentrated in the fluvial plain of the Ameca River, in the coastal plain, in the plain with isolated hills and hills, and in the mountainous slopes of San Sebastian del Oeste and El Cuale [21] (see, Figure 3). For Lavell (quoted in Frausto, et al, in the press), five elements are fundamental for the analysis of integrated disaster risk management at the municipal level: Densification (exposure).
The western region is a recurrent threat zone for extreme hydrometeorological phenomena such as hurricanes, tropical storms, severe norths, droughts, and fires, which are interrelated with the exposure caused by the contrasting high-altitude relief and poor drainage areas associated with the Ameca River deltaic system [29, 30]. This municipality is characterized by a high population growth due to migration, being from the decade of the 90s of the last century of 6.5 per year and it is estimated that it will have 400 thousand inhabitants by 2020 [31, 32].
3.1 Environmental degradation (modification of natural characteristics)
The transformation of the natural characteristics of the territory of the coastal cities and coastline of the Ameca River and along the coast and the mountainous zone is evidenced by the growth of its urban stain, population growth, and coastal transformation. In the case of the coastal cities of Puerto Vallarta [31, 33], highlight the census and intercensal growth rates for the period 1990 – 2010, where cities will register maximum levels of growth, the reason for which is migration (Figure 3). In this context, the creation of cities will be a consequence of the policy of development poles in regions with low or no population applied in the 1970s [10].
3.2 Socio-spatial segregation
Two elements highlight the levels of spatial segregation. On the one hand, the great processes of inequality of urban conditions and basic services for human settlements in the municipality, being, since the implementation of tourism as an economic axis in the seventies, one of the demands of the population [33]; however, as of 2010, the demand for urban land exceeds the municipal limits, being this growth prayed towards the development of the planned center of Nuevo Vallarta and hotel infrastructure was the priority, where the development of a system of hotels, condominiums and double-residence houses in the coastal system of the Ameca River located in the municipality of Nuevo Vallarta [34] and that, as of 2014, the metropolitan area of Puerto Vallarta was created, with problems and omissions in the spatial planning in the face of flood contingency and environmental impact [20].
4.1 Study area
Puerto Vallarta is the most important tourist city in the state of Jalisco, on the western Pacific coast of Mexico. It is in the west of the state, at the coordinates 20º27'00'' at 20º59'00'' north latitude and 104º55'00'' at 105º33'00'' west longitude, at an altitude of 2 meters above sea level (Figure 3). It is bordered to the north by the state of Nayarit, to the south by the municipality of Cabo Corrientes and Talpa de Allende, to the east by San Sebastian del Oeste, Mascota, and to the west by the Pacific Ocean. It has very few flat areas; these are located mainly on the right bank of the Ameca River and along the coast, from its mouth to the Cuale River to the south. The climate is semitropical and humid, the maximum temperature is 31℃ in summer and the minimum is 19℃ in winter; the annual average is 25℃. The rainy season runs from mid-June to the end of October, continuing with isolated rains until mid-November; it has an average annual rainfall of 1,417 mm [34].
Figure 3. Location of human settlements in the study area
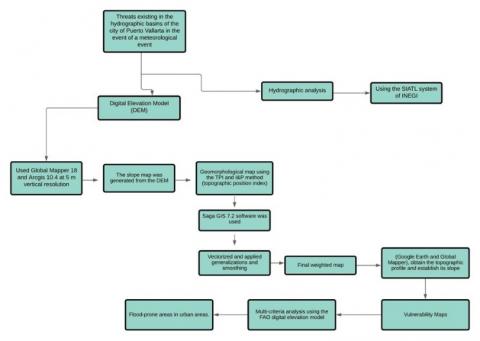
Figure 4. Methodological diagram
4.2 Methods and data
To fulfill the general objective of this research and to know the existing threats in the hydrographic basins of the city of Puerto Vallarta before a meteorological event (Tropical Cyclone and/or extraordinary flood in the lower basin of the Ameca, Pitillal or Cuale), a hydrographic analysis of this basins was carried out, using the SIATL system of INEGI (http://antares.inegi.org.mx/analisis/red_hidro/siatl/), this is a means of disseminating geographic knowledge, specifically on surface hydrography, basic in the construction of scenarios for different projects, such as contingencies of hydrometeorological events, evacuation routes, etc.
For the generation of the Digital Elevation Model (DEM), Global Mapper 18 and Arcgis 10.4 were used at a vertical resolution of 5 m, to recognize the relief gradient between the headwaters of the basin and the deltaic region of Puerto Vallarta. The slope map was generated from the DEM and reclassified according to the elements of the relief units. Likewise, land use and vegetation inputs were used [35]. A geomorphological map was generated using the TPI and I&P (Topographic Position Index) method [36]. The Saga GIS 7.2 software was used for this process and its subsequent reclassification in Arcgis. For the generalization and smoothing were vectorized and applied, as well as overlapping the maps. Thus, obtaining the final weighted map [37].
Subsequently, using GIS (Google Earth and Global Mapper), the polygons and watersheds were differentiated, visualizing the start and endpoints of each basin to obtain the topographic profile and establish its slope. Basins, sub-basins, and micro-basins were also delimited, as well as urbanization areas, to have a vision of the consequences that would arise in different scenarios, especially those related to extreme meteorological events, such as tropical cyclones. All three programs have compatibility for the use of vector and raster formats.
Finally, rainfall records were obtained from automatic weather stations associated with hydrometeorological events (Tropical Cyclone and Severe Local Storm) during the period 2010-2018, and then flood vulnerability maps were made based on a multi-criteria analysis using the FAO digital elevation model, slope model and classification, geomorphological map and land use and vegetation map for flood-prone areas in the urban area (Figure 4).
The urban area of Puerto Vallarta is crossed by the three main rivers: the Cuale, the Pitillal and the Ameca, although there are two relevant intermittent streams, which generate a latent risk during rainy seasons.
The combination of various threats or hazards, combined with the growth of human settlements, gradually increases vulnerability; mainly in the region’s main watercourses (see Figure 5).
On the one hand, there is a geomorphological ramp, that is, a canyon or depression with a particular climate where the frequent flow of sea and land breezes induces the condensation of the breeze itself, as well as downward movements of colder and denser air, which means that this area frequently registers the highest amounts in millimeters of the water column of the entire state of Jalisco in some of the stations of the hydroclimatic network of the National Water Commission (CNA).
Figure 5. Watershed crossing the urban area of Puerto Vallarta
Through a tour of the urban area of Puerto Vallarta from south to north, the crossing with the lower basin of the Cuale River, where water normally flows all year round, was recorded. This basin has an approximate surface area of 274 km² with a length of the main river of 45.2 km and flows out of a channel that has an approximate height of 2,430 meters above sea level and a slope of (3.22%) very close to the foot of the mountain (see Figure 6). The slope of this river is the steepest, indicating according to the behavior of the regional morphological analysis, which indicates that a steeper slope corresponds to a shorter duration of concentration of runoff water in the drainage network and tributaries of the main course.
The Pitillal River Basin: It has an approximate surface area of 420 km2 and its main river extends for a little more than 60 km, starting from a body of water located at 2,300 meters above sea level, it also has a considerable slope (3.12%) (see Figure 5) and the lower basin before reaching the sea crosses a greater number of colonies of Puerto Vallarta; and it extends along a larger coastal plain since it is farther away from the foothills, that is to say, from the foothills of the neighboring mountain range (see Figure 6).
The Ameca River Basin, a river with the same name that rises on the slopes of the La Primavera forest and the Tequila volcano in central Jalisco, Mexico, flows into Bahia de Banderas region, serves as a natural border for the states of Jalisco and Nayarit (see Figure 5). At 230 km long, it drains a watershed of 12,214 km² and has an average gradient of 0.73% (see Figure 6).
On the one hand, there is a geomorphological ramp, that is, a canyon or depression with a particular climate where the frequent flow of maritime-terrestrial breezes originates, inducing the condensation of the breeze itself, as well as descending movements of colder and denser air, which favors this zone register very frequently in one of the stations of the hydro-climatological network of the National Water Commission (CNA) the highest amounts in millimeters of the water column of the entire state of Jalisco.
Figure 6. Elevation profile of the main rivers in the Puerto Vallarta region
Figure 7. Cuale River delta formed by a hurricane in 1925
Figure 7 shows an island that formed in the previous delta of the Cuale River after the bay was hit by a hurricane in 1925, which caused torrential rains and flooding. Today the island is fully urbanized, and it is not illogical to think that, if a cyclone formed it, another phenomenon of this category could change its morphology again.
Historically, the course of the Pitillal River, which had several meanders before reaching the sea, was modified. These meanders reduced the speed of the flow and today, in the event of an extraordinary flood, this would not be the case. This river, which also flows almost all year round, has had periods of drought in recent years, a situation that did not occur, according to the comments of the older inhabitants living in this area. Within the urban area, the river crosses several bridges that, due to the dragging of sediments, frequently flood under this infrastructure, a situation that must be monitored and acted upon. Besides, the riverbed has many trees (Salix sp) with very tall stems that grow gradually, creating the risk that when dragged by a virtual flood, there can block the passage of water by causing a clogging under these bridges as sticks, a very risky situation because several nearby areas are lower than the containment of the riverbed that channels the river, that is, there is a risk of flooding near the Pitillal riverbed with an extraordinary flood.
In the Ameca River, a large part of the sub-basin is heavily modified mainly for agricultural, livestock, and urban use. Traditionally, both agriculture and local cattle ranching have depended mostly on the rainy season and have been established predominantly under the extensive mode characterized by the intensive clearing of valleys and plains; as a consequence, except for small patches or the edges of local roads, most of the arboreal vegetation has disappeared and therefore rain runoff finds favorable conditions for erosion and the consequent transport of sediments with their subsequent accumulation in the lower parts of the sub-basin. This continuous process has progressively "wash away" the areas of agricultural use and has caused the lower course of the Ameca River to silt up.
In Figure 8, using map algebra and vector superposition, the areas prone to flooding were found, and five classes were found from very low to very high vulnerability, where it is observed that the urban area surrounding Puerto Vallarta is in a highly vulnerable area. to floods. This is mainly due to the topographical configuration of the study area, since there are few flat areas on the banks of the rivers and natural barriers that prevent the growth of the flood zone. The hydraulic infrastructure of road returns is also a preponderant factor in the behavior of the runoff, since when its hydraulic capacity is exceeded, it acts as downstream flow controllers. Vegetation plays a very important role in terms of reducing areas vulnerable to flooding, but as a result of permits being granted for tourist and urban development, these are considered fragile ecosystems and vulnerable to events. The results obtained in the spatial analysis were classified on a qualitative scale consisting of five categories (very low, low, medium, high and very high) (Table 1) in this way it was obtained that Puerto Vallarta registers very high values of vulnerability to flooding in the urban and rural areas of the municipality, with a medium, low and very low vulnerability range, are found in the upper parts of the bay, which are related to the orography of the area. Pitillal, Centro and Aurora are the ones that present the greatest risk in the medium and short term, as they are located in areas with high and very high vulnerability.
Table 1. Flood hazard vulnerability criteria
|
Vulnerability Classification |
Height range x water velocity (m2/s) |
|
Very low Low Medium High Very high |
< 0.2 0.2 – 0.5 0.5 – 1.5 1.5 – 2.5 > 2.5 |
Figure 8. The vulnerability of flood zones in Puerto Vallarta, Bahia de Banderas region
The development process of the Jalisco coast is determined by the will of its population to overcome the conditions of wild nature, the lack of communication routes, and that, to carry out any productive activity, it would be necessary to start from the most basic to be able to generate productive actions.
The case of greatest transformation is that of Puerto Vallarta, which has become an icon of international tourism, with more than four million visitors a year and whose radius of action goes beyond its geographical limits, reaching the neighboring state of Nayarit in the north and being the support for the take-off on the rest of the coast towards the south of the state of Jalisco.
The increase in population, because of a large migration, and the inability of the most dynamic sector to absorb the excess of available labor, causes conditions of social backwardness for large segments of the population, although the indicators estimate that the degree of poverty in the municipality is very low, there is sufficient evidence to generate concern in a short period.
Based on the information and results obtained from the analysis of vulnerable zones in the region of Puerto Vallarta and its urban areas, it is possible to propose short, medium, and long-term programs for the prevention and mitigation of flood risks.
In the above-mentioned basins, preventive work linked to water control and restoration of the upper parts of the basins must be carried out, given the impossibility of foreseeing that the resident population may change location since these are cities with relatively consolidated colonies and neighborhoods.
The vulnerability and risk analyses and assessments presented should be used with caution, as they have limitations and restrictions due to the level of resolution of the information available and the uncertainties of the analysis, of which the end-user should be aware to make appropriate and consistent use of the results obtained, taking in to account the type of analysis performed, the type and quality of data used, the level of resolution and precision used, and the interpretation made.
The author thanked the National Council for Science and Technology (CONACYT, due to its Spanish acronym) and The Red de Desastres Asociados a Fenómenos Hidrometeorológicos y Climáticos (REDESClim), for the support to this research (grand number: 310625/PpF002- 8/XVII/2020).
[1] Gálvez, J.Y.A. (2016). Socioeconomic impact due to hydrometeorological phenomena in the State of Veracruz and its municipalities (1999-2015) (Master). Universidad Veracruzana, Master's Degree in Environmental and Ecological Economics. Mexico. https://www.uv.mx/meae/files/2020/08/J.-Yahir-A.-Galvez-tesis-final.pdf.
[2] Jiménez, F. (2003). Class notes for the natural disaster management course. Turrialba, CR. p. 282. https://dipecholac.net/docs/files/521-drm-lac-countryprograms.pdf.
[3] Arreguín-Cortés, F., Cervantes-Jaimes, C.E. (2017). Flood risk management in Mexico. Flood Risk Management. https://doi.org/10.5772/intechopen.69834
[4] Areu-Rangel, O.S., Cea, L., Bonasia, R., Espinosa-Echavarria, V.J. (2019). Impact of urban growth and changes in land use on river flood hazard in Villahermosa, Tabasco (Mexico). Water, 11(2): 304. https://doi.org/10.3390/w11020304
[5] Gersonius, B., Zevenbergen, C., van Herk, S. (2008). Managing flood risk in the urban environment: linking spatial planning, risk assessment, communication and policy. In: Pahl-Wostl C., Kabat P., Möltgen J. (eds) Adaptive and Integrated Water Management. Springer, Berlin, Heidelberg. https://link.springer.com/chapter/10.1007/978-3-540-75941-6_14.
[6] Barasa, B.N., Pradeep, E. (2018). Analysis of land use change impacts on flash flood occurrences in the Sosiani River basin Kenya. International Journal of River Basin Management, 16(2): 179-188. https://doi.org/10.1080/15715124.2017.1411922
[7] Kumar, M., Sharif, M., Ahmed, S. (2020). Impact of urbanization on the river Yamuna basin. International Journal of River Basin Management, 18(4): 461-475. https://doi.org/10.1080/15715124.2019.1613412
[8] Liu, Z.Y. (2012). Recent progress in urban flood risk management in the typhoon committee area. Tropical Cyclone Research and Review, 1(1): 60-66. https://doi.org/10.6057/2012TCRR01.07
[9] WMO. (2008). Urban Flood Risk Management - A Tool for Integrated Flood Management. WMO, APFM Technical Document No. 11, Flood Management Tools Series. https://library.wmo.int/doc_num.php?explnum_id=7342.
[10] Frausto-Martínez, O., Colin-Olivares, O. (2019). Indicators of sustainability of the policy of seas and coasts -Mexico. Costas Magazine, 1(2): 41-58. https://doi.org/10.26359/costas.0203
[11] Aguilar‐Barajas, I., Sisto, N.P., Ramirez, A.I., Magaña‐Rueda, V. (2019). Building urban resilience and knowledge co‐production in the face of weather hazards: Flash floods in the Monterrey Metropolitan Area (Mexico). Environmental Science & Policy, 99: 37-47. https://doi.org/10.1016/J.ENVSCI.2019.05.021
[12] Enseñat Soberanis, F. (2020). Classification of archaeological zones according to their level of attraction. Geographical Research, 102: e60146. https://doi.org/10.14350/rig.60146
[13] Vázquez Sosa, A., Frausto Martínez, O., Alfredo Cabrera Hernández, J. (2020). Models of integrated coastal zone management: Comparative analysis and adoption proposal in the case of Akumal (Mexico). Costas Magazine, 2(1): 25-50. https://doi.org/10.26359/costas.0202
[14] Jha, A., Lamond, J., Bloch, R. (2012). Cities and flooding: A guide to integrated urban flood risk management for the 21st Century. GFDRR/World Bank, Washington. http://hdl.handle.net/10986/2241.
[15] Glas, H., De Maeyer, P., Merisier, S., Deruyter, G. (2020). Development of a low‐cost methodology for data acquisition and flood risk assessment in the floodplain of the river Moustiques in Haiti. J Flood Risk Management, 13(2). https://doi.org/10.1111/jfr3.12608
[16] Morales Hernández, J., Farfán Molina, L., Maciel-Carrillo González, F., Cornejo López, V., Téllez López, J. (2013). Influence of tropical cyclones from 1970 to 2010 in the region of Bahía de Banderas, Nayarit-Jalisco, Mexico. Research and Science, 21(59): 13-24.
[17] Pineda-Martínez, L., Dzul García, O., Hotchkiss, R.H. (2014). Implications of maximum daily precipitation on streamflow of a watershed: a case study in Zacatecas, Mexico. International Journal of River Basin Management, 12(4): 411-418. https://doi.org/10.1080/15715124.2014.945459
[18] Sanders, B.F., Schubert, J.E., Goodrich, K.A., et al. (2020). Collaborative modeling with fine‐resolution data enhances flood awareness, minimizes differences in flood perception, and produces actionable flood maps. Earth's Future, 7(1). https://doi.org/10.1029/2019EF001391
[19] Diario Oficial de la Federación. (2018). Politica Nacional de Mares y Costas. http://dof.gob.mx/nota_detalle.php?codigo=5545511&fecha=30/11/2018.
[20] Cardenas, E. (2016). Growth and urban planning in Acapulco, Cancun and Puerto Vallarta (Mexico). Investigaciones Turísticas Magazine, 12: 99-120. http://rua.ua.es/dspace/handle/10045/61311.
[21] Viera, D., Michel, C. (2020). Geographical description of the Jalisco coast. In: Morales, J. & Cruz, B. (Coords) (2020). Characterisation of the coast of Jalisco. EDAE Editorial - University of Guadalajara. https://editorial.udg.mx/gpd-caracterizacion-de-la-costa-de-jalisco-9786079868956.html.
[22] CENAPRED. (2020). Consultation system for declarations 2000 - 2020. Mexico. http://www.atlasnacionalderiesgos.gob.mx/apps/Declaratorias/#.
[23] UN-Habitat. (2017). New Urban Agenda. United Nations Conference on Housing and Sustainable Urban Development (Habitat III). ISBN: 978-92-1-132736-6. https://www.habitat3.org/.
[24] Martínez Méndez, A., Frausto Martínez, O., Castillo Villanueva, L., Camacho Sanabria, J. (2018). Resilience index of drinking water infrastructure against hurricanes in coastal cities. Geographic Magazine of Central America, 3(61E): 339-365. https://doi.org/10.15359/rgac.61-3.17
[25] OECD. (2015). OECD Outlook on the Digital Economy 2015. ISBN 978-92-64-232440. Https://Www.Oecd.Org/Digital/Perspectivas-De-La-Ocde-Sobre-La-Economia-Digital-2015-9789264259256-Es.Htm.
[26] National Population Council (CONAPO). (2012). Population projections by municipalities and localities. http://www.conapo.gob.mx/es/CONAPO/Proyecciones_Datos, accessed on August 21, 2020.
[27] National Institute for Federalism and Municipal Development, INAFED (2016). Municipal Development Agenda. ISBN: 978-607-96363-1-9. www.inafed.gob.mx.
[28] National Institute of Statistics and Geography INEGI. (2021). Main results of the 2020 General Population and Housing Census. Available at: www.inegi.gob.mx.
[29] Hernández, M., Frausto, O., Chavoya, J.I., Rendon, H.J., Camba, I.L. (2019). Hot spots and their relationship with forest fires on vegetation associated with atmospheric systems in the period 2010-2018; Bahía de Banderas, México. DIGITAL CIENCIA@UAQRO, pp. 33-42. https://revistas.uaq.mx/index.php/ciencia/article/view/12/17.
[30] Morales Hernández, J., Chavoya Gama J., Camba Pérez, G. (2013). Hydrometeorological risks in the face of urban growth in Puerto Vallarta. Chavoya (Ed.) Puerto Vallarta before the xxi century. City, society and climate change (pp.83-100). Puerto Vallarta, Mexico. University of Guadalajara. https://editorial.udg.mx/gpd-puerto-vallarta-ante-el-siglo-xxi-ciudad-sociedad-y-cambio-climatico.html.
[31] Gauna, C., Vargas, R., Virgen, C. (2020). The coast of Jalisco: Sociodemographic, economic and tourist analysis. In: Morales, J. and Cruz, B. (Coords) (2020). Characterisation of the coast of Jalisco. EDAE Editorial - University of Guadalajara. pp. 29-44. https://editorial.udg.mx/gpd-caracterizacion-de-la-costa-de-jalisco-9786079868956.html.
[32] Instituto Nacional de Estadistica y Geografia INEGI. (2019). Economic censuses 2019. https://www.inegi.org.mx/inegi/enlaces.html.
[33] Enrique, P.C. (2010). Socio-spatial segregation in tourist cities, the case of Puerto Vallarta, Mexico. Region and Society, 22(49): 143-176.
[34] Morales, H.J., Cornejo, V.M., Chavoya, G.J.I., López, R.J.L., Rendon, C.H.J. (2018). Forest fires and their relationship with the vegetation on the north coast of Jalisco, in 2017. Latin American Magazine on Environment and Sciences, 9(21): 88-102. https://rlac.buap.mx/sites/default/files/9%2821%29-8.pdf.
[35] Mendez, M., Jiménez, D. (2013). Generation of Digital Elevation Models (DEM) from photogrammetric analysis using CARTA-2005 images. Technology on the Move, 26(4): 26-35. https://repositoriotec.tec.ac.cr/handle/2238/4537?locale-attribute=en.
[36] Iwahashi, J., Pike, R.J. (2007). Automated classifications of topography from DEMs by an unsupervised nested- means algorithm and a three-part geometric signature. Geomorphology, 86: 409-440. http://dx.doi.org/10.1016/j.geomorph.2006.09.012
[37] Sánchez-Rivera, G., Frausto-Martínez, O., Gómez-Mendoza, L., Terán-Cuevas, Á.R., Hernández, J.C.M. (2021). Tropical cyclones in the north Atlantic basin and Yucatan Peninsula, Mexico: Identification of extreme events. International Journal of Design & Nature and Ecodynamics, 16(2): 145-160. https://doi.org/10.18280/ijdne.160204