Raquim Nihad Zehawi* | Ali Hussein Hameed
© 2022 IIETA. This article is published by IIETA and is licensed under the CC BY 4.0 license (http://creativecommons.org/licenses/by/4.0/).
OPEN ACCESS
The complex nature of urban growth in cities whose population is exponentially increasing requires a comprehensive understanding to create a precise and descriptive modelling. In order to identify the main factors that influence the behavior of such complex growth and consequently recognize the most applicable future projection to the growth in each urban category, a system dynamics model was developed in which all pertinent variables are incorporated. This model was proven to be capable of simulating the urban growth in Baquba city for some six decades from 1957 to 2017. The simulation results showed very high goodness of fit with the historical records with an R2 ranging between 0.987 and 0.997 proving the validity and applicability of the model. The interaction between various urban categories showed that the road network area was negatively influenced mainly by the rapid growth of residential and public areas. The future projections of this model to the target year of 2035 showed that the residential, public, commercial and industrial categories are increasing by; 55%, 84%, 40%, and 19% respectively. The road area has also increased by 19% in the same projection gaining more expansion than what it got in the last three decades prior to 2017.
BAQUBA city, causal loop diagram, road network, system dynamics, pattern, urban growth
Most of the Iraqi cities, especially in the middle district which surrounds the capitol Baghdad, witnessed a special urban growth pattern in the last half a century due to the fluctuating situation of the country if not the whole region. Several distinctive patterns could be distinguished since late fifties in the last century until now [1, 2]. Baquba City, like many cities in the middle district has endured many changes in growth pattern of various sectors. It witnessed a very fast urban expansion propelled by the economic growth, this expansion produced a profound negative effect on the environment of the city due to the sprawl of buildings over the adjacent orchards and agricultural areas [3, 4].
A good understanding of urban growth patterns requires holistic perspective in order to measure the morphological changes through different phases in a long period [5]. One of the most comprehensive techniques in this field is the System Dynamics in which the model can be very useful in simulating the inter-relation among the various urban development dimensions [6]. and capturing the causal relations and feedback as well as performing quantitative analysis of urban development policies [7, 8].
In this article, a system dynamics model was developed to simulate the growth patterns of residential, commercial, industrial and public sectors in the city of Baquba in the past five decades in order to comprehend the pros and cons of the patterns of growth in each sector and finally assessing the overall growth impact on the road network.
2.1 Urban growth and system dynamics
The urban growth and land use change takes multiple patterns affected by many endogenous and exogenous factors. A vast number of studies were conducted in this regard all over the world. The dynamics of urban growth are conventionally captured by the integration of information extracted from multi-temporal maps, with the help of the wide variety of landscape metrics made through the use of Geographic Information System (GIS) and the remote sensing or other similar techniques [9-11].
In many cases, the rapid urban expansion brought about a lot of land use changes and consequently, give rise to enormous impacts on landscape patterns, in most cases the adjacent arable, agricultural, pasture lands are the most land use types that developed for urban growth [9, 12-15].
Considerable effort was paid in coupling system dynamics with other modeling techniques to produce more descriptive and precise simulation and results. The integration between system dynamics with agent-based modeling has been widely used. The two approaches are suitable for simulating social and economic systems which are characterized by delay, non-linearity and feedback processes [16, 17]). For modeling the intercity transportation [18] adopted a hybrid approach by developing A system dynamics model for multimodal intercity transportation which is calibrated against a set of data points from the previously developed agent based model. The hybrid model demonstrated an inheritance of the proven predictive power of agent-based model with enhanced capabilities that could not be achieved by a single technique.
An integration between system dynamics with cellular automata techniques was also presented for it has its own advantages. Since the cellular automata, the bottom – up model, which consists of a lattice of discrete cells with values changing on regular time steps, are capable of representing spatial, stochastic, and nonlinear procedures. Yet they are not suitable for representing macro scale variables [19]. While on the other hand, the top – down, system dynamics model which is favorable for investigating all socioeconomic variables and all land change driving forces and simulating complex systems as well as predicting system changes under different scenarios [20-22].
2.2 Urban growth and land use dynamics
The urban growth and land use change takes multiple patterns affected by many endogenous and exogenous factors. A vast number of studies were conducted in this regard all over the world. The dynamics of urban growth are conventionally captured by the integration of information extracted from multi-temporal maps, with the help of the wide variety of landscape metrics made through the use of Geographic Information System (GIS) and the remote sensing or other similar techniques [9-11].
In many cases, the rapid urban expansion brought about a lot of land use changes and consequently, give rise to enormous impacts on landscape patterns [23-26], in most cases the adjacent arable, agricultural, pasture lands are the most land use types that developed for urban growth [9, 12-15].
Considerable effort was paid in coupling system dynamics with other modeling techniques to produce more descriptive and precise simulation and results. The integration between system dynamics with agent-based modeling has been widely used. The two approaches are suitable for simulating social and economic systems which are characterized by delay, non-linearity and feedback processes [16, 17]. For modeling the intercity transportation [18] adopted a hybrid approach by developing A system dynamics model for multimodal intercity transportation which is calibrated against a set of data points from the previously developed agent based model. The hybrid model demonstrated an inheritance of the proven predictive power of agent-based model with enhanced capabilities that could not be achieved by a single technique.
An integration between system dynamics with cellular automata techniques was also presented for it has its own advantages. Since the cellular automata, the bottom – up model, which consists of a lattice of discrete cells with values changing on regular time steps, are capable of representing spatial, stochastic, and nonlinear procedures. Yet they are not suitable for representing macro scale variables [19]. While on the other hand, the top – down, system dynamics model which is favorable for investigating all socioeconomic variables and all land change driving forces and simulating complex systems as well as predicting system changes under different scenarios [20-22, 27].
2.3 Urban growth and land use dynamics
Road networks and transportations as related to urban growth has been an important study topic for a long time now. The transportation system and land use are considered as the most influencing factors in determining the urban form and structure, and they mutually influence each other overtime [28]. Urban expansion is spatially determined by the road network which has a great significant influence on human activities, socioeconomic development, and the environment. The understanding of road network expansion pattern is crucial to optimize the comprehensive urban planning [29]. [30] developed a new modeling approach for capturing a region's urban agglomeration pattern. The centrality of the road network is used as the major indicator in the proposed model to capture the urban agglomeration pattern [31] investigated the sustainable implications of transportation and land use relationship with some concentration on the investments in transportation infrastructures and their impact on land development patterns. It was concluded that the benefits of transportation in the compact urban development could be achieved by adopting plans and policies that support sustainable transportation and land use relationships in the compact urban form. In some cases, where the urban development is polycentric around rural villages and activity hubs, a linear development is expected to take place along the main transportation arterials. The population growth is mainly concentrated in urban areas whereas the construction boom followed the low-priced lands in suburbia and urban extremities [32].
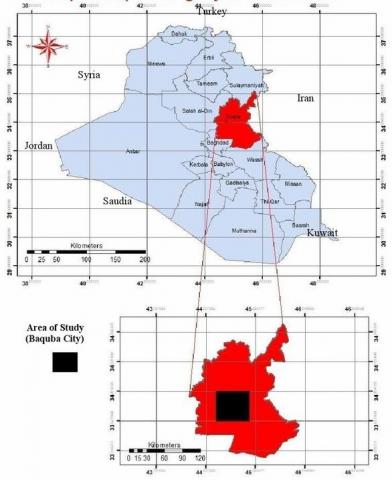
Baquba city is the capitol of Diyala governorate, located to the north east of Baghdad the capitol of Iraq. Historically, the city of Baquba represented a station on the Silk Road in medieval ages between Khorasan and Baghdad [4]. The city as a whole is bounded by the GPS coordinates (33°47́ 4’’ - 33°40’ 33’’ N) and (44°38’ 15’’ - 44°35’ 44’’ E) as shown in Figure 1 [33]. Diyala River separates the city into eastern and western parts which have changed the importance in terms of the concentration of commercial entities, public services and governmental authority centers along the past five decades.
Figure 1. Location of study area
Figure 2. Population of Baquba city
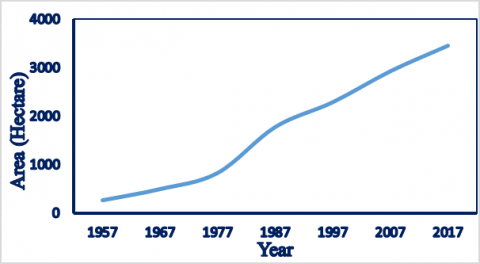
Figure 3. Total urban growth in Baquba city
The population of Baquba city witnessed an exponential growth in the last six decades. In 1957 the city population was around 21,000 which has multiplied some 20 times to approach 410,000 in 2017. This growth was not uniform all over this period, as could be seen in Figure 2, the rate of growth showed a certain increment in the period from 1977 to 1997, while a further increment was seen in the period from 1997 to 2017. This gradual change in growth rate was mainly due to in migration propelled by urban growth and the demand for employment in the city rather than the increase in birth rates [34].
The economic performance of the city could be reflected by the GDP of the city as a central part of the Diyala governorate which represent a central part of the Iraqi economy. As the Iraqi GDP fluctuated a great deal along the study period due to the unstable political, military and even social situations, the GDP of Diyala province remained close to an average of 80% of the national Iraqi GDP. The local labor force in the study area has an average of 25% of the total population, which is very much compatible with the neighboring cities. About 51% of them are concentrated in the urban areas. Although, the nonagricultural labor force represents 51.4% of the total labor force, the non-agricultural output of the city is about six times the agricultural output what may reflect the effective industrial and commercial activities in the city [35].
The expansion of urban area in Baquba city took different patterns in the last six decades or so. The overall urban growth witnessed a steady rhythm in the first two decades between mid-fifties and mid-seventies. Then a fast growth occurred in the following ten years up to the mid-eighties. Later, a slower pace of urban growth is noticed since the mid-eighties until now as shown in Figure 3.
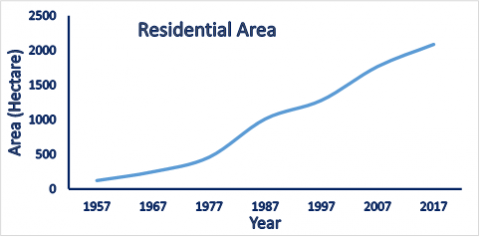
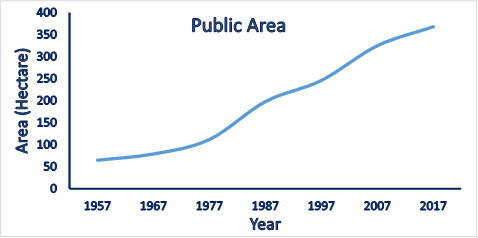
The total urban areas are categorized according to the classification adopted by the local administration and planning authorities into five categories; First; the residential area, in which the buildings are intended or used primarily for housing, and usually divided into areas of low-rise houses or vertical housing units. Second; the commercial area where the buildings are dedicated to shops, offices and commercial companies. The commercial areas are usually attached to the residential areas. Third; industrial areas which are Intended for industrial facilities including heavy manufacturing industries, medium collective industries and light industrial facilities in addition to the maintenance facilities. Fourth; public area whose buildings are dedicated to institutional establishments which are solely owned by the governmental agencies and meant for the public services. The fifth category is the road network areas which includes all the areas that occupied by all types of roads [36-38].
a
b
c
d
e
Figure 4. Growth patterns for each urban category
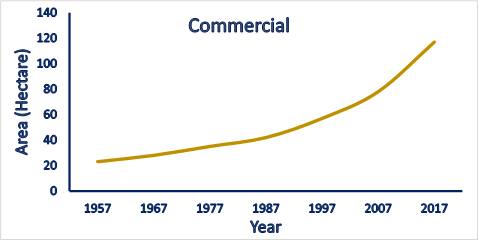
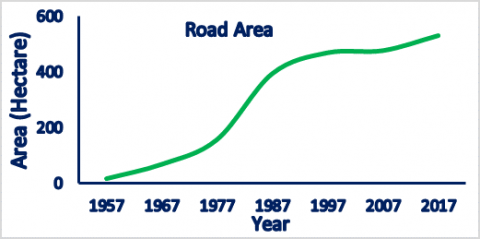
The growth of these categories shows different patterns. Although; the residential and public areas showed the same previously mentioned pattern, the growth of the commercial and industrial areas showed a continuous increase in the value of the annual rate of growth throughout the last six decades, while the growth in the road area formed an S shape along the same period starting with exponential increase in the first three decades where the rate of annual growth is in steady increase followed by a period of two decades in which the annual rate of growth decreases gradually approaching zero, and finally, a slight increase has occurred in the last ten years or so. These growth patterns are shown in Figure 4.
The aforementioned growth patterns show a certain incompatibility for some categories expand on the expense of the others what may affect the overall balance between urban categories resulting some serious service shortages and other problems.
In this study, an effort was paid to analyze the patterns of urban growth in Baquba city in order to develop a system dynamics model by which the urban growth process is simulated for all urban categories in order to reveal their impact on the road network area that seems to be negatively affected by the unplanned urban expansion. In this model, all the endogenous and exogenous factors that affect and govern the growth process in each category are presented in a way that provides the capability to assess the influence of each one of them as well as their sensitivities what may grant the competence to control the influential factors to ensure a compatible urban growth in the future.
As stated earlier, the system dynamics model was developed to analyze the urban growth pattern dynamics. It is very important to understand the causality in this model that reveals the feedback influences in which an event will change the state of the system in a way that eventually affect itself after a certain amount of time delay. These feedback loops interact among each other generating the dynamic behavior of the system. In the following, a briefing to the main causal loops of the urban growth model for Baquba city.
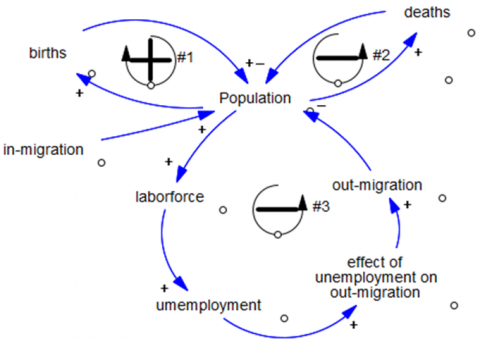
5.1 Population causal loop
The population is highly affected by the rates of births and deaths, but it is also affected by the rate of people migration from outside in or from inside out, mostly following the employment opportunities or availability of services and sometimes to run away from unpleasant community environment due to acts of war or insurgency. Figure 5 shows the population causal loop without the extensions of the in-migration, which highly affected by the residential feedback loop that is going to be discussed next.
It is worthwhile to state that population is involved in each and every causal loop in this model due to the fact that all urban constructions and facilities are provided essentially to the people inhabitant in this city.
The population causal loops include the positive (reinforcing) loop of the births represented by the loop #1 in Figure 5 which is mainly countered by the negative (balancing) loop of deaths represented by the loop # 2. Another negative loop affects the population of Baquba city which takes into account the unemployment percentage and the amount of influence it imposes on the rate of people migration out of the city. This loop is symbolized by loop #3 in which the “population” has a positive relation with the “labor force”, for when it increases, the “labor force” increases as well and conversely, when it decreases the “labor force” will decrease too. The “labor force” in turn has the same relation with the “unemployment” which is equal to the labor force minus the available jobs and when the labor force increases, with a fixed number of jobs, the unemployment will clearly increase. The same positive relation is demonstrated between the “unemployment” and the “effect of unemployment on out-migration”. This effect has a positive influence on the “out-migration”. Eventually; the “out-migration” has a negative relation with the “population” for when the “out-migration” increases, the “population” decreases. Accordingly; the initial increment in the “population” leads to its final decline in the end.
Figure 5. Population causal loop
There is another negative loop affecting the “population” related to the residential areas in Baquba city. This loop will be discussed with the loops controlling the residential area in the next paragraph.
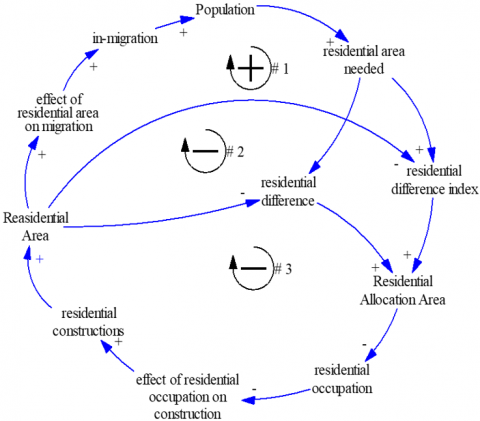
5.2 Residential causal loop
The residential causal loop could be regarded as the most important one of all other loops due to the influence it imposes on the whole urban growth process. It is considered as the main motivation for the areal expansion, and the abundant residential units available may encourage the in-migration a great deal.
As population increases, the “residential area needed” increases as well. This variable represents the total area of the residential unit’s construction needed by the total population on the bases of the unit residential area per capita.
The “residential area needed” has a negative relation with the “residential difference index”. This index expresses the relation between the residential area and the needed residential area and it was designed to be equal to zero when these two variables are equated. This situation is farfetched due to the fact that the population growth rate derives an increase in the needed area for residential units always higher than the areas allocated by the local authorities for residential use all over the last six decades.
According to the Iraqi manciple legislations, any urban expansion related to residential housing construction must be preceded by a preliminary step by which the intended area is to be allocated to this purpose first, then the gradual residential constructions may be initiated. Based on the historical measures in Baquba, and many other similar cities in the middle sector in Iraq, residential areas allocations usually take place when the needed area for this purpose reaches one and a half the actual residential area, but the additional area for allocation mostly ranges about half the difference between the total needed area and the actual residential area. Thus, after each allocation process, an extra available area for residential constructions is presented and the residential occupation ratio is decreased. The “residential occupation” represents the percentage of total allocated area that has been occupied by residential constructions. When this percentage is low, there is a plenty of vacant area with acceptable prices. This may very well encourage the residential constructions and lead to increase the occupied area and consequently increase the “residential occupation” which in turn reduces the available lands and rise the land prices what may discourage new constructions and slow the residential growth rate. This represents atypical negative (balancing) feedback loop which is marked as loop #3 in Figure 6.
An embedded negative loop could also be observed in Figure 6 referred to as loop # 2 which partially controls the “Residential Area”. In this loop, the negative influence of “Residential Area” on the “residential difference index” is taken into account, while other consecutive influences between the “Residential Allocation Area”, “residential occupation”, “effect of residential occupation on construction”, and “Residential Area”, are similar to those in loop # 3.
The expanded residential areas and the high number of available housing units may represent a great encouragement for people to move into the city and increasing its population. Accordingly; the initial increment of the “population” triggered the feedback loop containing, in sequence, the “residential area needed”, “residential difference index”, “Residential Allocation Area”, “residential occupation”, “effect of residential occupation on construction”, “Residential Area”, “effect of residential area on migration”, “in-migration”, and finally cause a further increase in the “population”. This makes it a positive (reinforcing) feedback loop as shown in Figure 6, loop # 1.
Figure 6. Residential area causal loop
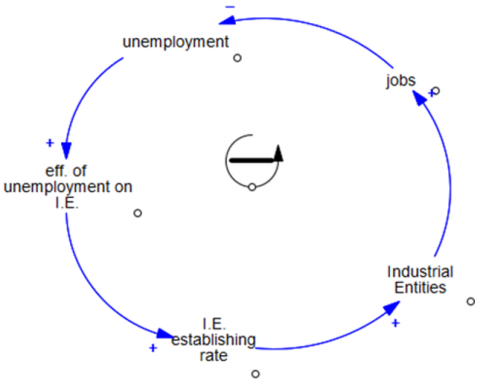
5.3 Industrial causal loop
The industrial causal loop describes the growth behavior of industrial entities in terms of number, area, and employment. As the unemployment is increased in the city and the number of workers exceeds the available jobs, the wages usually go down. The availability of affordable workforce may very well encourage the industrial entities to expand or the establishment of new industrial entities. The expansion in size and number of industrial entities requires additional areas and additional jobs which in turn affects the unemployment. Accordingly; the main causality in this loop could be summarized in the following sequence. When the “unemployment” increases, its effect on industrial entities, denominated as “eff. Of unemployment on I.E.,” will increase too causing an increment in the “I.E. establishing rate” which will cause the increasing of “Industrial Entities”. The additional industrial entities will require an increment in “jobs” which will cause a noticeable decreasing in the “unemployment” forming a negative feedback loop that govern the balance in the labor market within the city of Baquba. The industrial causal loop is illustrated in Figure 7.
Figure 7. Industrial causal loop
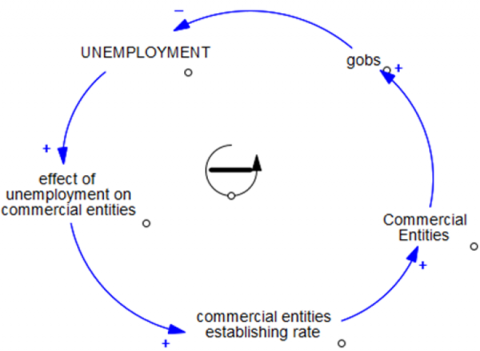
5.4 Commercial causal loop
The commercial causal loop designates the balance between the unemployment and the availability of affordable labor force it may provide and the establishment of commercial entities which requires more jobs that causes the diminution in unemployment. This negative feedback loop is almost identical to the Industrial causal loop as shown in Figure 8. The main difference between them lies mainly in the number of jobs and acreage required per the entity of each type, for the unit area required by the industrial entity is about five times that required by the commercial one, and the jobs it requires is about twice that of the commercial entity. This is mainly due to the nature of commercial and industrial activities in Baquba city.
Figure 8. Commercial causal loop
5.5 Public causal loop
The public area has a unique nature for the constructions of this category are solely performed by the governmental agencies without much contribution from the individuals or private entities. Two negative causal loops are governing the public area growth, as shown in Figure 9, in the first the “Public Area” has a negative relation with the “public area index” which is designed to be equal to zero when the actual public area and the needed public area are equal and in contrast it increases to approach unity when the actual public area is very small compared to the needed public area. The “public area index” is positively related with its own effect on public constructions “effect of P.A.I.” which also has positive effect on the flow of “public constructions” that produces the expand in the “Public Area” when increased. The second loop describes the growth of “Public Area” in order to reach the target represented by the “public area needed” which is equal to the population times the unit area per capita needed for public constructions. The difference between the needed and the actual public area is the “gap” that need to be eliminated by the public constructions flow. As population grow in number the “public area needed” grows as well along with the gap what may trigger an increasing in “public constructions” to make an expansion in the “Public Area” to approach the “public area needed” and close the gap.
Figure 9. Public causal loop
5.6 Comprehensive model causality
The aggregate causal loop diagram as shown in Figure 10 reveals that all feedback loops are centered around the population of the city. This is mainly due to the fact that all types of urban growth are motivated by the population needs in its essence. Yet, there are many factors that affect and regulate the patterns of growth of the various urban categories. Such factors like the local legislations and administrative acts that govern the urban planning, the political authorities, the economic prosperity, governmental central fund allocation, governorate economic and financial policies, and many other factors. These factors are not presented in details in the qualitative modeling of the dynamic relations that concentrate on the conceptual framework of the model.
5.7 Comprehensive model stock and flow diagram
The system dynamics model that simulates the aforementioned relations was designed to encompass seven stocks (levels) that give the accumulated values to the most influential factors affecting the growth patterns. This model contains five sub models dealing with the growth in residential, public, commercial, industrial, and road areas as shown in Figure 11.
As stated earlier, the “Population” stock plays a central role in this model for it is influenced in the first place by the natural births and deaths which are represented by an inflow and outflow respectively, in addition to the increment incurred by the in-migration and the decreasing taking place due to the out-migration. Since the birth fraction and the average lifetime were considered constants, the change in the rate of population growth is mostly driven by the in and out migrations.
The in-migration is influenced by many factors, the most important of which is the availability of affordable housing units. This is because of the common society ethics and believing’s. in this regard, as stated earlier, the reinforcing loop by which the increment in population triggers the need for more residential units which in turn stimulate more and more people to move in the city producing more increasing in the population. This loop is hindered, balanced, by the procedures adopted by the city administration, according to the local legislations, in allocating the additional lands for the residential purposes. The negative influence is imposed on the inflow “residential allocation rate” feeding the stock “Residential Allocated Area” which in turn controls the areas of available lands for residential construction and consequently the residential area.
The out-migration, on the other hand, is mostly driven by the need for the job. The proximity to the capitol city of Baghdad and the nature of the industrial and commercial basic structures and the employment opportunities they provide as compared to the local labor force necessitated this type of relation between the population and the unemployment in the form of out-migration rather than the in-migration. In fact, it is quite uncommon to find local jobs occupied by employees who live outside the city, while it is very usual for the residents to work in neighboring cities especially the capitol Baghdad.
The unemployment reflects the interaction between the growth in the commercial and industrial entities and the population of the city through the out-migration flow that affects the population.
The continuous growth in the residential, public, commercial and industrial areas leads the total urban area of the city to approach the ultimate boundaries of the city of Baquba beyond which the local authorities have no jurisdiction and no further expansion is permitted. This approaching has its own impact on the urban growth especially the residential category in terms of the total acreage and the unit area of the housing units. This impact is materialized due to the change in land prices as the vacant land is demolishing and the capability of expansion is becoming more and more difficult. It also has a critical impact on the roads area due to the same reason. This impact is scaled depending on the ratio of the available land for expansion to the total area of the city jurisdiction as well as the ratios of each urban category as compared to the area of the available land. It was found that the most influential factors among these ratios are those of the available area, residential area and the public area while the commercial and industrial areas have minimal or negligible influence probably because of their distribution and the overall configuration of the city. The road area was negatively affected by the rapid growth of residential and public areas as well as the obvious shrinkage of the available land area. This effect could be seen in the historical data plot, see Figure 4. e, where it showed a huge decline in the late eighties of the past century up to the midfirst decade of the new millenia after which some enhancement could be seen in the growth rate of road areas mainly because of the new administrative acts and legislations enacted by the new authorities took charge in the wake of the 2003 crises. These legislations raised the minimum limit of road area in any newly allocated land for urban extension in order to hamper the economic effect which tends to decrease the lands allocated for road network whenever the land prices are elevated.
The in-migration is influenced by many factors, the most important of which is the availability of affordable housing units. This is because of the common society ethics and believing’s. in this regard, as stated earlier, the reinforcing loop by which the increment in population triggers the need for more residential units which in turn stimulate more and more people to move in the city producing more increasing in the population. This loop is hindered or balanced by the procedures adopted by the city administration, according to the local legislations, in allocating the additional lands for the residential purposes. The negative influence is imposed on the inflow “residential allocation rate” feeding the stock “Residential Allocated Area” which in turn controls the areas of available lands for residential construction and consequently the residential area.
The out-migration, on the other hand, is mostly driven by the need for the job. The proximity to the capitol city of Baghdad and the nature of the industrial and commercial basic structures and the employment opportunities they provide as compared to the local labor force necessitated this type of relation between the population and the unemployment in the form of out-migration rather than the in-migration. In fact, it is quite uncommon to find local jobs occupied by employees who live outside the city, while it is very usual for the residents to work in neighboring cities especially the capitol Baghdad.
The unemployment reflects the interaction between the growth in the commercial and industrial entities and the population of the city through the out-migration flow that affects the population.
The continuous growth in the residential, public, commercial and industrial areas leads the total urban area of the city to approach the ultimate boundaries of the city of Baquba beyond which the local authorities have no jurisdiction and no further expansion is permitted. This approaching has its own impact on the urban growth especially the residential category in terms of the total acreage and the unit area of the housing units [3]. This impact is materialized due to the change in land prices as the vacant land is demolishing and the capability of expansion is becoming more and more difficult. It also has a critical impact on the roads area due to the same reason. This impact is scaled depending on the ratio of the available land for expansion to the total area of the city jurisdiction as well as the ratios of each urban category as compared to the area of the available land. It was found that the most influential factors among these ratios are those of the available area, residential area and the public area while the commercial and industrial areas have minimal or negligible influence probably because of their distribution and the overall configuration of the city. The road area was negatively affected by the rapid growth of residential and public areas as well as the obvious shrinkage of the available land area. This effect could be seen in the historical data plot, see Figure 4. e, where it showed a huge decline in the late eighties of the past century up to the midfirst decade of the new millenia after which some enhancement could be seen in the growth rate of road areas mainly because of the new administrative acts and legislations enacted by the new authorities took charge in the wake of the 2003 crises [39]. These legislations raised the minimum limit of road area in any newly allocated land for urban extension in order to hamper the economic effect which tends to decrease the lands allocated for road network whenever the land prices are elevated.
5.8 Simulation analysis
The simulation of the system dynamics model was performed for the period of 60 years starting from 1957 until 2017 by using the values of the base year as initial values in the main stocks of “Population”, “Residential Area”, “Public Area”, “Commercial Entities”, “Industrial Entities” and “Road Area”. The constants in this model were developed depending on many correlation analyses between different variables throughout the 60 years period. The same procedure was conducted in determining the shapes of the relations imbedded into the look up tables in this model. The overall behavior of the system was also consulted to calibrate many parameters in the model. For the verification of the model, the simulation results of the main variables were plotted along with the actual values as shown in Figure 12. (a) through (e). the proximity of the values as well as the identical behavior over time showed a very high degree of fitting to the actual values. At the same time a statistical test was made to the predicted values as compared to the actual ones for all urban categories and also showed the goodness of fit as listed in Table 1 what may reveal the accuracy of the system dynamics model and its eligibility for simulating the urban growth process.
Table 1. Statistics of model prediction
|
Urban category |
Adj. R2 |
|
Residential area |
0.990 |
|
Public area |
0.987 |
|
Commercial area |
0.989 |
|
Industrial area |
0.992 |
|
Road area |
0.997 |
5.9 Future projections
Depending on the system dynamics model which has been validated for the urban growth in Baquba city, a future prediction for this growth was made up to the year 2035. The urban growth was estimated by the urban categories as they interact dynamically up to the target year of which estimated areas are listed in Table 2.
a
b
c
d
e
Figure 12. Simulated and actual urban category values
Table 2. future projections of urban category areas
|
Category |
Area in 2017 |
Area in 2035 |
Net area change |
Change percentage |
|
Residential |
2080 |
2850 |
770 |
37% |
|
Public |
370 |
680 |
310 |
84% |
|
Commercial |
115 |
165 |
50 |
43% |
|
industrial |
350 |
415 |
65 |
19% |
|
Roads |
530 |
630 |
100 |
19% |
|
Available lands |
1755 |
460 |
-1255 |
-72% |
Due to the previously mentioned urban expansion in different categories while the total areal land jurisdiction of the city of Baquba is fixed around 5200 hectares and it is very difficult to extend beyond, the available lands are becoming more and more scarce and the land prices is logically becoming higher what may very well cause many impacts on the urban growth process as explained earlier. The available area for expansion is anticipated to shrink from 1750 hectares in 2017 to 460 hectares in 2035 i.e., losing about 75% of its original area as illustrated in Figure 13.
a
b
Figure 13. Projected growth for urban categories
In order to realize the dynamics driving the urban growth patterns in Baquba city, a system dynamics model has been developed in which the patterns of growth throughout the six decades period from 1957 to 2017 were simulated. The main conclusions drawn from the findings of this model could be summarized in the following:
The model also revealed that the road network area is expected to expand in an acceptable pattern in the following years, what may suggest the adequacy of the legislations and administrative acts that controls the relation between road area and newly allocated area for urban expansion.
This research was conducted as a part of a thorough study on the Diyala governorate and Baquba city in particular on the request of the governor bureau. The authors would like to extend the appreciation to Mr. Muhammed Qutaiba from the governor technical assistant and the planning personnel; Ali Al-Kurwi, Bashar Askar, and Husain Al-Tamimi for cooperation and providing crucial information.
[1] Hameed, A.H. (2015). Urban growth and transportation indicators for sub-urban area. Journal of Engineering and Sustainable Development (JEASD), 19(5): 1999-8716.
[2] El-Naggar, M.S. (1990). Investment Policies in the Arab Countries: Papers Presented at a Seminar Held in Kuwait, December 11-13, 1989. International Monetary Fund.
[3] Muhammed, F.A. (2004). Contemporary urban growth in Iraq. Journal Geogr. Res., 3(5): 143-163.
[4] Hameed, A.H. (2016). Cellular automata-dynamic model for urban growth Baqubah City. Diyala Journal of Engineering Sciences, 9(3): 12-23. https://doi.org/10.24237/djes.2016.09302
[5] Wu, Q., Cheng, J. (2019). A temporally cyclic growth model of urban spatial morphology in China: Evidence from Kunming Metropolis. Urban Studies, 56(8): 1533-1553. https://doi.org/10.1177/0042098018767614
[6] Duran-Encalada, J.A., Paucar-Caceres, A. (2009). System dynamics urban sustainability model for Puerto Aura in Puebla, Mexico. Systemic practice and action research, 22(2): 77-99. https://doi.org/10.1007/s11213-008-9114-8
[7] Haase, D., Schwarz, N. (2009). Simulation models on human-nature interactions in urban landscapes: A review including spatial economics, system dynamics, cellular automata and agent-based approaches. Living Reviews in Landscape Research, 3(2): 1-45. http://www.ufz.de/index.php?en=4576http://www.ufz.de/index.php?en=13323.
[8] Park, M., Kim, Y., Lee, H.S., Han, S., Hwang, S., Choi, M.J. (2013). Modeling the dynamics of urban development project: Focusing on self-sufficient city development. Mathematical and Computer Modelling, 57(9-10): 2082-2093. https://doi.org/10.1016/j.mcm.2011.05.058
[9] Li, X., Yeh, A.G.O. (2004). Analyzing spatial restructuring of land use patterns in a fast growing region using remote sensing and GIS. Landscape and Urban Planning, 69(4): 335-354. https://doi.org/10.1016/j.landurbplan.2003.10.033
[10] Jiao, L., Mao, L., Liu, Y. (2015). Multi-order landscape expansion index: Characterizing urban expansion dynamics. Landscape and Urban Planning, 137: 30-39. https://doi.org/10.1016/j.landurbplan.2014.10.023
[11] Sinha, S. (2018). Spatial metrics: A tool for measurement of urban growth / sprawl. Spatial Metrics: A Tool for Measurement of Urban Growth / Sprawl, 11: 202.
[12] Jantz, P., Goetz, S., Jantz, C. (2005). Urbanization and the loss of resource lands in the Chesapeake Bay watershed. Environmental Management, 36(6): 808-825. https://doi.org/10.1007/s00267-004-0315-3
[13] Deng, J.S., Wang, K., Hong, Y., Qi, J.G. (2009). Spatio-temporal dynamics and evolution of land use change and landscape pattern in response to rapid urbanization. Landscape and Urban Planning, 92(3-4): 187-198. https://doi.org/10.1016/j.landurbplan.2009.05.001
[14] Dutta, V. (2012). Land use dynamics and peri-urban growth characteristics: Reflections on master plan and urban suitability from a sprawling north Indian city. Environment and Urbanization Asia, 3(2): 277-301. https://doi.org/10.1177/0975425312473226
[15] Shi, Y., Sun, X., Zhu, X., Li, Y., Mei, L. (2012). Characterizing growth types and analyzing growth density distribution in response to urban growth patterns in peri-urban areas of Lianyungang City. Landscape and Urban Planning, 105(4): 425-433. https://doi.org/10.1016/j.landurbplan.2012.01.017
[16] Schieritz, N. (2002). Integrating system dynamics and agent-based modeling. In Proceedings of the XX International Conference of the System Dynamics Society, 6(3): 1-3. https://citeseerx.ist.psu.edu/viewdoc/download?doi=10.1.1.379.7404&rep=rep1&type=pdf.
[17] Größler, A., Stotz, M., Schieritz, N. (2003). A software interface between system dynamics and agent-based simulations: linking Vensim® and RePast®. In Proceedings of the 21st System Dynamics Society International Conference, 8(7): 20-24. http://citeseerx.ist.psu.edu/viewdoc/download?doi=10.1.1.452.6032&rep=rep1&type=pdf.
[18] Lewe, J.H., Hivin, L.F., Mavris, D.N. (2014). A multi-paradigm approach to system dynamics modeling of intercity transportation. Transportation Research Part E: Logistics and Transportation Review, 71: 188-202. https://doi.org/10.1016/j.tre.2014.09.011
[19] Clarke, K.C., Gaydos, L.J. (1998). Loose-coupling a cellular automaton model and GIS: long-term urban growth prediction for San Francisco and Washington/Baltimore. International Journal of Geographical Information Science, 12(7): 699-714. https://doi.org/10.1080/136588198241617
[20] He, C., Shi, P., Chen, J., et al. (2005). Developing land use scenario dynamics model by the integration of system dynamics model and cellular automata model. Science in China Series D: Earth Sciences, 48(11): 1979-1989. https://doi.org/10.1360/04yd0248
[21] Han, J., Hayashi, Y., Cao, X., Imura, H. (2009). Application of an integrated system dynamics and cellular automata model for urban growth assessment: A case study of Shanghai, China. Landscape and Urban Planning, 91(3): 133-141. https://doi.org/10.1016/j.landurbplan.2008.12.002
[22] He, C., Okada, N., Zhang, Q., Shi, P., Zhang, J. (2006). Modeling urban expansion scenarios by coupling cellular automata model and system dynamic model in Beijing, China. Applied Geography, 26(3-4): 323-345. https://doi.org/10.1016/j.apgeog.2006.09.006
[23] Wijaya, A., Darma, S., Darma, D.C. (2020). Spatial interaction between regions: Study of the East Kalimantan Province, Indonesia. International Journal of Sustainable Development and Planning, 15(6): 937-950. https://doi.org/10.18280/ijsdp.150618
[24] Edewede, D.B., Onojiede, E.D., Peace, N. (2019). Effect of urban centre growth on vegetation cover: A case study of ebony state, south-eastern, Nigeria. Environmental and Earth Sciences Research Journal, 6(2): 51-58. https://doi.org/10.18280/eesrj.060201
[25] Fouda, Y.E., ElKhazendar, D.M. (2021). Spatio-temporal analysis to dynamically map and audit urban growth in peri-urban areas. International Journal of Sustainable Development and Planning, 16(5): 853-868. https://doi.org/10.18280/ijsdp.160506
[26] Stewart, D., Sirr, L., Kelly, R. (2006). Smart Growth: a buffer zone between decentrist and centrist theory? International Journal of Sustainable Development and Planning, 1(1): 1-13. https://doi.org/10.2495/SDP-V1-N1-1-13
[27] Mohammed, B.R., Jomaah, M.M., Zehawi, R.N. (2021). Emergence time phasing for the potential new airports in the middle district of Iraq. International Journal of Design & Nature and Ecodynamics, 16(5): 505-516. https://doi.org/10.18280/ijdne.160504
[28] Rui, Y., Ban, Y. (2011). Urban growth modeling with road network expansion and land use development. In Advances in Cartography and GIScience. 2(6): 399-412. https://doi.org/10.1007/978-3-642-19214-2_27
[29] Shi, G., Shan, J., Ding, L., Ye, P., Li, Y., Jiang, N. (2019). Urban road network expansion and its driving variables: a case study of Nanjing City. International Journal of Environmental Research and Public Health, 16(13): 2318. https://doi.org/10.3390/ijerph16132318
[30] Kalpana, L.D.C.H.N., Abenayake, C., Jayasinghe, A., Mahanama, P.K., Sanjaya, N. (2021). A novel approach to measure the pattern of urban agglomeration based on the road network. International Journal of Sustainable Development and Planning, 16(2): 251-262. https://doi.org/10.18280/IJSDP.160205
[31] Williams, B., Petrov, L., Ustaoglu, E. (2017). Scenario analysis of alternative land development patterns for the Leipzig-Halle Region: Implications for transport-land-use sustainability. Urban Planning, 2(1): 108-129. https://doi.org/10.17645/up.v2i1.838
[32] Fuladlu, K., Riza, M., Ilkan, M. (2021). Monitoring urban Sprawl using time-series data: Famagusta region of Northern Cyprus. SAGE Open, 11(2): 21582440211007465. https://doi.org/10.1177/21582440211007465
[33] Khwedim, K.H., Salah, H.A., Al-Adely, J.A. (2011). Heavy Metals in some soils of Baquba city: determination Distribution and Controlling Factor. Diyala Journal for Pure Sciences, 7(2): 166-183.
[34] (INPC), I.N.P.C. (2012). Iraq Population Situation Analysis Report 2012 Iraq National Population Commission (INPC) Supported by United Nations Population Fund. https://iraq.unfpa.org/en/publications/iraq-population-situation-analysis-report-2012.
[35] Kennedy, R.L., Woods, H., Blake, J.E., Henry, G., Majid, K., Chambers. (2021). Iraq- Britannica Online Encyclopedia. pp. 1-118. https://www.britannica.com/place/Iraq/Economy.
[36] Ministry of Construction and Housing - Iraq, Housing Standards Handbook. 2010. (Written in Arabic). https://investpromo.gov.iq/wp-content/uploads/2013/06/URBAN-HOUSING-STANDARDS_Ar.pdf.
[37] Laws, I., Legislation. (1964). Municipal Administration Law. (Written in Arabic). https://iraqld.hjc.iq/LoadLawBook.aspx?SC=120120018123689#.
[38] Revolutionary Command Council, about Building Houses and Housing. 1979.(Written in Arabic). http://wiki.dorar-aliraq.net/iraqilaws/?p=2716.
[39] Mahmoud, H.M. (2014). The impact of laws and regulations in urban land management and urban Baghdad-A Case Study. The Iraqi Journal of Architecture and Planning, 13(3): 48-64. Print ISSN: 2617-9547.