Cordelia Onyinyechi Omodero
© 2022 IIETA. This article is published by IIETA and is licensed under the CC BY 4.0 license (http://creativecommons.org/licenses/by/4.0/).
OPEN ACCESS
The impact of environmental deterioration and pollution on public health in Nigeria cannot be overstated. Despite the government's efforts to alleviate the public's suffering in the impacted areas, the situation has worsened. The purpose of this research is to look at the role of environmental taxes in improving the health of Nigerians. The analysis relies on secondary data acquired between 2010 and 2020 from the Central Bank of Nigeria Statistical Bulletin and the Organization for Economic Cooperation and Development (OECD). The data is examined using the multiple regression approach, and the results reveal that the existing environmental related taxes are not benefiting the public's health. However, government investment on environmental preservation has a large and favorable influence on public health. The report suggests the implementation of different environmental degradation and pollution levies that are available in nations with similar levels of pollution as Nigeria. The research does recommend, however, that firms with technological capacity and inventions to manage pollution and decrease environmental harm should be granted tax breaks as a method of encouraging and challenging other companies to replicate their good deeds.
environmental taxation, pollution, degradation, preservation, public health, JEL classification codes: H23, I18, O44, Q53
The growing concentration of greenhouse gas (GHG) emissions amplifies the natural greenhouse effect and affects the rising global temperature [1]. Today, climate change is an obvious truth and its effect on public health remains an irrefutable fact. Its impact on the status of the environment and on mankind has been identified as the most important issue driving global environmental change. CO2 emissions continue to be the most significant contributor to glasshouse gases (GHG), and the rise in their mass is mostly due to the detrimental use of harmful (non-renewable) energy [2]. CO2 refers to all carbon dioxide produced as a result of gas flaring and the use of solid, liquid, and gas fuels. Carbon dioxide emissions are pollutions caused by the combustion of fossil fuels and the production of cement. The rise in economic activity causes an increase in thermal pollution of the atmosphere. As the pace of CO2 generation increases, it becomes more widely troublesome and difficult. GHG emissions are mostly caused by the use of fossil fuels and the expansion of industrial and agricultural output, which is then followed by increased waste [1]. According to ref. [3], the rise of energy generated by fossil fuels (Coal, Oil, and Gas) and global population expansion in recent decades have boosted energy consumption.
Oil and gas development in Nigeria has resulted in a significant degree of environmental contamination that is yet to be addressed. Much of the natural gas recovered from Delta oil wells is promptly burnt, or flared, into the atmosphere at a rate of about 70 million M3 per day. In 2003, about 99 percent of surplus gas in the Niger Delta was flared [4], but in 2016, Shell decreased gas flaring in Nigeria by 85 percent, leaving it at an average of 10.15 percent [5]. The use of gas flares raises the danger of illness, food poverty, and weather damage [6]. Toxins such as benzene, nitrogen oxides, dioxins, hydrogen sulphide, xylene, and toluene are released during the burning of associated gas [7]. Hydrocarbons from oil spills and gas flares pollute surface water, ground water, air, and crops, and they may readily accumulate in aquatic creatures and food crops on which the inhabitants rely [8]. Tuberculosis and chest infections, lung illness, cardiovascular disease, infertility, and skin disorders are only a few of the documented instances becoming more common as a result of heat exposure from oil exploration-related operations [9, 10].
The environmental concerns connected with oil activity in the Niger Delta have become intolerable for the inhabitants of the region. Water, land, and air have all been polluted. Despite restrictions implemented 20 years ago to improve the process, the largest gas flaring business is Shell Petroleum Development Company of Nigeria Ltd, and most associated gas is flared, producing local pollution and adding to depletion of the ozone layer [11]. In a 2011 study, the United Nations Environment Programme (UNEP) condemned Shell Petroleum Development Company (SPDC) for how it deals with environmental harm it has created in the Niger Delta area, particularly in Ogoni territory. According to UNEP, Ogoni land requires the greatest level of clean-up in the world. According to the World Bank research, if determined cleanup is not carried out, 40 percent of the Niger Delta's livable area would dwindle in 20 years. The federal government confirmed that over 40,000 oil leaks had happened in the previous 58 years of oil exploration. Aside from oil spills, gas flaring is a major health concern. Rivers State experienced significant black soot in the early part of 2017, necessitating the participation of several environmental specialists to determine the source and propose a remedy [12-14]. A clean-up of the region, including full restoration of wetlands, streams, fishing grounds, and mangroves, is projected to take 25 years [15].
In general, human health in Nigeria is deplorable. At birth, life expectancy is 43.8 years, infant mortality is 800 per 100,000 live births, and maternal mortality is 100 per 100,000 [16]. Furthermore, the incidence of infectious and parasitic illnesses such as malaria (141 per 100,000), TB (282 per 100,000), HIV/AIDS (3.9 percent), and Schistosomiasis, among others, remains extremely high [16]. Additionally, illnesses such as diabetes and cardiovascular disease, which are frequently connected with rising socioeconomic well-being, are becoming major health issues in the country. Only around 48% of the population has “sustainable” access to clean water, and only about 44% has acceptable sanitation [16].
Many Nigerians are particularly sensitive to climate change due to their poor human health status. This might happen in a variety of ways. Some of the immediate consequences of their sensitivity include fatalities, strokes, sickness, and damage as a result of greater exposure to heat waves, as well as impacts on respiratory systems. Indirect consequences of climate change and sea level rise include changes in the prevalence and transmission of vector-borne illnesses (such as malaria) and changes in the transmission of infectious diseases (including cholera, influenza etc.).
Environmental taxes are one policy strategy for avoiding environmental damage, as addressed in numerous studies [2], [17-19]. Ecological taxes contribute to long-term development by deterring detrimental environmental activities [20, 21]. To reduce greenhouse gas and CO2 emissions, international organizations (United Nations (UN), European Union (EU), Intergovernmental Panel on Climate Change (IPCC), and Organization for Economic Co-operation and Development (OECD) have strongly suggested a series of regulations and administrative reforms, including energy transformation, environmental related taxes, carbon-tax, emission canons, and discharge swapping arrangements [2]. The Kyoto Protocol and the Paris Climate Agreement both advocated environmental regulation and green technologies as important strategies for decreasing waste flow [22]. In the best-case scenario, environmental taxes are a powerful tool for compelling businesses to aggressively support emission control [23].
To minimize greenhouse gas emissions, the primary environmental regulations include administrative measures, regulations, environmental levies, carbon pricing, and energy-efficient technology [23]. Environmental-related taxes are tax policies that attempt to minimize energy-related pollution emissions and have a negative influence on the ecological footprint [22]. Following the various health concerns in Nigeria, particularly in the Niger Delta states where oil and gas extraction is carried out, the efficacy of environmental taxes is regarded important as a topic of research. In this study, a few environmental taxes and levies are utilized to investigate the impact of such taxes on promoting health. There have been few studies on environmental taxes, despite the fact that there are environmental regulations that have received inadequate enforcement due to the country's poor judicial framework.
Rafique et al. [22] used an autoregressive distributed lag (ARDL) method to evaluate the effects of environmental taxes on ecological footprints in 29 OECD nations. Environmental-related taxation, economic development, foreign direct investment, energy usage, urbanization, renewable energy, and industrialization all had a major impact on the long-term ecological footprint in OECD nations, according to the empirical findings. Karmaker et al. [24] used a comprehensive, robust model with sufficient statistical power to explore the causal relationships between environmental taxation and environmental-related technology innovation. From 1995 to 2018, this model used employed co-integration analysis with cross-sectional dependency to quantify the effects of environmental taxes on environmental-related technical innovation in 42 high and middle-income nations. Long-run findings indicate that environmental taxes induce technology advancement; for comparison purposes, using the CCEMG and AMG techniques, a 1% increase in environmental taxes was found to increase environment-related technological innovation by 0.57 and 0.78 percent on average for high and middle-income countries, respectively.
Akkaya and Hepsag [25] analyzed the link between carbon dioxide emissions and public income from excise taxes on gasoline use in Turkey by using an asymmetric online arc co-integration test and an error correction model presented by Hepsag Commun Stat-Simul Comp 50:400-412 (2021). From 1985 through 2018, the study gathered sample which included yearly data on CO2 emissions, GDP, and gasoline tax in Turkey. The empirical data showed that there were connections between economic growth, CO2 emissions, and fuel tax, which supported the environmental Kuznetscurve (EKC) theory in both the short and long term. However, the discovered that gasoline taxes were statistically negligible and had no effect on CO2 emissions. Ghazouani et al. [2] investigated the effect of carbon price measures in improving environmental quality in European economies. To that aim, the study presented fresh findings and consequences regarding the efficacy of environmental rules and policies for climate change and sustainability. The authors thoroughly explored the effects of a carbon price on CO2 emissions reduction. The findings of the estimate of the different matching techniques using the propensity score matching method allowed a notice of a positive and significant influence of the implementation of the carbon-tax on encouraging the reduction of carbon emissions.
Sabine et al. [26] examined the environmental and macroeconomic impacts of France's carbon pricing policy, which was implemented to achieve the Paris Agreement's objective. The study showed that the potential of recycling tax funds had a substantial impact on the tax's acceptability. In simulations, several strategies for recycling tax income were examined. The approach utilized was a Reunion Island computable general equilibrium (CGE) model (GetRun-NRJ) that took into account all island specificities. The findings demonstrated that the carbon tax allowed for replacements between fossil and renewable energy generation while also lowering CO2 emissions. However, the tax had a detrimental impact on the overall economy. He et al. [27] studied the greenhouse gas emission reduction effects of environmental taxes in Organization for Economic Cooperation and Development (OECD) countries and Chinese provinces concurrently, as well as a comparative evaluation of the pollutant decarbonisation effects of environmental taxes in OECD and China under different environmental tax collection scales, industrial agglomeration, and industrial agglomeration (ARDL). The statistics are gathered from OECD nations' environmental fees and pollutants from 1994 to 2016 and Chinese provinces from 2004 to 2016. According to the overall regression results of the study, environmental fees assisted to reduce pollutant emissions in both OECD nations and China.
In Liu et al. [28], a Computable General Equilibrium (CGE) model for the Province of Saskatchewan was built in order to evaluate and assess a number of direct and indirect socioeconomic consequences of a carbon tax. To get robust results, the energy sector was further disaggregated based on production structure and energy usage pattern. To assess the interdependence of the carbon tax, GHG emission reduction, and economic development, several carbon tax rates were simulated. In-depth investigations were also carried out to study certain additional macroeconomic effects and reactions from specific economic sectors. The findings revealed that the GDP shift was mostly caused by a decrease in consumption and a rise in imports as a result of income fall and lesser tariff rates. Among all industries, changes in coal and petroleum product production and processing resulted in the highest GHG emissions. The study concluded that clean coal and petroleum technology might be critical concerns in achieving both national and provincial environmental and economic goals. Massetti [29] evaluated emission reduction objectives that China and India might realistically accept in the upcoming rounds of climate negotiations. The analysis was based on a business-as-usual scenario and four carbon price scenarios produced with the WITCH model until 2050. The results suggested that the lowest level of taxation (beginning at $10 per tonne of CO2 in 2020) would cut emissions by 25% in China and 30% in India in 2050, compared to the minimal cost. The marginal abatement cost curves, on the other hand, were steep, and a greater level of taxes resulted in little emissions reductions at large costs.
The statistical methodology for this investigation is the multiple regression analysis. Multiple regression can assess the relative importance of one or more predictor variables in relation to the critical values. The capacity to discover outliers, or abnormalities, is the second benefit. For example, in this study, using multiple regression techniques, certain variables were discovered to be unsuitable for this investigation and were excluded during the data cleaning phase. The research investigates the effect of environment related taxes on public health in Nigeria. In this study, data obtained from the sources indicated in Table 1 are analyzed using the Statistical Package for Social Sciences (SPSS). The statistics ranged from 2010 to 2020.
Table 1. Variables description and sources
|
Variable |
Description |
Source |
|
HLT |
Public Health |
CBN Statistical Bulletin |
|
ESC |
Environmental Safety Cost |
CBN Statistical Bulletin |
|
PPT |
Petroleum Profits Tax |
Organization for Economic Cooperation and Development (OECD) |
|
GET |
Gas Exploration Tax |
Organization for Economic Cooperation and Development (OECD) |
Source: Collation by Author, 2021
The model specified for this study is as follows:
$\mathrm{Y}=\beta_{0}+\beta X_{1}+\beta X_{2}+\ldots \mu_{i t}$
where,
Y=Overheads on Public Health (dependent variable);
X=Environment related taxes and safety cost (autonomous variables);
β=Coefficient;
μit=Error term.
The above model can be specifically applied to this study as:
$L O G H L T=\beta_{0}+\beta_{1} L O G E S C+\beta_{2} L O G P P T+\beta_{3} L O G G E T+\mu_{i t}$
where:
HLT=Expenditure on public health; ESC=Environmental Safety Cost; PPT=Petroleum Profits Tax; GET=Gas Exploration Tax.
β0=Coefficient of the parameter estimate;
β1-β3=intercept;
μit=Error term;
On the a priori, we expect; β1>0, β2 >0, β3>0.
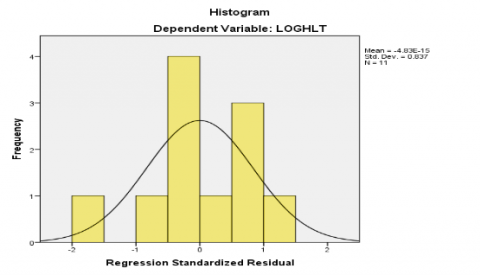
Descriptive statistics in Table 2 are used to characterize the fundamental characteristics of data in research. They give concise summaries of the sample and measurements. They are the foundation of almost any quantitative data analysis, along with simple graphical analysis. The range denotes the difference between the maximum and least values. Figure 1 supports the data set's normalcy. When the data set is normally distributed, histogram normality corresponds to a bell shape. The bell shape is strongly highlighted in Figure l, indicating that the data set employed in this investigation is regularly allocated.
Table 2. Descriptive statistics
|
|
N |
Range |
Mini-mum |
Maxi-mum |
Mean |
Std. Deviation |
|
HLT |
11 |
.59320 |
1.9 |
2.6 |
2.3 |
.16 |
|
ESC |
11 |
.47518 |
2.3 |
2.8 |
2.5 |
.15 |
|
PPT |
11 |
.44169 |
6.1 |
6.5 |
6.3 |
.16 |
|
GET |
11 |
1.17482 |
3.8 |
5.1 |
4.5 |
.39 |
|
Valid N (listwise) |
11 |
|
|
|
|
|
Author’s calculation, 2021
Figure 1. Histogram normality
Correlation analysis in Table 3, is a statistical approach used in research to determine the strength of a linear relationship between two variables and compute their association. Simply defined, correlation analysis computes the amount of change in one variable as a result of a change in the other. A high correlation indicates a strong link between the two variables, whereas a low correlation indicates a weak relationship. The correlation value of 89.1% shows a positive and strong association of HLT with ESC. This finding suggests that the government's pollution control and environmental cleanup efforts contribute significantly to public health sustenance. The PPT and GET, which are environmental taxes, have a negligible negative connection with one another. PPT has a 0.078 connection with ESC, which is less than 1%, but GET has a 55.9 percent association with ESC, which is fair. That is, oil production taxes in Nigeria do not contribute to the government's environmental cleanup initiatives. PPT has a 29.6 percent connection with HLT. The findings imply that PPT does not contribute to public health issues, but the correlation between GET and HLT is 46.7 percent, indicating a weak link.
The model summary of the study is provided in Table 4. The degree of correlation between the dependent variable and the regressors is represented by the R value. The R value of 93 percent indicates that the response variable and the regressors have a positive connection. The co-efficient of determination, R Square, indicates that the independent variables employed in this study account for up to 86.5 percent of the differences in public health costs. Adjusted R-squared is used to assess the reliability of a correlation and how much it is determined by the addition of explanatory variables. Adjusted R-squared is a form of R-squared that has been updated to account for the number of independent variables in the model. When the additional term provides a good framework more than would be anticipated by chance, the adjusted R-squared increases. When a predictor improves the model by less than predicted, it drops. Normally, the corrected R-squared is positive rather than negative. It is always less than R-squared. Adding additional explanatory variables or determinants to a regression model raises the R-squared value, enticing model creators to add even more variables. This is known as imbalanced datasets, and it might result in an unjustifiably high R-squared score. The Adjusted R-squared in this study is 80.7 percent, which is smaller than the R-Squared of 86.5 percent. The outcome demonstrates that the correlation result is trustworthy. The standard error of regression (0.07) is less than one, indicating that the model prediction is correct. The Durbin-Watson coefficient is 2, indicating that the model is devoid of autocorrelation.
The analysis of variance (ANOVA) is provided in Table 5 to illustrate the combined influence of the independent factors on the dependent variable. As a result, the p-value for the F-statistic is 0.00, which is less than 0.05. This finding suggests that all environmental levies and the accompanying costs of environmental preservation have a considerable and favorable impact on public health. The outcome further demonstrates that the model is statistically significant and acceptable for this investigation.
The study examined the interconnectedness of predictor factors in Table 6. The variance inflation factors (VIF) results indicate values of 1.89, 1.7, and 2.5 for ESC, PPT, and GET, respectively. These values are less than 10, implying that there is no connection between the independent variables utilized in this study. The t-statistic for ESC is 3.865 with a p-value of 0.00, which is significant at the 1% level of significance. As a result, environmental safety costs have a major beneficial influence on public health issues. That implies the government's efforts and investments to enhance public health are paying off. Table 6 further shows that neither PPT nor GET make a substantial contribution to public health issues. The t-statistic p-values of 0.10 and 0.35 for PPT and GET, respectively, support this. Both p-values are larger than 5%, indicating that they have an insignificant impact on public health concerns.
Table 3. Correlations analysis
|
|
LOG HLT |
LOG ESC |
LOG PPT |
LOG GET |
|
|
LOGHLT |
Pearson Correlation |
1 |
.891** |
.296 |
.467 |
|
Sig. (2-tailed) |
|
.000 |
.377 |
.148 |
|
|
N |
11 |
11 |
11 |
11 |
|
|
LOGESC |
Pearson Correlation |
.891** |
1 |
.078 |
.559 |
|
Sig. (2-tailed) |
.000 |
|
.819 |
.074 |
|
|
N |
11 |
11 |
11 |
11 |
|
|
LOGPPT |
Pearson Correlation |
.296 |
.078 |
1 |
-.486 |
|
Sig. (2-tailed) |
.377 |
.819 |
|
.129 |
|
|
N |
11 |
11 |
11 |
11 |
|
|
LOGGET |
Pearson Correlation |
.467 |
.559 |
-.486 |
1 |
|
Sig. (2-tailed) |
.148 |
.074 |
.129 |
|
|
|
N |
11 |
11 |
11 |
11 |
|
|
**. Correlation is significant at the 0.01 level (2-tailed). Author’s calculation, 2021 |
|||||
Table 4. Model summary
|
Model |
R |
R Square |
Adjusted R Square |
Std. Error of the Estimate |
Durbin-Watson |
|
1 |
.930 |
.865 |
.807 |
.07181130 |
2.079 |
|
Predictors: (Constant), LOGGET, LOGPPT, LOGESC |
|||||
|
Dependent Variable: LOGHLT Author’s calculation, 2021 |
|||||
Table 5. ANOVA
|
Model |
Sum of Squares |
df |
Mean Square |
F |
Sig. |
|
|
1 |
Regression |
.231 |
3 |
.077 |
14.903 |
.002 |
|
Residual |
.036 |
7 |
.005 |
|
|
|
|
Total |
.267 |
10 |
|
|
|
|
|
Dependent Variable: LOGHLT |
||||||
|
Predictors: (Constant), LOGGET, LOGPPT, LOGESC Author’s calculation, 2021 |
||||||
Table 6. Coefficients
|
Model |
Unstandardized Coefficients |
Standardized Coefficients |
t |
Sig. |
Collinearity Statistics |
|||
|
B |
Std. Error |
Beta |
Tolerance |
VIF |
||||
|
1 |
(Constant) |
-2.344 |
1.253 |
|
-1.871 |
.104 |
|
|
|
LOGESC |
.791 |
.205 |
.741 |
3.865 |
.006* |
.527 |
1.899 |
|
|
LOGPPT |
.355 |
.187 |
.345 |
1.897 |
.100 |
.585 |
1.709 |
|
|
LOGGET |
.091 |
.090 |
.220 |
1.008 |
.347 |
.405 |
2.471 |
|
|
Dependent Variable: LOGHLT * Significant @ 1% level Author’s calculation, 2021 |
||||||||
Using data from 2010 to 2020, the study evaluates the impact of environmental levies on public health advances in Nigeria. According to the findings of the research, none of the environmental levies in Nigeria had a rewarding impact. To that aim, the research suggests the implementation of various environmental degradation levies. It would increase government income while also acting as a disincentive to corporations whose operations threaten the environment and the lives of Nigerians. The study supports an introduction of carbon emission tax. The intensity of carbon discharge should be weighed and taxed appropriately. Carbon tax is the way the government can redistribute revenue and reduce capital taxes as a mechanism to address public welfare [30]. Companies who use technical innovation to minimize carbon emissions and pollution should be rewarded. Tax supervision efficiency should be improved to guarantee correct computation of carbon discharge taxes and the corresponding penalties if they are not met. When the environment in which people live is contaminated, it is impossible to create long-term economic growth. Alternative energy resources – hydro, solar, wind, biomass, coal, and nuclear – must be employed to reduce the country's reliance on gas-fired power plants while minimizing the negative consequences of fossil-dependent energy sources (Federal Ministry of Environment Nigeria, 2010 [16]).
[1] Miceikiene, A., Gesevicience, K., Rimkuviene, D. (2021). Assessment of the dependence of GHG emissions on the support and taxes in the EU countries. Sustainability, 13(14): 1-15. https://doi.org/10.3390/su13147650
[2] Ghazouani, A., Xia, W., Jebli, M.B., Shahzad, U. (2020). Exploring the role of carbon taxation policies on CO2 emissions: Contextual evidence from tax implementation and non-implementation European countries. Sustainability, 12(20): 1-16. https://doi.org/10.3390/su12208680.
[3] Asumadu-Sarkodie, S., Owusu, P.A. (2016). Feasibility of biomass heating system in Middle East Technical University, Northern Cyprus campus. Cogent Engineering, 3(1): 1-15. https://doi.org/10.1080/23311916.2015.1134304
[4] United Nations Framework Classification (2003). Nigeria’s first national communication under the United Nations Framework Convention on Climate Change. Wikipedia. Retrieved: August 3, 2017.
[5] NNPC. (2016). Shell reduces gas flaring in Nigeria by 85%. Sweet crude reports.com.
[6] Werner, A.K., Vink, S., Watt, K. (2015) Environmental health impacts of unconventional Natural Gas development: A review of the current strength of evidence. Science of the Total Environment, 505: 1127-1141. https://doi.org/10.1016/j.scitotenv.2014.10.084
[7] Edafienene, A.K. (2012). Media exposure, policy agenda setting and risk communication in Sub-Saharan Africa: A case study of Nigeria’s Niger Delta region. PhD, University of Glamorgan.
[8] Nriagu, J. (2011). Oil industry and the health of communities in the Niger Delta of Nigeria. In: Nriagu JO (ed.) Encyclopedia of Environmental Health. Burlington: Elsevier, 240-250.
[9] Adekola, J., Fischbacher-Smith, M., Fischbacher-Smith, D., Adekola, O. (2017). Health risks from environmental degradation in the Niger Delta, Nigeria. Environment and Planning C: Politics and Space, 35(2): 334-354. https://doi.org/10.1177/0263774X16661720.
[10] Ovuakporaye, S.I., Aloamaka, C.P., Ojieh, A.E. (2012). Effects of gas flaring on lung function among residents of IB Gas flaring community in Delta State, Nigeria. Research Journal of the Environmental Earth Sciences, 4: 525-528.
[11] Forward Nigeria Movement. (2016). N96 Trillion Oil Revenue: how Nigeria short Changed oil producing areas. Retrieved from: http://forwardnigeria.org/, accessed on July 1st 2017.
[12] Punch News. (2017). The black soot plague in Port Harcourt. Retrieved: www.punchng.com, accessed on November 5 2021.
[13] Vanguard News. (2017). Strange black soot blankets Port Harcourt. www.vanguardng.com, accessed on August 7 2021.
[14] Nigerian Bulletin. (2017). Black Soot Pollution. 10 things Rivers State residents should do to stay alive. https://www.nigerianbulletin.com.
[15] Guardian News. (2016). A clean-up of the region, including full restoration of wetlands, streams, fishing grounds, and mangroves. Retrieved from: https://guardian.ng/.
[16] Federal Ministry of Environment Nigeria. (2010). National environmental economic and Development study for climate change in Nigeria. Accessible online at: https://unfccc.int/files/adaptation/application/pdf/nigerianeeds.pdf.
[17] He, P., Ya, Q., Chengfeng, L., Yuan, Y., Xiao, C. (2021). Nexus between environmental tax, economic growth, energy consumption, and carbon dioxide emissions: Evidence from China, Finland, and Malaysia based on a panel-ARDL approach. Emerging Markets Finance and Trade, 57(3): 698-712. https://doi.org/10.1080/1540496X.2019.1658068
[18] Liang, Q., Fan, Y., Wei, Y. (2007). Carbon taxation policy in China: How to protect energy and trade-intensive sectors? Journal of Policy Modeling, 29(2): 311-333. https://doi.org/10.1016/j.jpolmod.2006.11.001
[19] Xiong, Z., Li, H. (2019). Ecological deficit tax: A tax design and simulation of compensation for ecosystem service value based on ecological footprint in China. Journal of Cleaner Production, 230: 1128-1137. https://doi.org/10.1016/j.jclepro.2019.05.172
[20] Shahzad, U. (2020). Environmental taxes, energy consumption, and environmental quality: Theoretical Survey with policy implications. Environmental Science and Pollution Research, 27: 24848-24862. https://doi.org/10.1007/s11356-020-08349-4
[21] Hashmi, R., Alam, K. (2019). Dynamic relationship among environmental regulation, Innovation, CO2 emissions, population, and economic growth in OECD countries: A panel investigation. Journal of Cleaner Production, 231: 1100-1109. https://doi.org/10.1016/j.jclepro.2019.05.325
[22] Rafique, M.Z., Fareed, Z., Ferraz, D., Ikram, M., Huang, S. (2022). Exploring the heterogeneous impacts of environmental taxes on environmental footprints: An empirical assessment from developed economies. Energy, 238: 121753. https://doi.org/10.1016/j.energy.2021.121753
[23] Hu, B., Dong, H., Jiang, P., Zhu, J. (2020). Analysis of the applicable rate of environmental tax through different tax rate scenarios in China. Sustainability, 12(10): 1-14. https://doi.org/10.3390/su12104233
[24] Karmaker, S.C., Hosan, S., Chapman, A.J., Saha, B.B. (2021). The role of environmental taxes on technological innovation. Energy, 232: 121052. https://doi.org/10.1016/j.energy.2021.121052
[25] Akkaya, Ş., Hepsag, A. (2021). Does fuel tax decrease carbon dioxide emissions in Turkey? Evidence From an asymmetric nonlinear cointegration test and error correction model. Environmental Science and Pollution Research, 28: 35094-35101. https://doi.org/10.1007/s11356-021-12907-9
[26] Sabine, G., Avotra, N., Olivia, R., Sandrine, S. (2020). A macroeconomic evaluation of a carbon tax in overseas territories: A CGE model for Reunion Island. Energy Policy, 147: 111738. https://doi.org/10.1016/j.enpol.2020.111738
[27] He, P., Ning, J., Yu, Z., Xiong, H., Shen, H., Jin, H. (2019). Can environmental tax policy really help to reduce pollutant emissions? An empirical study of a panel ARDL Model based on OECD countries and China. Sustainability, 11(6): 1-32. https://doi.org/10.3390/su11164384
[28] Liu, L., Huang, C.Z., Huang, G., Baetz, B., Pittendrigh, S.M. (2018). How a carbon tax will affect an emission-intensive economy: A case study of the Province of Saskatchewan, Canada. Energy, 159: 817-826. https://doi.org/10.1016/j.energy.2018.06.163
[29] Massetti, E. (2011). Carbon tax scenarios for China and India: Exploring politically feasible Mitigation goals. International Environmental Agreements: Politics, Law and Economics, 11: 209-227. https://doi.org/10.1007/s10784-011-9157-7
[30] Karydas, C., Zhang, L. (2019). Green tax reform, endogenous innovation and the growth Dividend. Journal of Environmental Economics and Management, 97: 158-181. https://doi.org/10.1016/j.jeem.2017.09.005