Jeffery Anak Pirah | Rodeano Roslee*
© 2022 IIETA. This article is published by IIETA and is licensed under the CC BY 4.0 license (http://creativecommons.org/licenses/by/4.0/).
OPEN ACCESS
At present, most academics and practitioners only make assumptions or simplistic correlation between soils in Sabah, Malaysia and soils in West Malaysia in order determine the Soil Erodibility Factor for Erosion and Sedimentation Control Plan (ESCP) submission apart from using The Soils of Sabah, Volume 5 which is rather archaic or obsolete. This study shall be the foundation for moves to build up databank for Department and Irrigation Drainage (DID) Sabah, Malaysia based on soil taxonomy for erosion and sedimentation control calculations. In term of environmental control application, this research provides specific required information in order to generate precise calculation in projecting the total sediment yield for ESCP for areas around the West Coast of Sabah. Findings of the study would benefit both academicians and ESCP practitioners in generating sediment yield based on Soil Map of Sabah.
soil erodibility, erosion, hydrology, Sabah
Most hydrology and geohydrology practitioners in Sabah face problems when it comes to the appropriate Soil Erodibility Factor (SEF) value. This shortcoming is reported in a proceeding organized by Malaysian Stormwater Organization in 2017 [1] and highlighted the critical issue of non-existence ESCP guidelines or manual for Sabah and Sarawak. Most practitioners for both states are guided by motley collections of papers and journals by respective researchers but failed to transcend to engineering practitioners. He reckoned that there is a need to develop guideline for both states with the existing Guideline for Erosion and Sediment Control in Malaysia as the precursor to ease the sediment yield calculation with required pre-determined factors. The most concerning data which gone missing are the Rain Erosivity Factor and Soil Erodibility Factor as the Isorodent Map and Erodibility Factor for local soil series are not provided for both states.
Slope failure associated with steep slopes and heavy rain (runoff) is one of the outcomes which plagues roads in Malaysia especially in Sabah since most of the time, the geological inputs were rarely considered during the design stage and construction execution in accordance to the references [2-7]. Hence, it is now a common practice to submit both Urban Storm (MSMA) and ESCP calculation for most infrastructure works. The study on erosion and sedimentation is required for submission to the Drainage and Irrigation Department of Sabah for review via Erosion and Sediment Control Plan Submission (2018) as part of EIA requirements is based on the [8] which takes precedence over the [9] by the Department of Environment, Malaysia [10-12].
One of the closest resources which can be use in deriving these factors in Sabah context would be The Soils of Sabah, Volume 5 authored by the ref. [13] which was produced by the Land Resource Division, Ministry of Overseas Development United Kingdom back in 1975. Nevertheless, data in regards to soil is quite incomplete where certain types of soil are not furnished with particle distribution detail which is essential in deriving the Soil Erodibility Factor. Further to that, these data may be deemed as obsolete since it was collected more than 40 years ago with possible aggravation due land use and changes due to socio-economic growth. Apart from obsolete data, the available information indicates the most of the Soil Family within the Soil Association is based on convenient random sampling conducted mostly at the East Coast of Sabah.
The natures of sediment in large quantities can be hazardous. It is likely to cause physical, chemical, biological and economic impacts to waters. Apart from that, siltation can cause changes in flow patterns, increase in water treatment costs, hindrances to riverine navigation, and the increase possibilities of flooding. Extending to that will be the problem caused by sediment which restricts light penetration, transportation of other pollutant and covering substrates that provide habitat for fish and aquatic life [8, 9].
The study is stringently following the designated soil association based on the Soil Map of Sabah. The following table includes detail of the types of soil associated to alluvium in Sabah (Sabah State Government, n.a) for this study with exception for Dalit which is also consist partially alluvium.
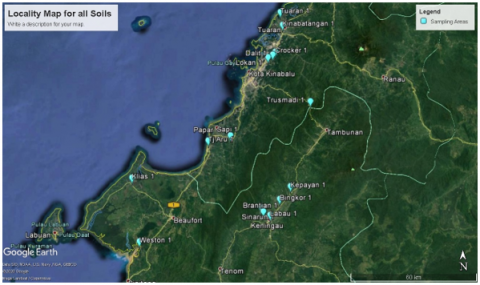
The study was carried out around the westcoast of Sabah, covering a total area of 9,000km2. The topographic setting of this area involves multiple type of landscape as tabulated in Table 1 where all the activities such as mapping and sampling were conducted which have high inundation possibilities as shown in Figure 1.
Figure 1. Sampling locations
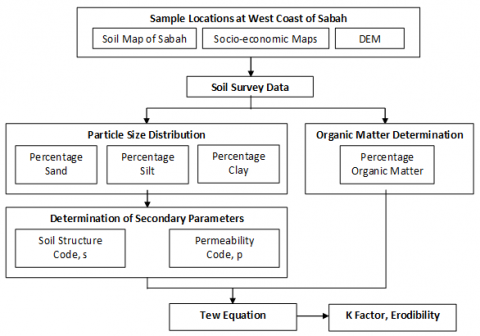
The purpose of this study is to identify sampling locations, gather information, process information and to produce the K factor, soil erodibility value for different types of soil within the West Cost of Sabah. Soils shall be sampled in accordance to BS 1377 Part 1 Methods of Test for Soils for Civil Engineering Purposes: General Requirements and Sample Preparation. The proposed framework is an adaptation from Guideline for Erosion and Sediment Control in Malaysia (2010) as shown in Figure 2.
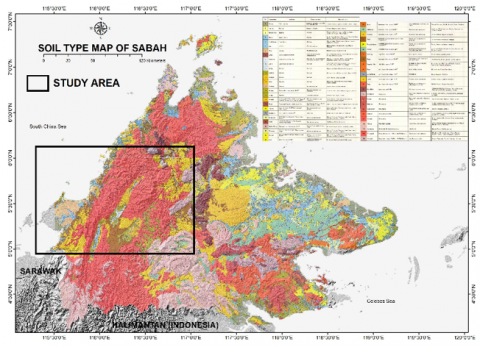
The sampling method adopted for this study is purposive sampling where the location of the sample is determined by Soil Map of Sabah, Socio-economic maps and Digital Elevation (DEM) maps. The research boundary and the major soil types for this research is determined by four soil sheets of The Soil of Sabah namely; Soils Sheet NB50-6 (Tuaran) [14], Soils Sheet NB50-7 (Sugut) [15], Soils Sheet NB50-9 (Labuan) [16], and Soils Sheet NB50-10 (Kota Kinabalu) [17] and their landform type as tabulated in Table 1 and Figure 3.
Figure 2. Study frame work
Table 1. Landform and soil association of alluvial soils
|
Key |
Soil Association / Name |
Landform |
Remarks |
|
1,
3 |
Weston,
TanjungAru |
Tidal Swamp and beaches |
Sulphidic materials, Beach deposit |
|
4, 5,
6, 7 |
Tuaran, Kinabatangan,
Sapi, Klias |
Floodplains |
Recent accreting alluvium, Marine alluvium |
|
10, 11 |
Labau, Bingkor |
Valley floors and terraces |
Subrecent accreting alluvium |
|
12, 16, 13, 31 39 |
Brantian, Sinarun, Kepayan, Dalit Lokan |
Terraces Low and moderate hill High and very high hill |
Older alluvium N/A N/A |
|
47, 50 |
Crocker, Trusmadi |
Plateaus |
N/A |
Figure 3. Soil type map of the study area
The depth of samples per soil type is divided into three as tabulated in Table 2 is based on the study [8].
Soil erodibility is defined as the resistance of soil in both detachment and transport [8, 9] and an important index to measure soil susceptibility to water erosion. The value recommended by DID [8, 9] is based on Tew Equation as shown in Equation 1 and/or Tew Nomograph. For this study, Tew equation is the preferred way to derive the Soil Erodibility Factor, K (factor).
Table 2. Depth of sampling
|
Texture Layer |
Soil Layer Depth (meter) |
Application |
|
A (Subsurface Soil) |
0.00-0.50 |
When soil is in natural state and not being disturbed (Rhizosphere) |
|
B (Subsoil) |
0.51-1.00 |
Based on site clearing, grubbing depth and earthwork details |
|
C (Substratum) |
1.01-1.50 |
Based on site clearing, grubbing depth and earthwork details |
K = [1.0 x 10⁻⁴(12-OM) M1.14 + 4.5 (s-3) + 8.0 (p-2)] / 100
where,
K – Soil Erodability Factor (ton/ac.) * (100ft.ton.in/ac.hr)
M – (% Silt + % Very Fine Sand) x (100 - % Clay)
OM - % of Organic Matter
S – Soil Structure Code
P – Permeability Class.
There are two types of tests to be conducted in order to acquire primary data from the field in order to generate the Soil Erodibility Factor. Samples retrieved from the field shall undergo particle Size Distribution and Organic Matter Determination. The outcome of these parameters is essential when generating Soil Erodibility Factor through Tew Equation or through Tew Nomograph.
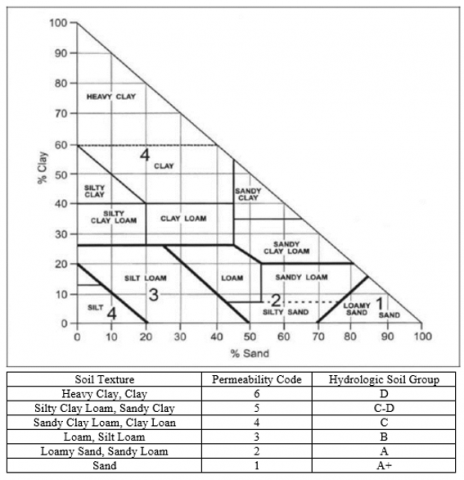
The Determination of Particle Size Distribution shall be conducted for all samples in order to enable a continuous particle size distribution curve for the sample to be plotted from the coarsest particle down to the clay size. This involves two types of methods of sieving; wet sieving and dry sieving as stipulated in British Standard BS1377 Part 2 [18]. The other methods such as Sedimentation by the Pipette Method and Sedimentation by the Hydrometer Method shall be used when determining the amounts of particles smaller than 2mm such as fine sand, silt and clay of the soil sample. From this analysis, the percentage of silt, clay and fine sand can be established and to be used to generate group under Soil Structure Code and Soil Permeability Code (Figure 4).
The Organic Matter Determination is a method which will measure the organic content of organic clays, silts and mucks. The method shall be as per ASTM D2974-00 [19], Standard Test Methods for Moisture, Ash and Organic Matter of Peat and Other Organic Soils. The derivation of the organic matter percentage shall be based on Test Method D of the said specification.
Figure 4. Soil structure code and soil permeability code
Computations have been made based on results acquired from laboratory test have yielded valid result similar to the range of the Soil Erodibility Factors (SEF) for soils of the Peninsular Malaysia; where K values are between 0.011 to 0.056. Details on the results are tabulated in Table 3.
The SEF is definitely high at areas close to the beach front including swamps and floodplains with values around 0.017 up to 0.056. Weston soil which is a tidal swamp soil have a relatively high SEF since its content high silt and organic content which yield SEF of 0.045, 0.043 and 0.046. Klias soil on the other hand which is a swamp have slightly lower SEF values as the silt content is lower than Weston soil and hence, generates slightly lower SEF values of 0.039, 0.043 and 0.036. Klias counterpart, the Sapi soil have slightly higher SEF values of 0.033, 0.043 and 0.035 despite of lower organic content due to the higher silt content and relatively low gravel percentage. Tuaran soil populates the surrounding river as meandering belt have lower erodibility potential due to high sand content and it is relatively stable throughout all the strata. The SEF values for Tuaran soil are 0.021, 0.017 and 0.025. Kinabatangan Soil is mainly soil surrounding floodplain have less erodible stratum initially with SEF value of 0.023 due to high sand content and then followed by SEF values of 0.049 for both subsoil and substratum depth.
Labau soil which is predominantly soils at valley floor has SEF values of 0.044 and 0.048 at the subsurface and subsoil strata, except for its substratum or soil exceeded 1.0m depth which has a low value of 0.026 due to increase of sand composition.
Dalit and Lokan soils show slightly different outcome where the subsurface and subsoil have a lower Soil Erodibility factor in comparison to its substratum. Besides Lokan soil, Crocker soil also displayed disparity in the value by the stratum. Lastly, Trusmadi soil has similar inconsistency by the depth like Crocker soil with low erodible stratum at the subsoil strata. Nevertheless, both Crocker and Trusmadi show the extremely low Soil Erodibility Factor compare to the rest of the soils in this particular study.
As for terraces or moderate hills, the value for SEF is within the range of 0.045 up to 0.053 with exception for the first stratum for Kepayan soil and Brantian soil due to increased sand content. Similarly, Dalit soil at moderate hill have low SEF of 0.026 and 0.022 at subsurface and subsoil strata due to high content of sand as well as gravels. Lokan soils also demonstrate that the higher sand content will lower the SEF value where its subsoil stratum has a SEF value of 0.028.
Crocker soil have a very high SEF at the subsurface and very low SEF at subsoil and substratum with values of 0.011 and 0.021 due to low sand content despite high gravel content in comparison to the subsurface stratum. Lastly, Trusmadi soil has similar inconsistency by the depth like Crocker soil with low erodible stratum at the subsoil strata due to high content of gravel despite consistent content of sand. This resulting reading to go from 0.022, 0.014 to 0.021. Nevertheless, both Crocker and Trusmadi show the relatively low SEF compare to the rest of the soils in this particular study.
SEF are quite consistent for most of the soils along the strata; from subsurface, subsoil and substratum except for a few exceptions which showed disparity. This may be the result of aggregate stabilization effects which varies depending on the chemistry and the elements these strata were exposed over time. Due to recent accreting alluvium process, meandering belt soil such as Tuaran soil and floodplain soil such as Kinabatangan soil have very high sand composition at the subsurface stratum and thus leads to very low erodibility factor compare to subsequent strata for both soils.
Table 3. Summary of results and soil erodibility factor based on soil and depth
|
Soil Name |
Depth (m) |
Gravel (%) |
Sand (%) |
Silt (%) |
Clay (%) |
Organic Matter (%) |
Soil Structure Code |
Permeability Class |
Soil Erodibility Factor (K) |
|
1 Weston |
0.0 – 0.5 |
0 |
33 |
66 |
1 |
3.40 |
3 |
3 |
0.045 |
|
0.5 – 1.0 |
0 |
31 |
68 |
1 |
3.80 |
3 |
3 |
0.043 |
|
|
1.0 – 1.5 |
0 |
28 |
72 |
0 |
3.98 |
3 |
3 |
0.046 |
|
|
3 Tanjung Aru |
0.0 – 0.5 |
0 |
50 |
50 |
0 |
1.06 |
2 |
2 |
0.040 |
|
0.5 – 1.0 |
1 |
33 |
66 |
0 |
0.84 |
3 |
3 |
0.055 |
|
|
1.0 – 1.5 |
0 |
39 |
61 |
0 |
1.04 |
3 |
3 |
0.056 |
|
|
4 Tuaran |
0.0 – 0.5 |
1 |
68 |
30 |
1 |
2.04 |
2 |
2 |
0.021 |
|
0.5 – 1.0 |
5 |
49 |
44 |
2 |
1.65 |
2 |
2 |
0.017 |
|
|
1.0 – 1.5 |
1 |
50 |
47 |
2 |
1.72 |
2 |
2 |
0.025 |
|
|
5 Kinabatangan |
0.0 – 0.5 |
1 |
62 |
36 |
1 |
1.80 |
2 |
2 |
0.023 |
|
0.5 – 1.0 |
0 |
48 |
52 |
0 |
1.19 |
3 |
3 |
0.049 |
|
|
1.0 – 1.5 |
0 |
40 |
59 |
1 |
1.91 |
3 |
3 |
0.049 |
|
|
6 Sapi |
0.0 – 0.5 |
4 |
30 |
60 |
6 |
1.82 |
3 |
3 |
0.043 |
|
0.5 – 1.0 |
1 |
22 |
77 |
0 |
1.09 |
3 |
3 |
0.056 |
|
|
1.0 – 1.5 |
1 |
35 |
58 |
6 |
1.41 |
3 |
3 |
0.047 |
|
|
7 Klias |
0.0 – 0.5 |
3 |
46 |
50 |
1 |
3.61 |
3 |
3 |
0.039 |
|
0.5 – 1.0 |
1 |
34 |
64 |
1 |
3.35 |
3 |
3 |
0.043 |
|
|
1.0 – 1.5 |
4 |
43 |
52 |
1 |
2.35 |
3 |
3 |
0.036 |
|
|
10 Labau |
0.0 – 0.5 |
1 |
43 |
54 |
2 |
1.10 |
3 |
3 |
0.044 |
|
0.5 – 1.0 |
2 |
37 |
61 |
0 |
1.73 |
3 |
3 |
0.048 |
|
|
1.0 – 1.5 |
1 |
65 |
34 |
0 |
1.55 |
2 |
2 |
0.026 |
|
|
11 Bingkor |
0.0 – 0.5 |
1 |
34 |
65 |
0 |
2.71 |
3 |
3 |
0.045 |
|
0.5 – 1.0 |
1 |
23 |
73 |
3 |
2.41 |
3 |
3 |
0.047 |
|
|
1.0 – 1.5 |
2 |
28 |
69 |
1 |
2.02 |
3 |
3 |
0.048 |
|
|
12 Brantian |
0.0 – 0.5 |
0 |
60 |
40 |
0 |
1.37 |
2 |
2 |
0.032 |
|
0.5 – 1.0 |
0 |
38 |
61 |
1 |
2.64 |
3 |
3 |
0.047 |
|
|
1.0 – 1.5 |
0 |
41 |
58 |
1 |
2.45 |
3 |
3 |
0.046 |
|
|
13 Kepayan |
0.0 – 0.5 |
1 |
57 |
41 |
1 |
1.90 |
2 |
2 |
0.028 |
|
0.5 – 1.0 |
1 |
42 |
50 |
7 |
1.20 |
3 |
3 |
0.044 |
|
|
1.0 – 1.5 |
1 |
31 |
68 |
0 |
1.26 |
3 |
3 |
0.053 |
|
|
16 Sinarun |
0.0 – 0.5 |
0 |
42 |
56 |
2 |
1.11 |
3 |
3 |
0.049 |
|
0.5 – 1.0 |
0 |
35 |
64 |
1 |
1.84 |
3 |
3 |
0.049 |
|
|
1.0 – 1.5 |
1 |
37 |
61 |
1 |
1.66 |
3 |
3 |
0.048 |
|
|
31 Dalit |
0.0 – 0.5 |
2 |
58 |
40 |
0 |
1.03 |
2 |
2 |
0.026 |
|
0.5 – 1.0 |
4 |
57 |
39 |
0 |
1.53 |
2 |
2 |
0.022 |
|
|
1.0 – 1.5 |
2 |
47 |
50 |
1 |
1.33 |
3 |
3 |
0.040 |
|
|
39 Lokan |
0.0 – 0.5 |
1 |
39 |
59 |
1 |
1.27 |
3 |
3 |
0.046 |
|
0.5 – 1.0 |
1 |
55 |
43 |
1 |
1.14 |
2 |
2 |
0.028 |
|
|
1.0 – 1.5 |
1 |
44 |
55 |
0 |
1.20 |
3 |
3 |
0.051 |
|
|
47 Crocker |
0.0 – 0.5 |
6 |
47 |
45 |
2 |
1.58 |
3 |
3 |
0.040 |
|
0.5 – 1.0 |
6 |
72 |
22 |
0 |
1.71 |
1 |
2 |
0.011 |
|
|
1.0 – 1.5 |
3 |
56 |
40 |
1 |
1.43 |
2 |
2 |
0.021 |
|
|
50 Trusmadi |
0.0 – 0.5 |
0 |
54 |
45 |
1 |
2.05 |
2 |
2 |
0.022 |
|
0.5 – 1.0 |
6 |
54 |
39 |
1 |
1.57 |
2 |
2 |
0.014 |
|
|
1.0 – 1.5 |
3 |
56 |
40 |
1 |
1.43 |
2 |
2 |
0.021 |
Soil Erodibility Factor (SEF) is very much depending on the sand and clay content and it is independent from topography of the location. For higher elevation landform such as mountains, the usual SEF value is relatively low due to residual soil. All of the SEF values are highly dependent of the sand and silt composition as well as the soil texture after conducting Soil Particle Distribution test. Slight changes in sand percentage will eventually change the Soil Texture group and subsequently change the Permeability code and Soil Structure code which will significantly amplify or reduce the SEF value generated from the Tew Equation.
Sincere gratitude to Universiti Malaysia Sabah (UMS) for providing grant for easy access to laboratories and research equipment. Highest appreciations also to the research grants award (SDK0012-2017 and SDK0130-2020) to finance all the costs of this research.
[1] Azman, A.B. (2017). ESC Manual for Sabah and Sarawak. Kuala Terengganu, Terengganu. 18-20 September 2017. Organized by Malaysian Stormwater Organization. http://msowater.org.my/.
[2] Tongkul, F., Benedick, H., Chang, F.K. (2006). Geology of slopes in the Crocker range, Sabah, Malaysia. Nepal Geological Society, 34: 73-80. https://doi.org/10.3126/jngs.v34i0.31881
[3] Sharir, K., Roslee, R., Ern, L.K., Simon, N. (2017). Landslide factors and susceptibility mapping on natural and artificial slopes in Kundasang, Sabah. Sains Malaysiana, 46(9): 1531-1540. http://dx.doi.org/10.17576/jsm-2017-4609-23
[4] Simon, N., Crozier, M., de Roiste, M., Rafek, A.G., Roslee, R. (2015). Time series assessment on landslide occurrencs in an area undergoing development. Singapore Journal of Tropical Geography (SJTG), 36: 98-111. https://doi.org/10.1111/sjtg.12096
[5] Roslee, R., Jamaludin, T.A., Simon, N. (2017). Landslide Vulnerability Assessment (LVAs): A case study from Kota Kinabalu, Sabah, Malaysia. Indonesian Journal on Geoscience, 4(1): 49-59. https://doi.org/10.17014/IJOG.4.1.49-59
[6] Sharir, K., Simon, N., Roslee, R. (2016). Regional assessment on the influence of land use related factor on landslide occurencces in Kundasang, Sabah. AIP Conference Proceedings, 1784: 060015(1)- 060015(5). https://doi.org/10.1063/1.4966853
[7] Roslee, R., Jamaludin, T.A. (2012). Kemudahterancaman bencana gelinciran tanah (LHV): Sorotan literatur dan cadangan pendekatan baru untuk pengurusan risiko gelinciran tanah di Malaysia (Landslide Hazard Vulnerability (LHV): Literature review and proposed new approaches for landslide risk management in Malaysia). Bull. Geol. Soc. Malaysia, 58: 75-88. https://doi.org/10.7186/bgsm58201212
[8] Guideline for Erosion and Sediment Control in Malaysia. Department of Irrigation and Drainage (DID). (2010). https://www.water.gov.my/jps/resources/auto%20download%20images/5844dff6dadd8.pdf.
[9] Guidelines for Prevention and Control of Soil Erosion and Siltation in Malaysia. Department of Environment, Malaysia. (1996). https://books.google.com.my/books/about/Guidelines_for_Prevention_and_Control_of.html?id=zIYdAQAAMAAJ&redir_esc=y.
[10] Roslee, R., Bidin, K., Musta, B., Tahir, S. (2017). Intergration of GIS in estimation of soil erosion rate at kota kinabalu area, Sabah, Malaysia. Adv. Sci. Lett., 23(2): 1352-1356. https://doi.org/10.1166/asl.2017.8400
[11] Roslee, R., Sharir, K. (2019). Integration of GIS-based RUSLE model for land planning and environmental management in Ranau Area, Sabah, Malaysia. ASM Sc. J., 12(3): 60-69. https://www.akademisains.gov.my/asmsj/article/integration-of-gis-based-rusle-model-for-land-planning-and-environmental-management-in-ranau-area-sabah-malaysia/.
[12] Roslee, R., Sharir, K. (2019). Soil erosion analysis using RUSLE model at the minitod area, Penampang, Sabah, Malaysia. Journal of Physics: Conference Series, 1358: 012066. https://iopscience.iop.org/article/10.1088/1742-6596/1358/1/012066.
[13] Acres, B.D., Bower, R.P., Burrough, P.A., Folland, C.K., Kalsi, M.S., Thomas, P., Wright, P.S. (1975). The Soils of Sabah, Volume 5. Reference and Appendixes. England: Land Resource Division, Ministry of Overseas Development. https://edepot.wur.nl/479776.
[14] British Government’s Overseas Development Administration (Land Resources Division). (1974). The Soils of Sabah: Soils Sheet NB50-6 (Tuaran). https://esdac.jrc.ec.europa.eu/content/tuaran-soils-sabah-sheet-nb-50-6-dos-3180b.
[15] British Government’s Overseas Development Administration (Land Resources Division). (1974). The Soils of Sabah: Soils Sheet NB50-7 (Sugut). https://esdac.jrc.ec.europa.eu/content/sugut-soils-sabah-sheet-nb-50-7-dos-3180c.
[16] British Government’s Overseas Development Administration (Land Resources Division). (1974). The Soils of Sabah: Soils Sheet NB50-9 (Labuan). https://esdac.jrc.ec.europa.eu/content/labuan-soils-sabah-sheet-nb-50-9-dos-3180d.
[17] British Government’s Overseas Development Administration (Land Resources Division). (1974). The Soils of Sabah: Soils Sheet NB50-10 (Kota Kinabalu). https://esdac.jrc.ec.europa.eu/content/kota-kinabalu-soils-sabah-sheet-nb-50-10-dos-3180e.
[18] British Standards Institution. (1990). Methods of Test for Soils for Civil Engineering Purposes – Part 2: Classification Tests (BS1377-2). https://989me.vn/en/download/Other-Items/BS-1377-2-1990-Methods-of-test-for-Soils-for-civil-engineering-purposes-Part-2-Classification-tests.html.
[19] ASTM International. (2000). Standard Test Methods for Moisture, Ash and Organic Matter of Peat and Other Organic Soils (D2974-00). https://www.astm.org/Standards/D2974.