Muhamad Husni Idris* | Sitti Latifah | Budhy Setiawan | Irwan Mahakam Lesmono Aji | Diah Permata Sari
© 2021 IIETA. This article is published by IIETA and is licensed under the CC BY 4.0 license (http://creativecommons.org/licenses/by/4.0/).
OPEN ACCESS
The condition of community-managed forest areas varies according to biophysics characteristics and management activities. This study aims to investigate the condition of vegetation and soil carbon stocks of various types of forest management by the community in Karang Sidemen Village, Lombok, Indonesia. In the study area, it was found 4 types of landuse management, namely; dense forest-like vegetation (Tp1), moderate vegetation with intensive (Tp2) and less intensive (Tp3) under-stand cultivation, and sparse vegetation resembling dryland agriculture (Tp4). Vegetation condition was analyzed based on satellite derived NDVI index and field observation. Sentinel satellite images for 2015 and 2019, with a resolution of 10x10 m was used. Field data collection was carried out in August 2019. It was made 5 sample plots of 20x20 m for each management type. Vegetation data with diameter (D) ≥ 20 cm, 10 cm ≤D< 20 cm, 2 cm ≤D< 10 cm and D< 2 cm were collected from plots of 20x20 m, subplots 10x10 m, 5x5 m and 2x2 m, respectively. Soil samples were taken diagonally on a 20x20 m plot, at a depth of 0-5 cm, 5-10 cm, 10-20 cm and 20-30 cm. The results showed that the NDVI derived vegetation index for 2015 and 2019 images showed different patterns for the four types of management. The number of species for Tp1, Tp2, Tp3 and Tp4 were 9, 15, 9 and 8 species, respectively. The dominant species are generally from groups of plants providing economic benefits such as avocado (Persea americana), candlenut (Aleurites moluccana), cocoa (Theobroma cacao), coffee (Coffea canephora), jackfruit (Artocarpus heterophyllus), mangosteen (Garcinia mangostana) and guava (Psidium guajava). Soil carbon stocks of the four types of management at a depth of 0-5 cm, 5-10 cm, 10-20 cm and 20-30 cm were18.61-21.04 tons C/ha, 16.56-20.80 tons C/ha, 29.66-34.48 tons C/ha and 27.54 - 33.66 tons C/ha, respectively. The soil carbon stock of denser vegetation is higher than that of medium and sparse vegetation. Therefore, forest management with the community needs to maintain forest-like vegetation.
agroforestry, protected forest, carbon stock, land cover
Forests have an important role in mitigating climate change, partly because of their ability to absorb carbon in the atmosphere and store it in biomass above and below the soil surface [1]. Changes in the structure and composition of forest vegetation naturally or as a result of human activities may change the above and below surface biomass productivity, and finally changes in carbon stocks [2, 3]. In general, conversion of natural forests to agroforestry and agricultural systems lead to a decrease in carbon stocks [4-6], and conversely, changes from agriculture to agroforestry and to forest systems increase carbon stocks [7].
Forest carbon stocks are in the form of live standing biomass carbon, dead biomass and soil carbon. Of these three forms of carbon stocks, soil carbon stocks are unique since soil carbon in addition to playing an important role in the carbon cycle is also important in maintaining soil productivity and ecosystem services [8, 9]. Changes in land cover from forest to non-forest have a direct impact on the decrease in standing biomass and above-ground carbon stocks, while soil carbon stocks change take a longer period of time [10, 11]. Soil carbon come from above the surface through litter decomposition and from below the surface through dead and decaying roots [12-14]. Soil carbon decrease through respiration of soil organisms, decomposition and leaching with groundwater [15-17].
The qualitative and quantitative characteristics of forest soils from the carbon aspect is influenced by a complex interaction of climatic factors, soil type, species and management [2, 18, 19]. Conversion of primary forest to cocoa, coconut and rubber plantations can reduce soil carbon content by 60%, 55% and 35%, respectively [20]. Soil carbon concentrations were also found to decrease drastically after limited logging [10]. Cultivation by clearing forest land leads to a decrease in soil organic carbon content [21]. Changes in management systems from natural forests to agroforestry systems result in a decrease in soil organic carbon stocks [22, 23], whereas changes from agricultural systems to agroforestry and afforestation result in an increase in soil organic carbon stocks [22, 24]. The application of agroforestry systems for 10-20 years is more effective in improving soil organic carbon stocks compared to agroforestry for <10 years [23]. These data and facts show that differences in species composition and age of stands that occur naturally or as a result of different management affect soil carbon stocks [18, 19].
The carbon stocks of forest areas managed by communities continue to attract attention due to variations in forest area management practices as a consequence of various factors. Cedamon et al. [25] showed that in general, the community who manages the area chooses a silviculture that has been determined, can be done according to capacity and produces a variety of forest products. Sabastian et al. [26] showed that decision making for the adoption of timber and non-timber forest management practices is influenced by extension factors, facilitation of farmer groups, knowledge of regulations and species selection, land area and farmer income levels from on and off farm. The variation in forest area management practices by these communities has the potential to produce differences in terms of vegetation structure, vegetation diversity and carbon stocks. In addition, variations in local characteristic factors such as climate and soil properties also play an important role in determining soil carbon [27-29].
Concerning forest management, Markum et al. [5] has researched carbon stocks, including soil carbon, in various land-use systems such as simple agroforestry, mahogany agroforestry, candlenut agroforestry, and multi strata agroforestry. However, this study does not emphasize the density level of coverage, while the coverage factor also determines the carbon stock. Therefore, soil carbon research in community-managed forest areas by considering coverage and land management practices is required.
This study aims to investigate the vegetation and soil carbon stock under different types of forest management in community-managed protected forest areas in Karang Sidemen Village, Lombok, Indonesia. This paper will argue that in order to conserve forest soil carbon, community involved in forest management should maintain forest like-cover in their managed area. This paper consisted of four main sections including introduction, method, results and discussion, and conclusion.
2.1 Research site description
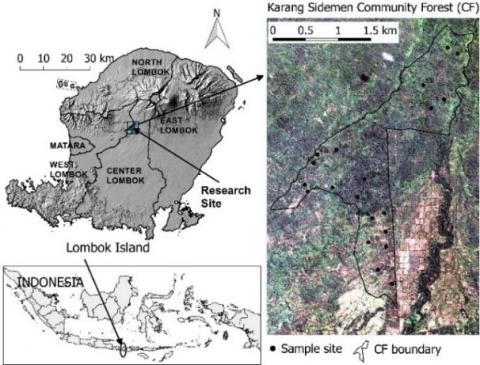
The research was carried out in the Karang Sidemen Community Forest (CF), in the Karang Sidemen Village, Batukliang Utara Subdistrict, Lombok, Indonesia (Figure 1). Field data collection was carried out in August 2019.
The research site based on the elevation data of National Digital Elevation Model (DEMNAS) from the Indonesian Geospatial Information Agency ranges from 487-738 m above sea level (https://tanahair.indonesia.go.id/demnas/#/). According to the Schmidt Ferguson climate classification, study area has been group to type C with a Q value ranging from 0.33 -0.60. Q value represents the ratio of the number of dry months (rainfall < 60 mm/month) and wet months (rainfall > 100 mm/month) [30]. Annual rainfall is shown by nearest rainfall station (Lingkok lime station) to study site is 2469 mm/year [31].
Figure 1. Research site
2.2 Sample plots and data collection
The sample plots were placed purposively by considering land management. The type of land management was determined through a visual analysis of the appearance of the land cover on high-resolution image (google earth images) and direct observation in the field. In the research site, it was found 4 groups of management types, ranging from forest-like management with dense vegetation to the dominant agricultural land management type of seasonal crops as shown in Table 1.
In this study, 20 sample plots were made, which is 5 sample plots for each type of land management. The sample plot size is based on the Indonesian National Standard (SNI 7724:2011) [32] which is a plot of 20x20 m with a subplot of 10x10 m, a subplot of 5x5 m and a subplot of 2x2 m, for the collection of vegetation with diameter of (D)≥ 20 cm, 10 cm ≤D< 20 cm, 2 cm ≤D< 10 cm, and D< 2 cm, respectively. Soil samples for analysis of soil carbon and soil bulk density were taken diagonally on the 20x20 m plot, at a depth of 0-5 cm and 5-10 cm, 10-20 cm, and 20-30 cm.
2.3 Analysis of vegetation based on satellite imagery derived vegetation index
The performance of each type of land management in the sample plots for a period of 5 years was analyzed using the Normalized Difference Vegetation Index (NDVI) vegetation index derived from sentinel satellite imagery with a resolution of 10x10 m. Image data were obtained from the website (https://eartheexplorer.usgs.gov/). NDVI is one of the vegetation indices that can be used for analysis of vegetation change [33, 34]. NDVI is a vegetation index calculated from red (R) and near infra-red (NIR) reflectance using formula (NIR-R)/(NIR+R) [35]. On sentinel satellite, R dan NIR is in band 4 dan band 8, respectively [36]. NDVI value vary from -1 to 1 where high NDVI values indicate a dense vegetation, and low NDVI value indicate less vegetation or bare soil [37].
Table 1. Four group of forest management types
|
No |
Type |
Description |
|
1 |
Tp1 |
Dense vegetation resembling forest (vegetation with diameter 20cm >150/ha) |
|
2 |
Tp2 |
Medium vegetation with intensive under-stand utilization (vegetation with diameter 20 cm < 100/ha) |
|
3 |
Tp3 |
Medium vegetation with less intensive under-stand utilization (vegetation with diameter 20 cm < 100/ha) |
|
4 |
Tp4 |
Sparse vegetation resembling dryland agriculture (vegetation with diameter 20 cm < 60/ha) |
2.4 Analysis of vegetation diversity and soil carbon
Parameters of vegetation diversity analyzed included species, density and Important Value Index (IVI) [38, 39]. IVI values for diameter (D) 20≥ cm, 10 cm≤ D< 20 cm, 2 cm≤ D< 10 cm were determined from the combined values of relative density, relative frequency, and relative dominance of a species. The IVI value for vegetation with D < 2 cm was obtained from the combined value of relative density and relative frequency. The relative density value is the percentage of the number of a species to the total species found in the observation plot. The relative frequency value is the percentage of the number of plots where a species is found to the total plot of observations. The relative dominance value is the percentage of the base area of a species to the total area of the base area in the observation plot. An example of IVI analysis procedures can be seen in many resources such as in [40].
Soil carbon content of soil samples taken from sample plots was determined through laboratory analysis using the Walkey and Black standard with colorimetric method [41, 42]. Soil carbon stock was calculated as follows Ct =%C.r.d, where Ct is carbon stock (g/cm2), r is soil bulk density (g/cm3), C is soil carbon, and d is soil depth (cm) [32].
3.1 Vegetation performance based on satellite imagery vegetation index
The vegetation condition of the sample plot of 20x20 m based on the NDVI value from the Sentinel satellite images with a resolution of 10x10m is as shown in Figure 2. In general, the NDVI for the four land management types in July has a higher value than the NDVI value in September and October. The NDVI value can be used as an indicator of the greenness of vegetation [43]. In the study area, July is the end of rainy season or the beginning of dry season, where soil water content still relatively high which affects the greenness of the vegetation. The ground cover plant still has enough water to keep it looking green. On the other hand, in October which is the end of the dry season or before the start of the rainy season, some of the vegetation adapts to the reduction in the availability of water in the soil. Cover crops partially or even completely dry up depending on the level of soil water availability. Tree vegetation also adjusts its physiological activity. Limited soil water content may cause tree vegetation to accelerate the aging process of leaves and drop leaves, so that, they look drier than that of in the conditions with sufficient soil water supplies. Zhang et al. [44] showed that the tropical forest areas of Southeast Asia have a maximum NDVI value at the end of the rainy season and this NDVI value continues to decline during the dry season.
From Figure 2, it can be explained that the NDVI values in the four land management types have different characteristics. In the Tp1 management type, the NDVI values in the July-September and October 2019 were not too different. The difference in July and October NDVI values for Tp1 management was very contrast compared to that for Tp2 and Tp4 management types. The difference NDVI-July and NDVI-October in both management types (Tp2 and Tp4) was higher than that in the Tp1 management type. The condition of the land that is more open with less tree vegetation or a larger portion of space for seasonal crops causes the large difference for NDVI-July and NDVI-October. Zaitunah et al. [35] showed that the NDVI of primary dry forest is higher than that of secondary dry forest. NDVI has a value from -1 to 1, a negative NDVI value indicates open land while positive NDVI value represents vegetated land [37].
Figure 2. Vegetation condition based on NDVI at the plot of 20x20 m
The land management in community forest in study area in the previous 4-5 years can be seen by comparing the NDVI values in October 2015 and October 2019. From these data, it can be explained that the NDVI October 2015 and NDVI October 2019 for each type of land management are almost the same. This indicates that land management from 2015 to 2019 has similarities. Based on interviews with landowners, such management patterns have been happening for decades, however, satellite data with a resolution of 10 x 10 m is available only from 2015. Satellite images with a lower resolution of 30x30m, such as Landsat images, are relatively available but are not considered for the reason that land ownership is relatively narrow and land management varies between land managers. Erinjery et al. [36] showed that high spectral and spatial resolution are the advantages of Sentinel imagery in tropical rain forest monitoring.
3.2 Analysis of vegetation based on sample plot
The number of species found in all types of land management is 20 species. The number of species for Tp1, Tp2, Tp3 and Tp4 management type were 9, 15, 9 and 8 species, respectively (Table 2). From the total of 20 species, three species were found in the four management type, namely jackfruit (Artocarpus heterophyllus), avocado (Persea americana) and coffee (Coffea canephora), four species, namely durian (Durio zibethinus), rambutan (Nephelium lappaceum), candlenut (Aleurites moluccana) and Ceiba pentandra were found in three management type, and four other species, namely cocoa (Theobroma cacao), longan (Dimocarpus longan), Dalbergia latifolia and Erythrina variegata were found in two management type. The species found in only one management type were 9 species, namely mango (Mangifera indica), Gnetum gnemon, Leucaena leucocephala, banana (Musa paradisiaca), guava (Psidium guajava), white teak (Gmelina arborea), Baccaurea dulcis, Gliricidia sepium and mangosteen (Garcinia mangostana). Vegetation found in more than two forest management types have high economic value including fruit-producing plant, thus, the community tend to plant these species of vegetation. This is because in protected area, harvesting of wood is prohibited, also, this is the reason why timber product is lacking in the community-managed protected forest area. However, there is a woody species plant (such as Ceiba pentandra) that has low economic value, but function as a shade for understory vegetation.
Table 2. Species of vegetation found at sample plots
|
No |
species |
Tp1 |
Tp2 |
Tp3 |
Tp4 |
|
1 |
Artocarpus heterophyllus |
v |
v |
v |
v |
|
2 |
Persea americana |
v |
v |
v |
v |
|
3 |
Coffea canephora |
v |
v |
v |
v |
|
4 |
Durio zibethinus |
v |
v |
v |
- |
|
5 |
Nephelium lappaceum |
v |
v |
v |
- |
|
6 |
Aleurites moluccana |
v |
v |
- |
v |
|
7 |
Ceiba pentandra |
v |
v |
- |
v |
|
8 |
Theobroma cacao |
v |
v |
- |
- |
|
9 |
Dimocarpus longan |
- |
v |
v |
- |
|
10 |
Dalbergia latifolia |
- |
v |
- |
v |
|
11 |
Eryhtrina variegata |
v |
- |
- |
v |
|
12 |
Mangifera indica |
- |
v |
- |
- |
|
13 |
Gnetum gnemon |
- |
v |
- |
- |
|
14 |
Leucaena leucocephala |
- |
v |
|
|
|
15 |
Musa paradisiaca |
- |
v |
- |
- |
|
16 |
Psidium guajava |
- |
v |
- |
- |
|
17 |
Gmelina arborea |
- |
- |
v |
- |
|
18 |
Baccaurea dulcis |
- |
- |
v |
- |
|
19 |
Gliricidia sepium |
- |
- |
v |
- |
|
20 |
Garcinia mangostana |
- |
- |
- |
v |
|
|
|
9 |
15 |
9 |
8 |
It can also be explained from Table 2 that the 20 species found in the research site are consisted of 11 species of multipurpose plants species (Artocarpus heterophyllus, Persea americana, Durio zibethinus, Nephelium lappaceum, Aleurites moluccana, Dimocarpus longan, Mangifera indica, Gnetum gnemon, Psidium guajava, Baccaurea dulcis and Garcinia mangostana), 6 species of forest tress (Ceiba pentandra, Dalbergia latifolia, Erythrina variegata, Leucaena leucocephala, Gmelina arborea and Gliricidia sepium), 2 species of shrubs (Coffea canephora and Theobroma cacao) and 1 species of herb (Musa paradisiaca). Based on these data, about 70% of species belong to the group of multipurpose trees, shrubs and herbs, and the rest of 30% is of forest trees species. The condition of vegetation with a larger proportion of multipurpose trees and shrubs compared to forest trees has become a common feature of community-managed forest areas. Idris et al. [45] also found the dominance of multipurpose trees and shrubs in protected forest areas managed by the community in the Aikbual community forest which is also in Lombok Island. This has also become a common characteristic of community-managed protected forest areas, which prioritize species that produce any economic product as a source of family income [5].
The number of species for each management type and vegetation diameter group are presented in Table 3. For all management type, the number of species with diameter (D): D≥20 cm, 10 cm≤D<20 cm, 2 cm ≤D<10 cm and D<2 cm is 13, 9, 6 and 6 species, respectively. Based on the management type, the number of species in vegetation with D ≥ 20 cm is 4-10 species, 10 cm≤ D<20 cm is 1-6 species, 2 cm≤ D<10 cm is 1-4 species, and D<2 cm is 1-4 species. The number of species found in Tp2 was relatively higher than that of the other three management types. The Tp2 management type is relatively more intensive than the other three management types. In general, the number of species found in D ≥ 20 cm was higher than that of in the 10 cm ≤D<20 cm, 2 cm≤ D<10 cm and D<2 cm. Less number of species at D<2 cm and 2 cm≤ D<10 cm indicates the number of species tend to decrease in the future. This needs to pay attention of the parties to anticipate so that the diversity of vegetation can be maintained. The number of species found in the study site was lower than that of reported by Markum et al. [5] that the number of species with D > 5 cm in multistrata agroforestry systems and primary forest in the Jangkok Watershed in Lombok Island were 18 species and 38 species, respectively.
Vegetation density for each diameter group and land management type is presented in Table 4. For vegetation D≥20 cm, the highest density of 170 trees/ha was found in the management type Tp1, while the lowest density of 55 trees/ha was found Tp4. Vegetation density for 10 cm ≤D<20 cm ranged from 20 trees/ha found in the Tp4 to 280 trees/ha in the Tp3. Contrast difference in vegetation density was observed in vegetation with D<2 cm, which ranged from 500 seedlings/ha in the Tp4 to 16,500 seedlings in the Tp1. This fact indicates that different land management produce different levels of vegetation density. The vegetation density of community-managed forest areas, especially on the island of Lombok, has become an important concern because it is one of the references in payment for carbon environmental services. Sukardi et al. [46] reported that Aikbual community forest farmers in Lombok Island participated in the development of the Plan Vivo scheme of environmental services by adding 290 multipurpose and forestry crops per ha so that the tree population in the managed land was 400 trees per ha.
Table 3. Number of species in each management type
|
No |
Management type |
D≥20 cm |
10 cm ≤ D< 20 cm |
2 cm ≤ D< 10 cm |
D<2 cm |
|
1 |
Tp1 |
6 |
4 |
3 |
2 |
|
2 |
Tp2 |
8 |
6 |
4 |
4 |
|
3 |
Tp3 |
4 |
4 |
2 |
2 |
|
4 |
Tp4 |
5 |
1 |
2 |
1 |
|
5 |
All |
13 |
9 |
6 |
6 |
Table 4. Stand density for each management type (per ha)
|
No |
Management type |
D≥20 cm |
10 cm≤ D<20 cm |
2 cm≤ D<10 cm |
D<2 cm |
|
1 |
Tp1 |
170 |
160 |
640 |
16500 |
|
2 |
Tp2 |
100 |
180 |
720 |
3000 |
|
3 |
Tp3 |
80 |
280 |
160 |
1000 |
|
4 |
Tp4 |
55 |
20 |
160 |
500 |
|
5 |
All |
101 |
160 |
320 |
5250 |
Table 5. Basal area of vegetation for each management type (m2 per ha)
|
No |
Management type |
D≥20 cm |
10 cm ≤ D<20 cm |
2 cm≤ D<10 cm |
|
1 |
Tp1 |
32.05 |
2.94 |
2.05 |
|
2 |
Tp2 |
10.06 |
2.94 |
3.40 |
|
3 |
Tp3 |
5.58 |
4.70 |
0.62 |
|
4 |
Tp4 |
5.84 |
0.16 |
0.61 |
|
5 |
All |
13.38 |
2.68 |
1.11 |
Table 6. Important Value Index (IVI) for each management type
|
No |
D≥20 cm |
10 cm≤D<20 cm |
2 cm≤D<10 cm |
D<2 cm |
||||
|
Species |
IVI |
Species |
IVI |
Species |
IVI |
Species |
IVI |
|
|
Tp1 |
|
|
|
|
|
|
|
|
|
1 |
Erythrina variega |
136.3 |
Theobroma cacao |
123.6 |
Coffea canephora |
199.0 |
Coffea canephora |
177.0 |
|
2 |
Durio zibethinus |
62.8 |
Durio zibethinus |
75.7 |
Persea americana |
52.5 |
Artocarpus heterophyllus |
23.0 |
|
3 |
Artocarpus heterophyllus |
43.2 |
Erythrina variegata |
51.2 |
Durio zibethinus |
48.5 |
- |
- |
|
4 |
Aleurites moluccana |
24.6 |
Nephelium lappaceum |
49.5 |
- |
- |
- |
- |
|
5 |
Ceiba pentandra |
21.9 |
- |
- |
- |
- |
- |
- |
|
6 |
Theobroma cacao |
11.1 |
- |
- |
- |
- |
- |
- |
|
|
Total |
300.0 |
Total |
300.0 |
Total |
300.0 |
Total |
200.0 |
|
Tp2 |
||||||||
|
1 |
Artocarpus heterophyllus |
108.3 |
Theobroma cacao |
84.1 |
Musa paradisiaca |
161.73 |
Psidium guajava |
58.3 |
|
2 |
Ceiba pentandra |
52.4 |
Durio zibethinus |
80.2 |
Theobroma cacao |
60.34 |
Leucaena leucocephala |
58.3 |
|
3 |
Aleurites moluccana |
35.5 |
Dimocarpus longan |
42.9 |
Durio zibethinus |
40.17 |
Durio zibethinus |
41.7 |
|
4 |
Dalbergia latifolia |
26.1 |
Gnetum gnemon |
32.6 |
Coffea canephora |
37.77 |
Coffea canephora |
41.7 |
|
5 |
Durio zibethinus |
22.4 |
Persea americana |
30.1 |
- |
- |
- |
- |
|
6 |
Gnetum gnemon |
18.9 |
Leucaena leucocephala |
30.1 |
- |
- |
- |
- |
|
7 |
Nephelium lappaceum |
18.6 |
- |
- |
- |
- |
- |
- |
|
8 |
Mangifera indica |
17.8 |
- |
- |
- |
- |
- |
- |
|
|
Total |
300.0 |
Total |
300.0 |
Total |
300.0 |
Total |
200 |
|
Tp3 |
||||||||
|
1 |
Persea americana |
117.0 |
Persea americana |
184.0 |
Persea americana |
150.0 |
Persea americana |
100.0 |
|
2 |
Artocarpus heterophyllus |
97.1 |
Durio zibethinus |
66.3 |
Gliricidia sepium |
150.0 |
Coffea canephora |
100.0 |
|
3 |
Gmelina arborea |
60.8 |
Dimocarpus longan |
25.3 |
- |
- |
- |
- |
|
4 |
Baccaurea dulcis |
25.1 |
Nephelium lappaceum |
24.4 |
- |
- |
- |
- |
|
|
Total |
300.0 |
Total |
300.0 |
Total |
300.0 |
Total |
200.0 |
|
Tp4 |
||||||||
|
1 |
Aleurites moluccana |
100.3 |
Garcinia mangostana |
300.0 |
Persea americana |
150.0 |
Coffea canephora |
200.0 |
|
2 |
Dalbergia latifolia |
71.7 |
- |
- |
Garcinia mangostana |
150.0 |
- |
- |
|
3 |
Artocarpus heterophyllus |
59.6 |
- |
- |
- |
- |
- |
- |
|
4 |
Ceiba pentandra |
37.1 |
- |
- |
- |
- |
- |
- |
|
5 |
Erythrina variegata |
31.3 |
- |
- |
- |
- |
- |
- |
|
|
Total |
300.0 |
Total |
300.0 |
Total |
300.0 |
Total |
200.0 |
The basal area of the stand at the study site is presented in Table 5. From the table it is clear that for D≥20 cm, the basal area of Tp1 is the highest followed by Tp2 and Tp3. The basal area is a very influential factor for the calculation of carbon stocks above ground surface [5]. Basal area can be an indicator of soil organic matter input so that it plays an important role in determining soil carbon content [29].
Species based on the analysis of the Important Value Index (IVI) for vegetation D≥20 cm, 10 cm ≤D< 20 cm, 2 cm ≤D<10 cm and D<2 cm at the study site are presented in Table 6. Based on the data in the table the species with highest IVI for management type of Tp1, Tp2, Tp3 and Tp4 were: Erythrina variegata, Artocarpus heterophyllus, Persea americana and Aleurites moluccana, respectively for D≥20 cm; Theobroma cacao, Theobroma cacao, Persea americana and Garcinia mangostana, respectively for the 10 cm≤ D< 20 cm; Coffea canephora, Musa paradisiaca, Persea americana, Persea americana, respectively for 2 cm≤ D< 10 cm; and Coffea canephora, Psidium guajava, Persea americana, Coffea canephora, respectively for D< 2 cm. This IVI shows that the important species except for Erythrina variegata are all included in the multipurpose and shrub group. This fact also has been reported by Markum et al. [5] that Theobroma cacao, Musa paradisiaca, Coffea canephora, Nephelium lappaceum and Lansium domesticum are the important species on community-based forest land managed with an agroforestry system.
3.3 Soil carbon content and carbon stock
The average soil carbon content of the four management types ranged from: 5.26-6.81% for a depth of 0-5 cm; 4.94 - 6.55% for a depth of 5-10 cm, 4.35-5.93% for a depth of 10-20 cm; and 4.01-5.68% for a depth of 20-30cm (Table 7). In general, Tp1 with denser vegetation tends to have higher soil carbon content than that of Tp4 which resembles dryland agriculture. The Tp2 dan Tp4 with more intensive in soil cultivation has lower soil organic matter content than that of Tp1 and Tp3 with less intensive in soil cultivation. Berihu et al. [47] showed the level of soil organic carbon due to differences in vegetation and management, from highest to lowest was dense vegetation, open forests, grasslands and agricultural land. Hairiah et al. [48] reported that soil carbon content in a layer of 0-30 cm on land with dominant seasonal crops, simple agroforestry, and complex agroforestry has lower 40%, 27.5% and 14%, respectively, compared to natural forest soils.
Soil carbon stocks for a certain depth and management types on average ranged from: 18.61-21.04 tons C/ha for a depth of 0-5cm, 16.56-20.80 tons C/ha for depths of 5-10 cm, 29.66-34.48 tons C/ha for depths of 10-20 cm, 27.54-33.66 tons C/ha for depths 20-30cm (Table 8). Similar to soil carbon content, Tp1 with denser vegetation tends to have higher soil carbon stock than that of Tp4 with dry land agriculture. Land with more intensive soil cultivation (Tp2 and Tp4) tend to have lower soil carbon stocks than that of less intensively soil cultivation (Tp1 and Tp3). Chatterjee et al. [23] showed that changes from forest to agroforestry, and from agroforestry to agricultural systems have an impact on decreasing soil carbon stocks. Activities in forest management can affect soil carbon stocks. For example, the removal of biomass from land for feed and fuel, including land preparation that destroys the soil, has an impact on decreasing soil carbon stocks [19]. Pinheiro et al. [49] showed that soil carbon stocks in the top soil 0-10 cm after 6 years of cultivation were higher than conventionally cultivated land.
Soil carbon in the study area showed that soil carbon stocks tend to decrease with increasing soil depth (Table 7 and Table 8). The condition of soil carbon content that decreases with soil depth is similar to that presented by Liu et al. [18] that soil carbon in the 0-10 cm layer is higher than 10-20 cm and 20-30 cm. Monroe et al. [50] reported that ±37.5%, ±21% and ±16.5% of soil carbon stocks at 0-100 cm was found in the layers of 0-20 cm, 20-40 cm and 49-60 cm, respectively. Soil carbon comes from litter at the soil surface so that it is understandable if soil carbon accumulates higher in the upper than in the deeper layers. The carbon content in the deeper layers comes from weathering of plant roots whose supply rate is lower than the weathering of litter on the soil surface. Angst et al. [12] showed that the main source of soil carbon comes from local plant roots.
Table 7. Soil organic C content for each management type
|
No |
Management type |
Soil depth |
|||
|
0-5 cm |
5-10 cm |
10-20 cm |
20-30 cm |
||
|
1 |
Tp1- average (%) |
6.81 |
6.55 |
5.87 |
5.68 |
|
|
- deviation (%) |
0.33 |
0.45 |
0.67 |
0.52 |
|
2 |
Tp2- average (%) |
6.00 |
5.42 |
4.77 |
4.00 |
|
|
- deviation (%) |
0.69 |
0.91 |
0.67 |
0.54 |
|
3 |
Tp3- average (%) |
6.49 |
6.29 |
5.93 |
5.67 |
|
|
- deviation (%) |
0.20 |
0.35 |
0.62 |
0.45 |
|
4 |
Tp4- average (%) |
5.26 |
4.94 |
4.35 |
4.01 |
|
|
- deviation (%) |
0.71 |
0.70 |
0.46 |
0.70 |
Table 8. Soil carbon stocks for each management type
|
No |
Management type |
Soil depth |
|||
|
0-5 cm |
5-10 cm |
10-20 cm |
20-30 cm |
||
|
1 |
Tp1 - average (ton C/ha) |
20.38 |
20.8 |
34.48 |
33.66 |
|
|
- deviation (ton C/ha) |
3.26 |
3.22 |
4.31 |
3.39 |
|
2 |
Tp2 - average (ton C/ha) |
21.04 |
20.33 |
33.85 |
29.35 |
|
|
- deviation (ton C/ha) |
3.29 |
4.77 |
8.20 |
3.27 |
|
3 |
Tp3 - average (ton C/ha) |
18.70 |
17.05 |
33.82 |
33.45 |
|
|
- deviation (ton C/ha) |
2.16 |
1.38 |
4.20 |
4.00 |
|
4 |
Tp4 - average (ton C/ha) |
18.61 |
16.56 |
29.66 |
27.54 |
|
|
- deviation (ton C/ha) |
2.30 |
1.80 |
3.38 |
4.40 |
The condition of the vegetation indicated by the 2015 and 2019 NDVI values at the sample plot locations has unique characteristics for the four types of management. The number of species for Tp1, Tp2, Tp3 and Tp4 were 9, 15, 9 and 8 species, respectively. In the vegetation of D≥20 cm, the highest vegetation density (170 trees/ha) was found at Tp1, and the lowest (55 trees/ha) at Tp4. In the D<2 cm, a vegetation density of 16500 stems/ha was found at Tp1 and 500 stems/ha was at Tp4. Species with the highest IVI value are generally from groups of plants that provide economic benefits such as jackfruit (Artocarpus heterophyllus), avocado (Persea americana), candlenut (Aleurites moluccana), cocoa (Theobroma cacao), mangosteen (Garcinia mangostana), coffee (Coffea canephora) and guava (Psidium guajava). The average soil carbon content for the four management types at a depth of 0-5 cm, 5-10 cm, 10-20 cm and 20-30 cm were 5.26-6.81%, 4.94 - 6.55%, 4.35-5.93% and 4.01-5.68%, respectively, while the average of soil carbon stocks ranged from 18.61-21.04 tons C/ha, 16.56-20.80 tons C/ha, 29.66-34.48 tons C/ha and 27.54 - 33.66 tons C/ha, respectively. Soil carbon stock of dense vegetation (Tp1) is higher than those other types of management, especially dryland agricultural management (Tp4). This fact reflects the importance of choosing forest management type which could maintain forest-like vegetation. Results of this study may be suitable under this local climate and soil type, therefore, similar study on different climate and soil type should enrich the current research.
The authors thank the University of Mataram for research funding facilities. The authors also thank the Karang Sidemen Farmers Group for their support in collecting field data, as well as reviewers and editors who provide valuable suggestions for improving the manuscript.
[1] Kendie, G., Addisu, S., Abiyu, A. (2021). Biomass and soil carbon stocks in different forest types, Northwestern Ethiopia. International Journal of River Basin Management, 19(1): 123-129. https://doi.org/10.1080/15715124.2019.1593183
[2] Chen, S., Wang, W., Xu, W., Wang, Y., Wan, H., Chen, D., Tang, Z., Tang, X., Zhou, G., Xie, Z., Zhou, D., Shangguan, Z., Huang, J., He, J.S., Wang, Y., Sheng, J., Tang, L., Li, X., Dong, M., Wu, Y., Wang, Q., Wang, Z., Wu, J., Chapin, F.S., Bai, Y. (2018). Plant diversity enhances productivity and soil carbon storage. Proceedings of the National Academy of Sciences, 115(16): 4027-4032. https://doi.org/10.1073/pnas.1700298114
[3] Pawar, G.V., Singh, L., Jhariya, M.K., Sahu, K.P. (2014). Effect of anthropogenic disturbances on biomass and carbon storage potential of a dry tropical forest in India. Journal of Applied and Natural Science, 6(2): 383-392. https://doi.org/10.31018/jans.v6i2.432
[4] Besar, N.A., Suardi, H., Phua, M.H., James, D., Mokhtar, M.B., Ahmed, M.F. (2020). Carbon stock and sequestration potential of an agroforestry system in Sabah, Malaysia. Forests, 11(2): 210. https://doi.org/10.3390/f11020210
[5] Markum, Soesilaningsih, E.A., Suprayogo, D., Hairiah, K. (2013). Plant species diversity in relation to carbon stocks at Jangkok Watershed, Lombok Island. Agrivita, 35(3): 207-217. http://dx.doi.org/10.17503/Agrivita-2013-35-3-p207-217
[6] Kessler, M., Hertel, D., Jungkunst, H.F., Kluge, J., Abrahamczyk, S., Bos, M., Buchori, D., Gerold, G., Gradstein, S. R., Köhler, S., Leuschner, C., Moser, G., Pitopang, R., Saleh, S., Schulze, C.H., Sporn, S.G., Steffan-Dewenter, I., Tjitrosoedirdjo, S.S., Tscharntke, T. (2012). Can joint carbon and biodiversity management in tropical agroforestry landscapbs be optimized? PLoS ONE, 7(10): e47192. https://doi.org/10.1371/journal.pone.0047192
[7] Singh, S.L., Sahoo, U.K., Gogoi, A., Kenye, A. (2018). Effect of land use changes on carbon stock dynamics in major land use sectors of Mizoram, Northeast India. Journal of Environmental Protection, 9(12): 1262-1285. https://doi.org/10.4236/jep.2018.912079
[8] Lal, R. (2016). Soil health and carbon management. Food and Energy Security, 5(4): 212-222. https://doi.org/10.1002/fes3.96
[9] Villarino, S.H., Studdert, G.A., Laterra, P. (2019). How does soil organic carbon mediate trade-offs between ecosystem services and agricultural production? Ecological Indicators, 103: 280-288. https://doi.org/10.1016/j.ecolind.2019.04.027
[10] Chiti, T., Perugini, L., Vespertino, D., Valentini, R. (2016). Effect of selective logging on soil organic carbon dynamics in tropical forests in central and western Africa. Plant and Soil, 399(1-2): 283-294. https://doi.org/10.1007/s11104-015-2697-9
[11] Guillaume, T., Kotowska, M.M., Hertel, D., Knohl, A., Krashevska, V., Murtilaksono, K., Scheu, S., Kuzyakov, Y. (2018). Carbon costs and benefits of Indonesian rainforest conversion to plantations. Nature Communications, 9: 2388. https://doi.org/10.1038/s41467-018-04755-y
[12] Angst, G., Messinger, J., Greiner, M., Häusler, W., Hertel, D., Kirfel, K., Kögel-Knabner, I., Leuschner, C., Rethemeyer, J., Mueller, C.W. (2018). Soil organic carbon stocks in topsoil and subsoil controlled by parent material, carbon input in the rhizosphere, and microbial-derived compounds. Soil Biology and Biochemistry, 122: 19-30. https://doi.org/10.1016/j.soilbio.2018.03.026
[13] Novara, A., Rühl, J., La Mantia, T., Gristina, L., La Bella, S., Tuttolomondo, T. (2015). Litter contribution to soil organic carbon in the processes of agriculture abandon. Solid Earth, 6(2): 425-432. https://doi.org/10.5194/se-6-425-2015
[14] Sokol, N.W., Kuebbing, S.E., Karlsen-Ayala, E., Bradford, M.A. (2019). Evidence for the primacy of living root inputs, not root or shoot litter, in forming soil organic carbon. New Phytologist, 221(1): 233-246. https://doi.org/10.1111/nph.15361
[15] Mayer, M., Sandén, H., Rewald, B., Godbold, D.L., Katzensteiner, K. (2017). Increase in heterotrophic soil respiration by temperature drives decline in soil organic carbon stocks after forest windthrow in a mountainous ecosystem. Functional Ecology, 31(5): 1163-1172. https://doi.org/10.1111/1365-2435.12805
[16] Liu, T., Wang, L., Feng, X., Zhang, J., Ma, T., Wang, X., Liu, Z. (2018). Comparing soil carbon loss through respiration and leaching under extreme precipitation events in arid and semiarid grasslands. Biogeosciences, 15(5): 1627-1641. https://doi.org/10.5194/bg-15-1627-2018
[17] Pastore, G., Tobin, B., Nieuwenhuis, M. (2019). Quantifying carbon and nitrogen losses by respiration and leaching from decomposing woody debris in reforested coniferous stands in Ireland. Agricultural and Forest Meteorology, 265: 195-207. https://doi.org/10.1016/j.agrformet.2018.11.023
[18] Liu, Y., Lei, P., Xiang, W., Yan, W., Chen, X. (2017). Accumulation of soil organic C and N in planted forests fostered by tree species mixture. Biogeosciences, 14(17): 3937-3945. https://doi.org/10.5194/bg-14-3937-2017
[19] Mayer, M., Prescott, C.E., Abaker, W.E.A., Augusto, L., Cécillon, L., Ferreira, G.W.D., James, J., Jandl, R., Katzensteiner, K., Laclau, J.P., Laganière, J., Nouvellon, Y., Pare, D., Stanturf, J.A., Vanguelova, E.I., Vesterdal, L. (2020). Tamm Review: Influence of forest management activities on soil organic carbon stocks: A knowledge synthesis. Forest Ecology and Management, 466: 118127. https://doi.org/10.1016/j.foreco.2020.118127
[20] Chiti, To., Grieco, E., Perugini, L., Rey, A., Valentini, R. (2014). Effect of the replacement of tropical forests with tree plantations on soil organic carbon levels in the Jomoro district, Ghana. Plant and Soil, 375(1-2): 47-59. https://doi.org/10.1007/s11104-013-1928-1
[21] Debasish-Saha, Kukal, S.S., Bawa, S.S. (2014). Soil Organic carbon stock and fractions in relation to land use and soil depth in the degraded shiwaliks hills of lower Himalayas, 25(5): 407-416. https://doi.org/10.1002/ldr.2151
[22] De Stefano, A., Jacobson, M.G. (2018). Soil carbon sequestration in agroforestry systems: A meta-analysis. Agroforestry Systems, 92(2): 285-299. https://doi.org/10.1007/s10457-017-0147-9
[23] Chatterjee, N., Nair, P.K.R., Chakraborty, S., Nair, V.D. (2018). Changes in soil carbon stocks across the Forest-Agroforest-Agriculture/Pasture continuum in various agroecological regions: A meta-analysis. Agriculture, Ecosystems & Environment, 266: 55-67. https://doi.org/10.1016/j.agee.2018.07.014
[24] Korkanç, S.Y. (2014). Effects of afforestation on soil organic carbon and other soil properties. Catena, 123: 62-69. https://doi.org/10.1016/j.catena.2014.07.009
[25] Cedamon, E., Nuberg, I., Paudel, G., Basyal, M., Shrestha, K., Paudel, N. (2016). Rapid silviculture appraisal to characterise stand and determine silviculture priorities of community forests in Nepal. Small-Scale Forestry. 16(2): 195-218. https://doi.org/10.1007/s11842-016-9351-0
[26] Sabastian, G.E., Yumn, A., Roshetko, J.M., Manalu, P., Martini, E., Perdana, A. (2019). Adoption of silvicultural practices in smallholder timber and NTFPs production systems in Indonesia. Agroforest Syst, 93(2): 607-620. https://doi.org/10.1007/s10457-017-0155-9
[27] Andriamananjara, A., Hewson, J., Razakamanarivo, H., Andrisoa, R.H., Ranaivoson, N., Ramboatiana, N., Razafindrakoto, M., Ramifehiarivo, N., Razafimanantsoa, M.P., Rabeharisoa, L., Ramananantoandro, T., Rasolohery, A., Rabetokotany, N., Razafimbelo, T. (2016). Land cover impacts on aboveground and soil carbon stocks in Malagasy rainforest. Agriculture, Ecosystems and Environment, 233: 1-15. https://doi.org/10.1016/j.agee.2016.08.030
[28] Paz, C.P., Goosem, M., Bird, M., Preece, N., Goosem, S., Fensham, R., Laurance, S. (2016). Soil types influence predictions of soil carbon stock recovery in tropical secondary forests. Forest Ecology and Management, 376: 74-83. https://doi.org/10.1016/j.foreco.2016.06.007
[29] Hombegowda, H.C., van Straaten, O., Köhler, M., Hölscher, D. (2016). On the rebound: soil organic carbon stocks can bounce back to near forest levels when agroforests replace agriculture in southern India. Soil, 2(1): 13-23. https://doi.org/10.5194/soil-2-13-2016
[30] Nandini, R., Narendra, B.H. (2011). Kajian perubahan curah hujan, suhu dan tipe iklim pada zone ekosistem di Pulau Lombok. Jurnal Analisis Kebijakan Kehutanan, 8(3): 228-244. https://doi.org/10.20886/jakk.2011.8.3.228-244
[31] Ranesa, L.S.C., Limantara, L.M., Harisuseno, D. (2015). Analisis rasionalisasi jaringan pos hujan untuk kalibrasi hidrograf pada Das Babak Kabupaten Lombok Tengah. Jurnal Teknik Pengairan, 6(1): 46-54.
[32] BSN. (2011). SNI 7724: 2011. Pengukuran dan penghitungan cadangan karbon -pengukuran lapangan untuk penaksiran cadangan karbon hutan (Ground based forest carbon accounting). Badan Standardisasi Nasional. Jakarta Indonesia.
[33] Passel, J.V., De Keersmaecker, W., Somers, B. (2020). Monitoring woody cover dynamics in tropical dry forest ecosystems using Sentinel-2 satellite imagery. Remote Sensing, 12(8): 1276. https://doi.org/10.3390/rs12081276
[34] Sofan, P., Vetrita, Y., Yulianto, F., Khomarudin, M.R. (2016). Multi-temporal remote sensing data and spectral indices analysis for detection tropical rainforest degradation: case study in Kapuas Hulu and Sintang districts, West Kalimantan, Indonesia. Natural Hazards, 80(2): 1279-1301. https://doi.org/10.1007/s11069-015-2023-0
[35] Zaitunah, A., Samsuri, Ahmad, A.G., Safitri, R.A. (2018). Normalized difference vegetation index (NDVI) analysis for land cover types using Landsat 8 Oli in besitang watershed, Indonesia. IOP Conf. Ser.: Earth Environ. Sci, 126: 012112. https://doi.org/10.1088/1755-1315/126/1/012112
[36] Erinjery, J.J., Singh, M., Kent, R. (2018). Mapping and assessment of vegetation types in the tropical rainforests of the Western Ghats using multispectral Sentinel-2 and SAR Sentinel-1 satellite imagery. Remote Sensing of Environment, 216: 345-354. https://doi.org/10.1016/j.rse.2018.07.006
[37] Nichiporovich, Z.A. Radevich, E.A. (2012). Experience using the NDVI normalized difference vegetation index for monitoring Polesye agricultural land based on multispectral Ikonos satellite imaging data. Journal of Applied Spectroscopy, 79(4): 670-673. https://doi.org/10.1007/s10812-012-9656-5
[38] Cottam, G., Curtis, J.T. (1956). The use of distance measures in phytosociological sampling. Ecology, 37(3): 451-460. https://doi.org/10.2307/1930167
[39] Ellenberg, D., Mueller-Dombois, D. (1974). Aims and Methods of Vegetation Ecology. New York: Wiley.
[40] Komara, L.L., Choesin, D. N., Syamsudin, T.S. (2016). Plant diversity after sixteen years post coal mining in East Kalimantan, Indonesia. Biodiversitas, 17(2): 531-538. https://doi.org/10.13057/biodiv/d170223
[41] Allisson, L. (1965). Organic carbon in: BLACK, CA (ed.) Methods of soil analysis, chemical and microbiological properties. Madison: Am. Soc. of Agronomy, 1367-1378.
[42] Graham, E.R. (1948). Determination of soil organik mater by means of a photoelectric colorimeter. Soil Sci, 65: 181-183.
[43] Erasmi, S., Schucknecht, A., Barbosa, M.P., Matschullat, J. (2014). Vegetation greenness in Northeastern Brazil and its relation to ENSO warm events. Remote Sensing, 6(4): 3041-3058. https://doi.org/10.3390/rs6043041
[44] Zhang, Y., Zhu, Z., Liu, Z., Zeng, Z., Ciais, P., Huang, M., Liu, Y., Piao, S. (2016). Seasonal and interannual changes in vegetation activity of tropical forests in Southeast Asia. Agricultural and Forest Meteorology, 224: 1-10. https://doi.org/10.1016/j.agrformet.2016.04.009
[45] Idris, M.H., Latifah, S., Setiawan, B. (2020). Keadaan vegetasi hutan berbasis masyarakat di desa Aik Bual dan desa Setiling, Pulau Lombok. Jurnal Sylva Lestari, 8(2): 218-229. http://doi.org/10.23960/jsl28218-229
[46] Sukardi, L., Ismail, I., Idris, M.H. (2017). Estimated carbon absorption and economic benefits in various scenarios of community forest (HKm) land management through the scheme of plan vivo in the upstream watersheds (DAS) of Renggung River, Central Lombok Regency, Indonesia. Sumatra Journal of Disaster, Geography and Geography Education, 1(1): 62-67. https://doi.org/10.24036/sjdgge.v1i1.37
[47] Berihu, T., Girmay, G., Sebhatleab, M., Berhane, E., Zenebe, A., Sigua, G.C. (2017). Soil carbon and nitrogen losses following deforestation in Ethiopia. Agronomy for Sustainable Development, 37(1): 1-12. https://doi.org/10.1007/s13593-016-0408-4
[48] Hairiah, K., van Noordwijk, M., Sari, R.R., Saputra, D.D., Widianto, Suprayogo, D., Kurniawan, S., Prayogo, C., Gusli, S. (2020). Soil carbon stocks in Indonesian (agro) forest transitions: Compaction conceals lower carbon concentrations in standard accounting. Agriculture, Ecosystems & Environment, 294: 106879. https://doi.org/10.1016/j.agee.2020.106879
[49] Pinheiro, É.F.M., de Campos, D.V.B., Balieiro, F.C., dos Anjos, L.H.C., Pereira, M.G. (2015). Tillage systems effects on soil carbon stock and physical fractions of soil organic matter. Agricultural Systems, 132: 35-39. https://doi.org/10.1016/j.agsy.2014.08.008
[50] Monroe, P.H.M., Gama-Rodrigues, E.F., Gama-Rodrigues, A.C., Marques, J.R.B. (2016). Soil carbon stocks and origin under different cacao agroforestry systems in southern Bahia, Brazil. Agriculture, Ecosystems & Environment, 221: 99-108. https://doi.org/10.1016/j.agee.2016.01.022