Seyed Mohammad Mousavi* | Tareef Hayat Khan | Amin Mohammadi
© 2021 IIETA. This article is published by IIETA and is licensed under the CC BY 4.0 license (http://creativecommons.org/licenses/by/4.0/).
OPEN ACCESS
Home-based workspaces have considerably increased all over the world. Besides, the recent outbreak of the COVID-19 disease forced many people to work from their homes. However, existing residential apartment buildings (ERABs) had been designed for accommodation but not for office works. Low-quality visual environments in ERABs, which have no shading controls on their windows, are evident in tropical climates with extremely high solar radiation. Thus, interior retrofit is significant to provide visual comfort for users in ERABs with low flexibility for modification of their facades. Different interior design variables were simulated by the Radiance-based program to analyse daylighting in a closed-plan room. Before the simulation experiments, field measurement of daylight was performed under a tropical sky to validate the results, and the findings revealed significant Pearson correlations. This paper showed that ERABs are confronting extremely high indoor daylight quantity, up to 10,228 lx, and low quality with intolerable glare. An adjustable model of internal shading, including an integrated Venetian blind with a horizontal light shelf and the window films, was proposed to improve quantitative and qualitative performances of daylighting in tropical regions. This dynamic model could be adjusted to various positions based on daylighting conditions in the buildings. By comparing the simulation results of this model with the base model, indoor illuminance levels could successfully reduce from 32% to 86%; Illuminance Uniformity Ratio (IUR) and Target Daylight Illuminance (TDI) significantly improved up to 180% and 300%, respectively; Daylight Glare Probability (DGP) and CIE Glare Index (CGI) changed from intolerable to imperceptible status. Accordingly, the proposed model can considerably improve daylight quantity and quality in the test room during different times. This study concludes that the dynamic model of internal shadings could provide efficient daylighting, by decreasing the extremely high indoor illuminance and glare in the ERABs in tropical climates.
COVID-19, daylight, glare, internal shading, residential building, tropical climate, visual comfort
Daylighting is one of the significant passive design strategies to save energy in buildings [1-4]. A minimum of 10% energy can be saved through efficient daylighting strategies in buildings, in Malaysia [5]. Numerous studies revealed that efficient daylighting, in addition to energy-saving, could significantly provide a healthy indoor environment with visual comfort for the occupants [6-9]. Furthermore, to have a definite amount of light, daylight is more beneficial than electric lighting as it creates lower heat gain and better quality [10, 11]. Malaysia, with a tropical climate (the latitude is 1° N to 6° 45ˊN, and the longitude is 99° 36ˊE to 104° 24ˊE), has got extreme solar radiation, excessively high outdoor illuminances, and a dynamic cloud formation [12-15]. However, the high availability of tropical sunlight has not been efficiently utilised in many ERABs, which were rapidly increased in major urban areas worldwide, especially Malaysia. This situation, excessive penetration of tropical sunlight, is even more acute in those buildings without any external shadings or well-designed shading devices on their facades.
In the recent decade, due to the rapid growth of communication technology and computer services (i.e., Internet, digital drawings, etc.), many people relocated their own offices to their residential units [16]. This relocation has brought considerable benefits for home office workers, such as saving their time and money, reducing expenses of daily commute and vehicular traffic congestion, increasing independence, efficiency, and flexibility while working, etc. [17-20]. Furthermore, the recent outbreak of COVID-19 disease worldwide forced people to work from their housing units, particularly those residents who are doing desk-related tasks. Mangkuto et al. [21] showed the significance of implementing daylighting tactics in residential structures, globally, during these times of the disastrous COVID-19 pandemic. Therefore, in addition to the living activities, a residential unit might also be used as a place for home office workers to perform their desk-related tasks. A home office workspace is defined as an area inside a house embodying a type of desk-related tasks, such as computing, paperwork, etc. This space may solely be occupied a whole room or may be located at the other places in a house [18]. Home office tasks have remarkably increased worldwide, and this developing trend has been recently focused by the Malaysian government to induce people to work from their homes [22, 23]. A survey in some ERABs in Malaysia revealed that computer-related tasks were frequently performed by most residents during the daytime [24]. However, ERABs were not designed for office working as they had been planned only for accommodation. Kanarek [18] declared that daylighting is an effective strategy to be designed for home office workspaces to provide visual comfort for the users. Previous research showed that excessive indoor illuminance is detrimental to visual comfort resulted in glare and thermal problems for users [25, 26]. This condition is even more critical to home office workspaces, where visual comfort needs to be provided for the users.
Previous daylighting studies in tropical climates were mostly conducted to be applied in new buildings. These daylighting strategies were frequently concentrated on building orientation [27-29], building geometry [30, 31], window design [32-35], and particularly on external shading controls [36-38], etc. However, these passive strategies are uneconomical to be retrofitted by users after their occupancy in such buildings [25, 39]. They are infeasible to be applied in existing buildings that have more constraints than new buildings on using energy-efficient design approaches [15]. Thus, a retrofit could be an effective approach for existing buildings to increase indoor daylight efficiency. Through implementing daylighting strategies in residential buildings, a retrofit would reduce energy use and provide attractive dwellings [40]. While many ERABs in tropical climates, with abundant indoor daylight availability, have not been designed for daylighting, considering daylighting strategies through interior retrofit is significant to have energy-efficient and productive home office environments. Previous daylighting studies under tropical skies were mostly done for office, commercial, or educational buildings focusing on indoor daylight quantity. There is not enough research into daylight quality in tropical regions, particularly in existing residential buildings compared with the newly-designed buildings.
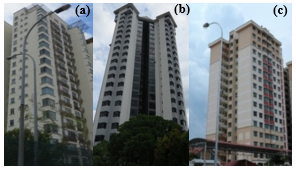
Figure 1. Examples of typical ERABs in Malaysia: (a) Pulai View; (b) Mewa; (c) Nusa Perdana
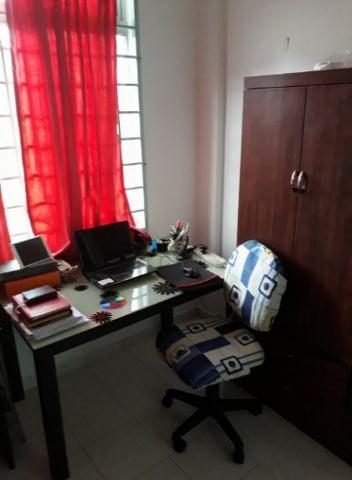
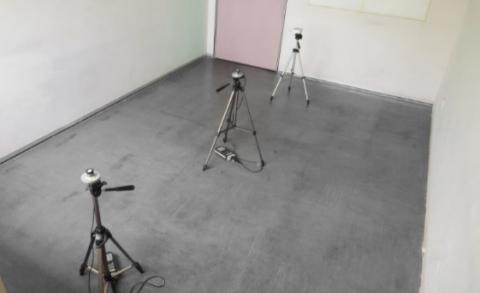
A survey was conducted by the authors in several contemporary residential buildings in Johor Bahru, Malaysia, in which home office activities were frequently performed by users. All the case studies were without external shading devices on their facades (Figure 1); this caused excessive sunlight penetration and visual discomfort for the users in the buildings. As it is impractical for home office users to retrofit the external façades of such buildings, a vast majority overused and completely pulled down curtains or internal blinds to inhibit the direct penetration of sunlight in their workspaces during the daytime (Figure 2). Despite high daylight availability in tropical climates, the users switched on electric lighting to do their home office tasks during the daytime. In contrast, high dependency on electric lighting can cause energy consumption, irritability, eye strain, and poor productivity. A study by Jamaludin et al. [41] in several residential college buildings in a tropical climate also showed that the residents ignored daylight and used electric lighting instead to perform their desk-related tasks during the daytime. Jamaludin et al. [42] claimed that electric lightings and air conditioning are common solutions to overcome heat gain from sunlight penetration in residential buildings. The focus of this paper was on both daylight quantity and quality in ERABs under tropical skies to enhance indoor daylight efficiency through interior retrofit of home office environments. Accordingly, various design layouts were tested to retrofit interior workspaces for providing visual comfort in ERABs within the tropical regions.
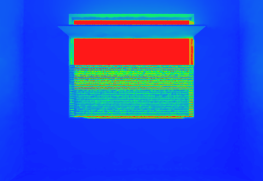
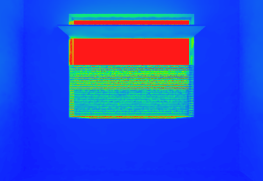
Figure 2. A typical home office workspace in the case studies
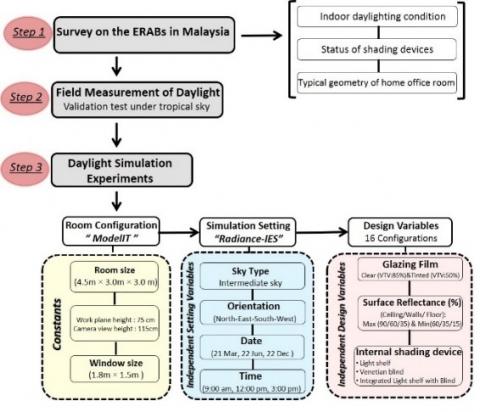
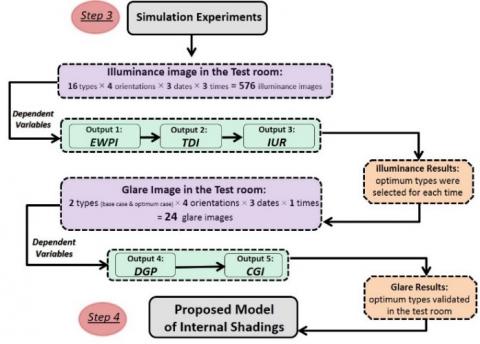
As illustrated in Figure 3, the methodological framework generally consisted of four steps in this paper. The first step includes a survey on several ERABs in Johor Bahru, Malaysia, to find indoor daylighting, the conditions of existing shading devices, and especially the typical geometry of home office room for daylight simulation experiments. In the second step, field measurement of daylight was conducted in a typical home office room in one of the case buildings to validate the simulation results. In the next stage, a vast spectrum of simulation experiments was conducted to analyse indoor daylight quantity and quality in the test room with different configurations of interior design variables. In the final step, a model of internal shading was proposed to improve daylighting performance in the existing buildings.
Radiance simulation engine in IES<VE> (Integrated Environmental Solution<Virtual Environment>) was used to evaluate daylight performances of various interior design parameters. IES<VE> is a multifunctional software to simulate green buildings and analyse energy efficiency in buildings from the preliminary phases of design [43, 44]. Radiance-IES is a prominent daylighting performance tool used by specialists in different fields, such as architects, engineers, etc., that could be integrated with other simulation tools [45, 46]. Previous studies indicated that International Commission on Illumination (CIE) sky models, which are employed by many daylight simulation tools, especially the Radiance-IES, are different from tropical skies [47-49]. Due to high outdoor illuminances of tropical skies, which could be as high as 140 klx [47], compared with the CIE sky models, a field measurement under the real tropical skies was done to validate the simulated results derived from the Radiance-IES program empirically. Field measurement is the most appropriate method to investigate daylight performance in built environments [50, 51].
2.1 Empirical validation test
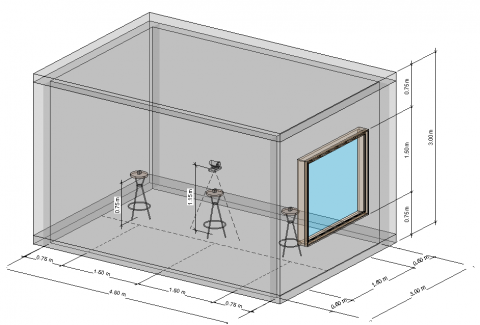
The field measurement was performed in a closed-plan room located in one case study, Skudai Parade building (Figure 1c), Johor Bahru, Malaysia (1.5417°N and 103.6600° E). Figure 4 depicts the geometry of the test room that represents the typical dimensions of a home office room in ERABs in Malaysia. For more comprehensive generalisation, the layout of this test room was considered for further simulation tests. This side-lit room was not shaded by any external obstructions such as surrounding vegetation, adjacent buildings, or the ground plane. The specifications of the internal surfaces in the test room were shown in Table 1. As illustrated in Figure 4, three illuminance meters (Delta-OHM-LP-471-PHOT) with their linked data loggers (Photo-Radiometer-Delta-OHM-HD-2012.2), Probes P1, P2, and P3, were placed inside the test room, at the working plane height of 0.75 m from the floor, to measure work plane illuminance (WPI) values. Simultaneously, an illuminance meter (Delta-OHM-LP-PHOT-02), with the measurement range of 0 –150,000 lx (the probe capped with a diffuser), was located on the building's roof to measure the external illuminance values (Figure 5). Nikpour [52] declared that calibration tests need to be done for evaluating the accuracy of the instruments used in daylight measurements by each other. Hence, all the internal and external illuminance meters were calibrated before measuring daylight in the test room. The field experiment was carried out during 7 days (12-18 May 2019) from 9 a.m. to 6 p.m. to experience different status of tropical skies, overcast and intermediate, during a day. Afterwards, the test room with the same interior conditions was simulated by the Model IT tool in the IES<VE> software. Besides, the times, dates, and sky conditions of the daylight simulation experiments were set based on the actual field measurement. For validation purposes, the measured results of the field experiment were compared with the simulated results derived from the Radiance-IES. Previous daylighting research in tropical climates showed that the relative ratios of daylight measurements are closer to reality than the absolute values, which both were taken from the simulation software under the tropical skies [49]. Therefore, instead of measuring absolute WPI values, the relative ratios such as daylight factor (DF) and daylight ratio (DR), as calculated in Eq. (1), were employed to analyse daylight quantities in the test room under the overcast and intermediate skies, respectively.
Figure 3. Methodological framework
Figure 4. Geometry of the test room and locations of the illuminance meters for the field measurement
DF or DR = Internal WPI / External Illuminance × 100% (1)
Table 1. Specifications of internal surfaces in the test room
|
Surface |
Colour |
Reflectance |
|
Ceiling |
Matte White |
87% |
|
Walls |
Matte Cream |
71% |
|
Floor |
Dark Grey |
13% |
|
Door |
Pale Pink |
26% |
Figure 5. The external illuminance sensor is located on the building's roof
2.2 Design variables
As this research focused on interior retrofit for efficient tropical daylighting, the design variables were culled from those items that are more appropriate to be used in retrofit projects. Huff and Huff [53] claimed that an internal light shelf as a daylighting strategy could be used for both new constructions and retrofit projects. While external light shelves are more efficient to distribute sunlight deeper into a room, using internal light shelves is perfectly simpler and more flexible to be hung on a window by users [54]. As an internal light shelf could lower the exposed surface of a window, it is a suitable solution to improve the reflected light in residential buildings under tropical skies [37]. Besides, Venetian blind as an interior shading control could soften the penetration of direct sunlight and prevent glare problems to provide visual comfort for users in the buildings [55, 56]. Moreover, solar control films or window films as a strategy of interior retrofit can be installed on a window, even by the users, to control indoor daylight levels in buildings [57]. By tinting windows in residential buildings, the consumption of artificial lighting and the cooling load of air conditioners could be significantly decreased [58, 59]. Jamaludin et al. [60] declared that tinted window glazing should be widely implemented for both retrofit and new designs in residential buildings in tropical climates. In addition, specifications of interior surfaces, in terms of reflectivity, should be considered for daylighting design in a retrofit project in a building [61]. Jughans [62] proved that reflectance coefficients of interior surfaces could control sunlight distribution and glare issues in a building. Thus, in this research, different combinations of the interior design parameters (internal light shelf, Venetian blind, window glazing film, and reflectivity factors of interior surfaces) were experimented to retrofit interior workspaces for tropical daylighting. Accordingly, three kinds of internal shading devices, including a horizontal light shelf, a Venation blind, and an integrated Venetian blind with a horizontal light shelf, were considered for the daylight simulation experiments. Clear and specially tinted window glazing is widely used in residential buildings under tropical skies [28, 63, 64]. In Malaysia, the visible transmittance value (VTV) in the range of 20-80% is frequently applied for window glazing [65, 66]. Lim et al. [67] demonstrates that VTV of 53% and 54% have been mostly considered for windows in existing buildings in Malaysia. In this study, two kinds of glazing film have experimented with, clear film with 85% VTV and tinted film with 50% VTV. The surface reflectance value (SRV) of 0.4 (floor) and 0.6 (walls) are more efficient for lighting purposes in buildings [68]. Based on the standards [69], 60-90% (ceilings), 35-60% (walls), and 15-35% (floors) are the recommended SRV ranges in the residences. Accordingly, to have a better generalisation, two types of interior surface reflectance, the recommended upper thresholds with SRV of 90% (ceiling), 60% (walls), and 35% (floor), and the lower thresholds with SRV of 60% (ceiling), 35% (walls), and 15% (floor), were considered for the simulation tests to show the minimum and maximum impacts of surface reflectance on tropical daylighting in existing buildings. Specifications of the interior surfaces of the test room, specularity, and roughness factors, were adjusted in the Radiance-IES program based on the recommendations [69, 70], as shown in Table 2.
Table 2. Specifications of the interior surfaces in the test room
|
Surface |
SRV |
Specularity |
Roughness |
n |
|
Ceiling |
0.60 & 0.90 |
0.03 |
0.03 |
1 |
|
Walls |
0.35 & 0.60 |
0.03 |
0.03 |
4 |
|
Floor |
0.15 & 0.35 |
0.03 |
0.05 |
1 |
|
Light Shelf |
0.86 |
0.05 |
0.03 |
1 |
|
Venetian Blind |
0.56 |
0.05 |
0.03 |
31 |
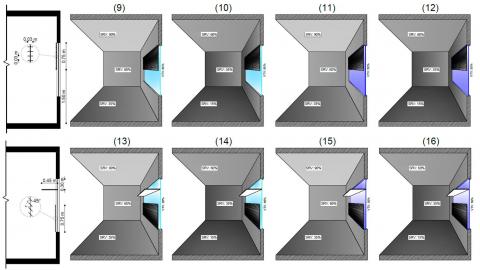
Overall, as illustrated in Figure 6, sixteen various combinations of the design variables were considered for the daylight simulation experiments in the test room. The base model (type 1) represents a typical home office room in the ERABs in Malaysia. Types 1-4 consisted of different combinations of SRV with VTV; in addition to these two parameters, a light shelf was added for types 5-8, while types 9-12 have a partial Venetian blind instead; types 13-16 comprised of all the design parameters. Previous daylighting studies revealed that intermediate sky is the predominant sky type, about 86% yearly, in the Malaysian tropical climate [47, 71]. Hence, this sky type was employed for the simulation experiments. Three dates (21 March, 22 June, and 22 December) and three various times during the days (9 a.m., 12 p.m., and 3 p.m.) were experimented on in this research to show various solar geometries during the solstices and equinox in Malaysia [72]. All cardinal orientations (North, South, East, and West) were considered for the daylight simulation experiments. Lim et al. [15] claimed that it is impractical to generalise furniture arrangements for daylighting research. As different furniture arrangements may yield distinct daylighting performance [72], furniture was ignored in this study to precisely evaluate indoor daylight levels throughout the simulation experiments in the test room.
2.3 Daylight performance indicators
2.3.1 Illuminance indices
In Eq. (1), absolute WPI values were converted into DR to demonstrate the availability of indoor daylight illuminance under the tropical sky. Estimated work plane illuminance (EWPI), Eq. (2), shows the usability of daylight illuminance by estimating indoor illuminance values in tropical climates [43, 73-75]. Estimated outdoor illuminances, in Eq. (2), were approximated based on the generalised findings, derived from the actual measurements of daylight availability in several tropical contexts in Malaysia [5, 47, 71, 75], and the weather data profile of Johor Bahru which was obtained through the online website [76].
EWPI = (DR / 100) × Estimated outdoor illuminance (2)
Useful daylight illuminance (UDI) as a dynamic daylight indicator has been used to analyse the efficiency of daylight in buildings under various sky models [65, 77-80]. "UDI-supplementary" happens in case of daylight illuminance values of 100 lx to 500 lx [65, 79]. Previous studies declared that WPI values in the range of 100- 500 lx are appropriate for desk-related tasks, especially computer works. In contrast, WPI of lower than 100 lx is insufficient, and supplementary artificial lighting is needed to perform such tasks [74, 81]. Moreover, additional shading is needed for spaces with WPI beyond 500 lx that causes visual discomfort in home office workspaces [29]. Mahdavi et al. [34] introduced a daylight indicator, 'suitable area zone,' to show the percentage of indoor spaces with acceptable WPI for the desk-related tasks in a tropical climate. While different activities, besides the desk-related tasks, could be done in a home office room, Target Daylight Illuminance (TDI), in this paper, stands for the percentage of the room area with EWPI level in the range of 100-500 lx. Besides, illuminance uniformity ratio (IUR) was employed to evaluate the quality of daylight distribution in the room [74, 75, 82]. IUR is the ratio of minimum illuminance (EMin) to average illuminance (EAvg) in the room, as shown in Eq. (3).
Illuminance Uniformity Ratio (IUR) = EMin / EAvg (3)
2.3.2 Glare indices
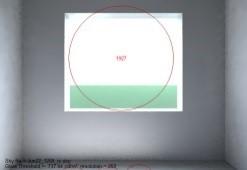
Based on the findings of indoor illuminance analysis (EWPI, TDI, IUR) in the test room, the optimum types could be detected for each of the studied times. At this stage, the worst scenarios of glare incidence in the test room for each orientation were experimented with to make a comparison between the base model and the optimum ones in terms of glare. While there are different metrics to evaluate visual comfort in indoor environments, each one is appropriate for an actual lighting situation [83]. CIE Glare Index (CGI) is the most robust index compared with Daylight Glare Index and Unified Glare Rating. It substantially estimates a higher possibility of discomfort glare by showing worst-case scenarios [84]. Daylight Glare Probability (DGP) is the most robust metric that shows the most admissible results among other glare indices for measuring discomfort glare in a side-lit building [84, 85]. Thus, in this paper, DGP and CGI were employed to evaluate glare conditions in the test room with different daylit situations in which diffuse and direct sunlight fell on the work surface. Table 3 represents the different statuses of discomfort glare, by CGI and DGP, in buildings [86, 87]. As shown in Figure 4, the camera was located at the height of 115 cm in the centre of the room facing the window to represent the worst glare scenario in the test room.
Table 3. Glare prediction values
|
Discomfort category |
Glare range values |
|
|
DGP |
CGI |
|
|
Intolerable |
> 0.45 |
> 28 |
|
Disturbing |
0.40 – 0.45 |
22-28 |
|
Perceptible |
0.35 – 0.40 |
13-22 |
|
Imperceptible |
< 0.35 |
< 13 |
3.1 Validation test
Table 4. Pearson correlation analysis of simulated and measured DF and DR
|
Relative ratios |
N |
Sig. (2-tailed) |
Pearson Correlation |
|
DR |
90 |
.000 |
.769** |
|
DF |
120 |
.000 |
.856** |
|
**. Correlation is significant at the 0.01 level (2-tailed). |
|||
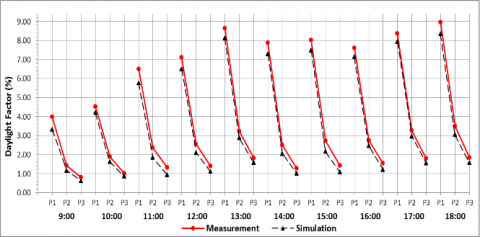
Figure 7 depicts the simulated and measured DF and DR, averagely for the 7-day measurements of daylight in the test room. By ignoring the minor variation, the line graphs clarified that the simulated and measured results followed approximately a similar trend in the test room during different times. To have a deeper understanding, Pearson correlation analysis was used to show the relationship between the simulated and measured findings, as shown in Table 4. Results of the validation experiment demonstrate that the Radiance-IES simulation tool had a high potential to simulate indoor daylight variations in tropical climates. This was also proved by previous daylighting studies for tropical skies [49, 73].
Figure 7. Simulated and measured DF and DR in the test room
3.2 EWPI analysis
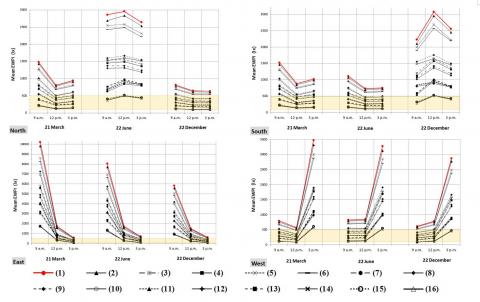
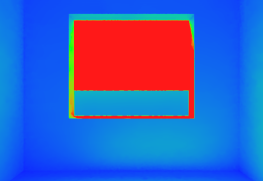
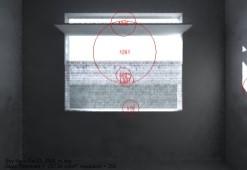
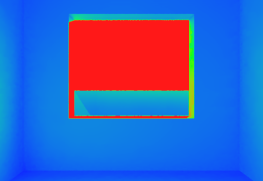
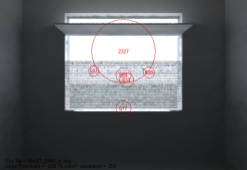
Figure 8 depicts the mean EWPI values represented by all sixteen design variables in the test room for different orientations. Generally, under north orientation, the lowest and highest EWPI values were recorded on 22 December (winter solstice) and 22 June (summer solstice), respectively. On 22 June, the base model recorded the highest EWPI among all types, with 2,863 lx in the morning, around 3,000 lx at midday, and 2,644 lx in the afternoon. This pattern occurred for other types on 22 June; however, only types 15 and 16 recorded EWPI values in the recommended range (100-500 lx) in the test room during the whole day. In the south-facing room, the highest EWPI values were observed on 22 December when the sun has the lowest altitude in the sky. At this time, the base model yielded the highest illuminance value with 2,233 lx (9 a.m.), 3,081 lx (12 p.m.), and 2,558 lx (3 p.m.). However, only types 15 and 16 could considerably decrease the high amount of daylight in the test room; they also recorded the lowest illuminance values of around 220 lx, 140 lx, and 155 lx on 21 March, and 164 lx, 113 lx, 114 lx on 22 June at 9 a.m., 12 p.m., and 3 p.m., respectively. For east orientation, the downward trends of EWPI were observed from morning till afternoon for all the design variables in which EWPI values, recorded by the base model, were at their peaks in the morning with the value of 10,228 lx (on 21 March), 8,040 lx (on 22 June), and 5,818 lx (on 22 December). However, types 15 and 16 recorded the lowest illuminance value in the morning with an average of 1,726 lx, 1,298 lx, and 930 lx on 21 March, 22 June, and 22 December, respectively. For west orientation, the illuminance values reached their peaks in the afternoon, when the west-facing room received direct sunlight peaked at about 3,500 lx on 21 March by the base model. Moreover, types 15 and 16 represented the lowest EWPI values among all the test cases, with the mean values of 112 lx in the morning, 116 lx at midday, and 532 lx in the afternoon during the studied times.
Figure 8. Mean EWPI values recorded by 16 design variables in the test room with different orientations
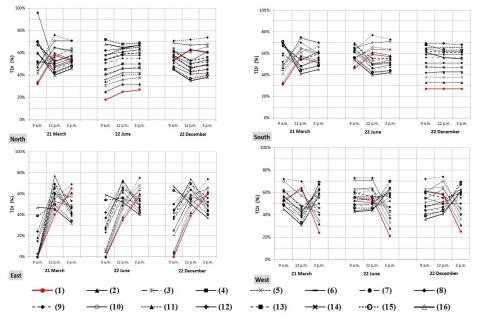
Figure 9. TDI percentage recorded by 16 design variables in the test room with different orientations
3.3 TDI analysis
Figure 9 shows the TDI percentage achieved by all the design variables in the test room under different orientations. In the north-facing room, on 21 March, the base model recorded the lowest TDI in the morning with 32%, while type 14 represented the highest percentage (96%) among all; from midday onwards, types 9 and 10 had the best TDI performance with around 75% on average, while types 15 and 16 showed the lowest TDI with averagely 44% in this period. On 22 June, the base model yielded the lowest TDI among all with 18%, 25%, and 27% from morning till afternoon, respectively, whereas type 15 had the highest percentage with TDI of 72% (9 a.m.), 68% (12 p.m.), and 69% (3 p.m.). On 22 December, types 9 and 10 recorded the best TDI performance among the rest types, with 70% on average, while types 15 and 16 showed the lowest TDI with an average of 45%, 36%, and 39% from morning till afternoon, respectively. In the south-facing room, on 21 March in the morning, the base model represented the lowest TDI with 31%, while type 15 recorded the highest TDI with 71%; from midday onwards, types 9 and 10 represented the highest TDI, around 72%, whereas types 15 and 16 showed the lowest TDI, around 45% on average, among all. On 22 June, the base model recorded the lowest TDI with 46% in the morning, while type 11 had the best performance among all with 70% TDI. At noon and afternoon times, type 9 recorded the maximum TDI, around 75%, while type 16 had the minimum TDI, with 41%, among all. On 22 December, TDI values remained constant during the whole day for most of the design types; the base model showed the lowest value with 27% TDI, and type 12 had the highest value among all with a TDI of 69%.
For all the studied days under east orientation, as shown in Figure 9, the base model demonstrated no value of TDI in the morning, when the test room receives direct sunlight. In contrast, type 15 recorded the highest TDI at this time with 47%, 59%, and 67% on 21 March, 22 June, and 22 December, respectively. At the noon times, the base model recorded the lowest, and type 11 showed the highest TDI among all with an average of 40% and 75%, respectively. In the afternoon, type 9 yielded the highest TDI with 69% (on 21 March), 75% (on 22 June), and 74% (on 22 December), while types 15 and 16 had the lowest TDI among all. In the west-facing room, type 9 recorded the best TDI performance, over 70%, for all the studied days from morning till noon when the room receives indirect sunlight, while type 16 was the worst case among all with 40% TDI on average. However, during afternoon times, when the west-facing room receives direct sunlight, type 15 was the best design option among all with about 70% TDI. The base model demonstrated the worst TDI scenario with around 23%.
3.4 IUR analysis
Table 5 summarises the illuminance analyses by comparing the base with the optimum models for all the studied times and orientations. It should be noted that the optimum types were selected among those layouts which achieved the recommended range of EWPI and simultaneously recorded the highest TDI and IUR in the test room. Although some of the optimum cases exceeded the recommended range of illuminance (100-500 lx) during the studied times of the simulation experiments, such as type 9 in the north-facing room on 21 March with EWPI of 512 lx, they were still selected as the optimum types since the illuminance values, recorded by them, were slightly over the maximum recommended range. However, those optimum types achieved the first rank among all the test cases regarding IUR and TDI performance.
In the north-facing room, as shown in Table 5, on 21 March, type 15 as the optimum case improved the uniformity around 75% in the morning, while this metric was increased 114% by type 9 at midday, and 78% by type 11 in the afternoon. On 22 June, type 15, as the optimum case during the whole day, could significantly improve daylight uniformity with 88%, 117%, and 180% in the morning, midday, and afternoon, respectively. On 22 December, type 9 with IUR improvement of 150% (9 a.m.), 111% (12 p.m.), and 113% (3 p.m.) was the best case among all under north orientation. In the south-facing room, various types achieved the optimum performance during the whole day on 21 March in which types 15, 9, and 11, could significantly 88% (9 a.m.), 100% (12 p.m.), and 143% (3 p.m.) improve daylight uniformity in the test room, respectively. On 22 June, the IUR value was around 111%, increased by type 11 in the morning, while type 9 improved daylight uniformity 91% at midday, and 110% in the afternoon. On 22 December, type 15 topped the ranking during the whole day with 89% (9 a.m.), 114% (12 p.m.), and 78% (3 p.m.) improvement of daylight distribution uniformity in the south-facing room.
For all the studied days under east orientation, types 15, 11, and 9 were the best cases among all in terms of illuminance performance in the morning, at midday, and in the afternoon, respectively, as shown in Table 5. Type 15 significantly improved IUR with 83% on 21 March and 22 June, and 71% on 22 December. Type 11 increased daylight uniformity by 140%, 160%, and 88%, while type 9 improved this uniformity of daylight in the east-facing room with 88%, 78%, and 89% on 21 March, 22 June, and 22 December, respectively. For west orientation, when the room receives direct sunlight in the afternoon times, type 15 topped the ranking with a significant IUR increase of 86% (21 March), 117% (22 June), and 160% (22 December). In addition, type 9 recorded the highest daylight distribution uniformity among all types, compared with the base model, from morning till noon in the west-facing room, with an improvement of 78% (9 a.m.), and 90% (12 p.m.) on 21 March; 111% (9 a.m.), and 90% (12 p.m.) on 22 June; 125% (9 a.m.), and 129% (12 p.m.) on 22 December.
3.5 Glare analysis
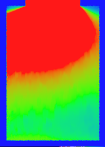
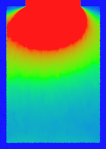
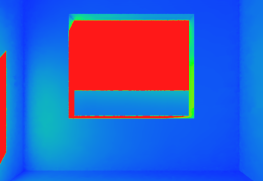
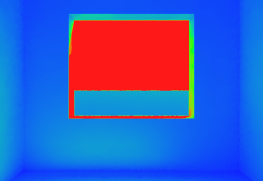
For glare analyses, the worst-case scenarios of glare incidence in the test room were simulated for each orientation. As shown in Table 6, the glare metrics recorded by the base model were compared with the values achieved by type 15 as the optimum model. On 22 June, when the north-facing room receives direct sunlight, the optimum model could significantly reduce DGP in the morning to change the intolerable status of glare with DGP of 0.46 into an imperceptible phase with DGP of 0.36; in addition, the CGI value was reduced from 26.79 to 21.81 in the morning. From midday onwards, type 15 improved DGP and CGI values compared to the base model, and the results of CGI and DGP were within the perceptible and imperceptible glare ranges, respectively. On 22 December, the south-facing room got direct exposure to sunlight; consequently, the base model yielded intolerable and disturbing glare range at three different times of the day. However, the optimum type could soften indoor glare condition with a significant reduction of DGP, 0.34 at 9 a.m., 0.33 at 12 p.m., and 0.36 at 3 p.m. Moreover, type 15 considerably lowered the CGI value from 26.82 to 21.73 in the morning, 26.17 to 21.56 at noon, and 27.43 to 22.19 in the afternoon. As the east-facing room can receive direct sunlight during morning times on the equinox and the solstices, the time of 9 a.m. for such critical days was simulated to depict the worst condition of glare in the test room. As shown in Table 6, the DGP values recorded by the base model, in the three different days, were more than 0.5, which was perceived as intolerable glare; however, type 15 could successfully reduce this value to be less than 0.4, representing a perceptible glare range. Besides, the base model recorded CGI of higher than 28 in the east-facing room; nevertheless, the optimum type significantly decreased CGI values to be slightly higher than the recommended upper threshold for the perceptible glare range. For the west orientation, the afternoon was the most critical time of glare in the test room for all the studied days when the base model yielded disturbing glare on 21 March, intolerable glare on 22 June, and 22 December. However, type 15 could substantially change the glare status into imperceptible on 21 March, perceptible on 22 June, and 22 December. Accordingly, the CGI values were also reduced from 26.03 to 21.51 (at 9 a.m.), 27.31 to 22.01 (at 12 p.m.), and 27.63 to 22.20 (at 3 p.m.), by the optimum type in the west-facing room.
Table 5. Comparison of the base and optimum models in terms of illuminance metrics (EWPI, TDI, and IUR)
|
Type |
Results |
Date & Time |
||||||||||
|
21- March |
22- June |
22- December |
||||||||||
|
9 a.m. |
12 p.m. |
3 p.m. |
9 a.m. |
12 p.m. |
3 p.m. |
9 a.m. |
12 p.m. |
3 p.m. |
||||
|
North |
Base Model |
Simulated Indoor Illuminance |
|
|||||||||
|
Mean EWPI (lx) |
1483 |
808 |
944 |
2863 |
2961 |
2644 |
818 |
644 |
634 |
|||
|
TDI (%) |
32 |
58 |
53 |
18 |
25 |
27 |
53 |
63 |
60 |
|||
|
IUR |
0.08 |
0.07 |
0.09 |
0.08 |
0.06 |
0.05 |
0.06 |
0.09 |
0.08 |
|||
|
Optimum Model |
Optimum test case |
Type 15 |
Type 9 |
Type 11 |
Type 15 |
Type 15 |
Type 15 |
Type 9 |
Type 9 |
Type 9 |
||
|
Simulated Indoor Illuminance |
||||||||||||
|
Mean EWPI (lx) |
379 |
512 |
340 |
410 |
513 |
447 |
552 |
424 |
420 |
|||
|
TDI (%) |
96 |
76 |
58 |
72 |
64 |
69 |
70 |
72 |
74 |
|||
|
IUR |
0.14 |
0.15 |
0.16 |
0.15 |
0.13 |
0.14 |
0.15 |
0.19 |
0.17 |
|||
|
% Decrement in EWPI |
74 |
37 |
64 |
86 |
83 |
83 |
33 |
34 |
34 |
|||
|
% Improvement in TDI |
200 |
31 |
9 |
300 |
156 |
156 |
32 |
14 |
23 |
|||
|
% Improvement in IUR |
75 |
114 |
78 |
88 |
117 |
180 |
150 |
111 |
113 |
|||
|
South |
Base Model |
Simulated Indoor Illuminance |
||||||||||
|
Mean EWPI (lx) |
1520 |
880 |
1023 |
1111 |
730 |
750 |
2233 |
3081 |
2558 |
|||
|
TDI (%) |
31 |
56 |
51 |
46 |
59 |
57 |
27 |
27 |
27 |
|||
|
IUR |
0.08 |
0.09 |
0.07 |
0.09 |
0.11 |
0.10 |
0.09 |
0.07 |
0.09 |
|||
|
Optimum Model |
Optimum test case |
Type 15 |
Type 9 |
Type 11 |
Type 11 |
Type 9 |
Type 9 |
Type 15 |
Type 15 |
Type 15 |
||
|
Simulated Indoor Illuminance |
||||||||||||
|
Mean EWPI (lx) |
229 |
561 |
368 |
420 |
480 |
499 |
317 |
526 |
425 |
|||
|
TDI (%) |
71 |
74 |
62 |
69 |
77 |
73 |
69 |
63 |
63 |
|||
|
IUR |
0.15 |
0.18 |
0.17 |
0.19 |
0.21 |
0.21 |
0.17 |
0.15 |
0.16 |
|||
|
% Decrement in EWPI |
85 |
36 |
64 |
62 |
34 |
33 |
86 |
83 |
83 |
|||
|
% Improvement in TDI |
129 |
32 |
22 |
50 |
31 |
28 |
156 |
133 |
133 |
|||
|
% Improvement in IUR |
88 |
100 |
143 |
111 |
91 |
110 |
89 |
114 |
78 |
|||
|
East |
Base Model |
Simulated Indoor Illuminance |
||||||||||
|
Mean EWPI (lx) |
10228 |
1738 |
576 |
8040 |
1731 |
701 |
5818 |
1495 |
612 |
|||
|
TDI (%) |
0 |
40 |
65 |
0 |
35 |
58 |
0 |
39 |
60 |
|||
|
IUR |
0.06 |
0.05 |
0.08 |
0.06 |
0.05 |
0.09 |
0.07 |
0.08 |
0.09 |
|||
|
Optimum Model |
Optimum test case |
Type 15 |
Type 11 |
Type 9 |
Type 15 |
Type 11 |
Type 9 |
Type 15 |
Type 11 |
Type 9 |
||
|
Simulated Indoor Illuminance |
||||||||||||
|
Mean EWPI (lx) |
1735 |
498 |
376 |
1337 |
554 |
463 |
956 |
539 |
409 |
|||
|
TDI (%) |
45 |
77 |
69 |
54 |
72 |
75 |
63 |
74 |
74 |
|||
|
IUR |
0.11 |
0.12 |
0.15 |
0.11 |
0.13 |
0.16 |
0.12 |
0.15 |
0.17 |
|||
|
% Decrement in EWPI |
83 |
71 |
35 |
83 |
70 |
34 |
84 |
64 |
33 |
|||
|
% Improvement in TDI |
--- |
92 |
6 |
--- |
106 |
29 |
--- |
90 |
23 |
|||
|
% Improvement in IUR |
83 |
140 |
88 |
83 |
160 |
78 |
71 |
88 |
89 |
|||
|
West |
Base Model |
Simulated Indoor Illuminance |
||||||||||
|
Mean EWPI (lx) |
790 |
566 |
3473 |
825 |
842 |
3280 |
614 |
786 |
2867 |
|||
|
TDI (%) |
52 |
66 |
24 |
55 |
55 |
21 |
61 |
58 |
25 |
|||
|
IUR |
0.09 |
0.10 |
0.07 |
0.09 |
0.10 |
0.06 |
0.08 |
0.07 |
0.05 |
|||
|
Optimum Model |
Optimum test case |
Type 9 |
Type 9 |
Type 15 |
Type 9 |
Type 9 |
Type 15 |
Type 9 |
Type 9 |
Type 15 |
||
|
Simulated Indoor Illuminance |
||||||||||||
|
Mean EWPI (lx) |
528 |
364 |
608 |
558 |
550 |
548 |
418 |
518 |
477 |
|||
|
TDI (%) |
70 |
66 |
67 |
73 |
73 |
70 |
72 |
74 |
69 |
|||
|
IUR |
0.16 |
0.19 |
0.13 |
0.19 |
0.19 |
0.13 |
0.18 |
0.16 |
0.13 |
|||
|
% Decrement in EWPI |
33 |
36 |
82 |
32 |
35 |
83 |
32 |
34 |
83 |
|||
|
% Improvement in TDI |
35 |
0 |
179 |
33 |
33 |
233 |
18 |
28 |
176 |
|||
|
% Improvement in IUR |
78 |
90 |
86 |
111 |
90 |
117 |
125 |
129 |
160 |
|||
Based on the results of the simulation experiments, the base model, which represents a typical layout, bare window without shadings, in a home office room in the ERABs, recorded an excessively high indoor daylight level, poor daylight distribution uniformity, and discomfort glare. In this instance, the mean indoor daylight level recorded in the test room, with an eastern window in the morning, could be over ten klx, daylight distribution uniformity was as low as 0.06, and daylight glare probability with the value of 0.58 represented an intolerable situation in terms of glare. According to Mousavi et al. [88], this situation of visual discomfort in ERABs can force users to prevent indoor workspaces from intense sunlight penetration by pulling internal shadings down, resulting in high dependency on electric lighting during the daytime. Therefore, implementing daylighting strategies for providing visual comfort, in ERABs under tropical climates, is necessary to decrease high indoor daylight quantity and improve indoor daylight quality.
This paper proposed various design layouts to retrofit indoor daylighting by successfully reducing intense daylight levels while still improving its quality. Based on the findings of this research in Table 5, layouts 9, 11, and 15 are perceived to be the optimum types of indoor daylighting for different positions of the sun in the tropical sky. The common feature of the proposed optimum types was that all included at least an internal shading device. Hence, internal shading devices play a significant role in providing efficient daylighting in existing buildings in tropical climates. This is in line with previous studies that claimed internal shading devices are significant components for efficient tropical daylighting [89, 90]. The other common feature of the proposed optimum type was the partial Venetian blind that is significant for tropical daylighting in existing buildings. Several daylighting studies in tropical regions proved that an internal light shelf could considerably enhance daylighting performances in open-plan buildings, as it can uniformly distribute daylight and provide acceptable daylight levels for areas far from windows [74, 75, 91, 92]. However, this study claimed that those test cases with only an internal light shelf (types 5-8) could not provide efficient daylighting in closed-plan buildings. Thus, the use of internal light shelves might be more beneficial in buildings with an open-plan design in which the depth of room is higher than the rule of thumb recommended 2.5 times the size of the window-head-height (the maximum depth of a daylit space from a side-lit window) [93]. Nevertheless, this paper proves that a partial Venetian blind is more efficient than a single light shelf to control daylight penetration in buildings with the closed-plan design that has the potential to be illuminated entirely by daylight, particularly for spaces near to the window.
Table 6. Comparison of the base and optimum models in terms of glare metrics (DGP and CGI)
|
Type |
Date & Time |
22 Jun at 9 a.m. |
22 Jun at 12 p.m. |
22 Jun at 3 p.m. |
||
|
North |
Base Model (Type 1) |
|||||
|
DGP |
0.46 |
0.42 |
0.47 |
|||
|
CGI |
26.79 |
26.02 |
27 |
|||
|
Optimum Model (Type 15) |
||||||
|
DGP |
0.34 |
0.31 |
0.35 |
|||
|
CGI |
21.81 |
21.13 |
21.92 |
|||
|
South |
Base Model (Type 1) |
Date & Time |
22 Dec at 9 a.m. |
22 Dec at 12 p.m. |
22 Dec at 3 p.m. |
|
|
DGP |
0.46 |
0.44 |
0.49 |
|||
|
CGI |
26.82 |
26.17 |
27.43 |
|||
|
Optimum Model (Type 15) |
||||||
|
DGP |
0.34 |
0.33 |
0.36 |
|||
|
CGI |
21.73 |
21.56 |
22.19 |
|||
|
East |
Base Model (Type 1) |
Date & Time |
21 Mar at 9 a.m. |
22 Jun at 9 a.m. |
22 Dec at 9 a.m. |
|
|
DGP |
0.58 |
0.54 |
0.52 |
|||
|
CGI |
29.28 |
28.24 |
28.06 |
|||
|
Optimum Model (Type 15) |
||||||
|
DGP |
0.38 |
0.37 |
0.37 |
|||
|
CGI |
22.91 |
22.54 |
22.45 |
|||
|
West |
Base Model (Type 1) |
Date & Time |
21 Mar at 3 p.m. |
22 Jun at 3 p.m. |
22 Dece at 3 p.m. |
|
|
DGP |
0.42 |
0.48 |
0.49 |
|||
|
CGI |
26.03 |
27.31 |
27.63 |
|||
|
Optimum Model (Type 15) |
||||||
|
DGP |
0.33 |
0.36 |
0.36 |
|||
|
CGI |
21.51 |
22.01 |
22.20 |
|||
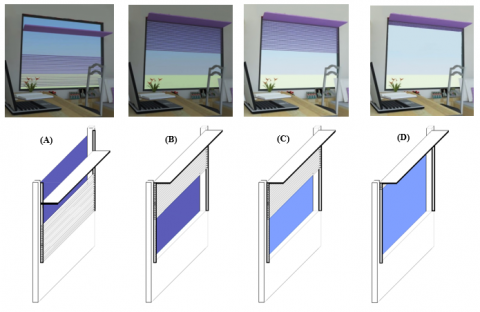
Figure 10. Adjustable model of internal shadings for efficient daylighting in tropical climates
Several studies proposed a fixed internal shading device as an effective daylighting strategy in buildings [65, 74, 82, 89, 94]. However, due to the dynamic conditions of tropical skies, changing from time to time, and various locations of the sun relative to a side-lit window, this research proves that a fixed internal shading model could not be efficient for different times, even during a single day. This statement was clearly illustrated in Table 3, in which different layouts, types 15 (in the morning), 11 (at noon), and 9 (in the afternoon), were chosen as the optimum test case in the east-facing room on 22 December. Thus, fixed internal shadings are not practical in having acceptable daylighting performance in buildings under tropical skies. This study revealed that types 9, 11, and 15 were chosen as the optimum test cases among all for efficient tropical daylighting during critical times and various orientations. A similar feature of these three layouts is that they possess the upper threshold of reflectance (90/60/35: ceiling/walls/floor) for the interior surfaces since high reflectance values of interior surfaces result in lower contrast and higher daylight uniformity in buildings. Thus, by using high reflectance values for interior surfaces, better daylighting performance can be achieved in closed-plan buildings.
The simulation results showed that when the test room experienced direct sunlight, e.g., the east-facing room in the morning on 21 March, type 15, with a tinted window glazing and an integrated Venetian blind with the light shelf, could provide efficient daylighting under the tropical sky. During times of diffused or indirect light in buildings, e.g., the east-facing room in the afternoon on 21 March, type 9, with a clear glazing film and a partial Venetian blind, is a practical choice for tropical daylighting. Besides, when the sun rays do not travel directly into the test room, but the room still receives indirect sunlight, e.g., the east-facing room at midday on 21 March that whole light could be obtained from the southern façade, type 11 with a tinted window glazing and a partial Venetian blind, is a beneficial layout for efficient tropical daylighting. Overall, types 9, 11, and 15 were the optimum layouts for tropical daylighting when the test room receives faint indirect sunlight, bright indirect sunlight, and direct sunlight, respectively. It can be concluded that tinted window glazing can significantly reduce the transmission of sunlight rays in buildings and reflect more sunlight outside compared with the clear window glazing. Hence, tinted glazing is more applicable to be used when the room receives direct sunlight. Nevertheless, when the room receives diffused or indirect light, the tinted glazing creates a dimly lit area, especially at the rear space of the room. In contrast, clear glazing welcomes daylight in a better way and provides more view appreciation than the tinted film.
The study showed that a constant VTV for window glazing is inefficient for tropical daylighting due to inconstant cloud formations of tropical skies. Accordingly, electrochromic glass, which can be changed from clear (light) to tinted (dark) and back again, might be a worthy choice to be used for windows in buildings within tropical regions as it is undergone reversible changes in shade or colour when it exposed to sunlight with different intensity. However, the influence of these changes on other parameters can be considered in future research. Besides, internal shading devices should also be dynamic to provide efficient tropical daylighting during different times of the day. Therefore, this paper proposed a dynamic model including the integrated light shelf with partial Venetian blind and electrochromic glazing, as shown in Figure 10. This conceptual model represents four flexible adjustments for different conditions. It can be adjusted to position A when a room obtains direct sunlight; position B and C, when the room receives bright indirect sunlight and faint indirect sunlight, respectively. Whenever glare is not an acute issue, the design model could be rolled up to provide a better view and more daylight penetration, as shown in position D. This proposed model can be installed on a windowpane and might be manually controlled following the users’ needs. More professionally, this dynamic model also has the potential to be operated by an automated system including sensors that respond to external illuminance during different conditions of tropical skies.
This paper focused on both quantitative and qualitative daylighting performances through interior retrofit in ERABs within a tropical region. The research proposed an adjustable model of internal shading to enhance tropical daylighting in typical home offices in the ERABs. Different adjustments of this model can be efficient for various times and orientations in tropical regions. The proposed shading control is only a conceptual model, whereas the way of its operation, its sub-variables such as reflectance value, angle, depth, and the number of shelf or slats demand further investigations. Besides, social surveys are essential to be carried out to check its socio-cultural acceptability in home office buildings, and also to show how the proposed model can be effectively marketed. Although this article focused on daylighting design to improve visual comfort, providing suitable indoor daylighting, by preventing direct sunlight rays, will indeed lower energy consumption by reducing heat gain and the use of electric lighting. However, more research is required on the thermal behaviour of the proposed shading control under tropical skies.
The authors would like to acknowledge the Ministry of Higher Education Malaysia (MOHE) for awarding a Malaysian International Scholarship (MIS).
[1] Li, D.H.W., Lam, J.C., Wong, S.L. (2002). Daylighting and its implications to overall thermal transfer value (OTTV) determinations. Energy, 27(11): 991-1008. https://doi.org/10.1016/S0360-5442(02)00067-1
[2] Mousavi, S.M., Khan, T.H., Javidi, B. (2013). Environmentally sustainable affordable design elements in housing in the context of Malaysia: Focus on middle income group. Life Science Journal, 10(3): 1138-1148.
[3] Li, D.H.W., Lam, J.C. (2001). Evaluation of lighting performance in office buildings with daylighting controls. Energy and Buildings, 33(8): 793-803. https://doi.org/10.1016/S0378-7788(01)00067-6
[4] Baker, N., Steemers, K. (2003). Energy and Environment in Architecture: A Technical Design Guide. Taylor & Francis.
[5] Zain-Ahmed, A., Sopian, K., Othman, M.Y.H., Sayigh, A.A.M., Surendran, P.N. (2002). Daylighting as a passive solar design strategy in tropical buildings: a case study of Malaysia. Energy Conversion Management, 43(13): 1725-1736. http://dx.doi.org/10.1016/S0196-8904(01)00007-3
[6] Tzempelikos, A., Athienitis, A.K. (2007). The impact of shading design and control on building cooling and lighting demand. Solar Energy, 81(3): 369-382. https://doi.org/10.1016/j.solener.2006.06.015
[7] Kim, G., Kim, J.T. (2010). Healthy-daylighting design for the living environment in apartments in Korea. Building and Environment, 45(2): 287-294. https://doi.org/10.1016/j.buildenv.2009.07.018
[8] Alzoubi, H., Bataineh, R.F. (2010). Pre-versus post-occupancy evaluation of daylight quality in hospitals. Building and Environment, 45(12): 2652-2665. https://doi.org/10.1016/j.buildenv.2010.05.027
[9] Choi, J.H., Beltran, L.O., Kim, H.S. (2012). Impacts of indoor daylight environments on patient average length of stay (ALOS) in a healthcare facility. Building and Environment, 50: 65-75. https://doi.org/10.1016/j.buildenv.2011.10.010
[10] Galasiu, A.D., Veitch, J.A. (2006). Occupant preferences and satisfaction with the luminous environment and control systems in daylit offices: A literature review. Energy and Buildings, 38(7): 728-742. https://doi.org/10.1016/j.enbuild.2006.03.001
[11] Lam, J.C. (2000). Energy analysis of commercial buildings in subtropical climates. Building and Environment, 35(1): 19-26.
[12] Ibrahim, N., Zain-Ahmed, A. (2007). Daylight availability in an office interior due to various fenestration options. 2nd PALENC Conference and 28th AIVC Conference on Building Low Energy Cooling and Advanced Ventilation Technologies in the 21st Century, Crete Island, Greece.
[13] Fadzil, S.F.S., Sia, S.J. (2004). Sunlight control and daylight distribution analysis: the KOMTAR case study. Building and Environment, 39(6): 713-717. https://doi.org/10.1016/j.buildenv.2003.12.009
[14] Dahlan, N.D., Jones, P.J., Alexander, D.K., Salleh, E., Alias, J. (2009). Daylight ratio, luminance and visual comfort assessments in typical Malaysian hostels. Indoor and Built Environment, 18(4): 319-335. https://doi.org/10.1177%2F1420326X09337041
[15] Lim, Y.W., Kandar, M.Z., Ahmad, M.H., Ossen, D.R., Abdullah, A.M. (2012). Building façade design for daylighting quality in typical government office building. Building and Environment, 57: 194-204. https://doi.org/10.1016/j.buildenv.2012.04.015
[16] Whitehead, R. (2009). Residential Lighting a Practical Guide to Beautiful and Sustainable Design Second Edition, John Wiley&Sons. Inc.
[17] Bateman, L. (2000). Home-work. Work Study, 49(5): 198-200.
[18] Kanarek, L. (2001). Home Office Life: Making a Space to Work at Home. Rockport Publishers.
[19] Sulaiman, R., Shariff, S.S.M., Ahmad, M.S. (2009). The e-business potential for home-based businesses in Malaysia: A qualitative study. International Journal of Cyber Society and Education, 2(1): 21-36.
[20] Sulaiman, R., Shariff, S.S.M. (2012). The Transformation of Home-Based Businesses into electronic-Home-Based Businesses. International Conference on Economics, Business Innovation.
[21] Mangkuto, R.A., Koerniawan, M.D., Paramita, B. (2020). The impact of courtyard and street canyon surroundings on global illuminance and estimated UV index in the tropics. Journal of Daylighting. https://doi.org/10.15627/jd.2020.16
[22] Sulaiman, R. (2011). Developing a Malaysian Electronic Home-Based Businesses Pre-Implementation Framework. Ph.D. Thesis, Universiti Tenaga Nasional, Malaysia.
[23] Rahim. (2010). SOHO (Small Office Home Office). Rahim & Co International Property Consultants. http://rahim-co.com/art6.htm.
[24] Mousavi, S.M., Khan, T.H., Lim, Y.W. (2016). A critical review of user fit-out in habitable rooms in high-rise residential apartments in Malaysia. Asian Social Science, 12(2). https://doi.org/10.5539/ass.v12n2p184
[25] Cheng, C.L., Chen, C.L., Chou, C.P., Chan, C.Y. (2007). A mini-scale modeling approach to natural daylight utilization in building design. Building and Environment, 42(1): 372-384. http://dx.doi.org/10.1016%2Fj.buildenv.2005.08.004
[26] Karlsen, L., Heiselberg, P., Bryn, I., Johra, H. (2015). Verification of simple illuminance based measures for indication of discomfort glare from windows. Building and Environment, 92: 615-626. http://dx.doi.org/10.1016/j.buildenv.2015.05.040
[27] Chia, S.L. (2008). Minimizing solar insulation in high-rise buildings through self-shaded form. Journal of Applied Sciences, 12: 897-901.
[28] Husin, S.N.F.S., Harith, Z.Y.H. (2012). The performance of daylight through various type of fenestration in residential building. Procedia-Social and Behavioral Sciences, 36: 196-203. https://doi.org/10.1016/j.sbspro.2012.03.022
[29] Mahdavi, A., Rao, S.P., Inangda, N. (2013). Orientation Effects on Daylighting in High-Rise Office Buildings in Malaysia: A simulation study.
[30] Mansour, A., Sopian, K., Zain-Ahmed, A., Reimann, G. (2006). Daylight distribution of a new design for future commercial office building in Malaysia. ISESCO Sci Technol Vis, 2(1): 53e6.
[31] Lim, Y.W., Mohd Hamdan, A., Ossen, D.R. (2009). Effect of solar shading, fenestration and room geometry on office building energy efficiency in hot humid tropic. 3rd International Conference on Built Environment in Developing Countries, pp. 2-3.
[32] Fuziah, S., Azni, Z.A., Shuzlina, A.R., Adizul, A. (2004). Daylight modelling and thermal performance of atrium of new MECM building at Putrajaya. The Journal of the Institution of Engineers, Malaysia, 65(3/4): 33-42.
[33] Ibrahim, N., Zain-Ahmed, A., Commercialisation, U.T. (2006). A simple prediction tool for energy savings due to daylighting in Malaysia. Journal Science & Technology Vision, 2(1): 25-29.
[34] Mahdavi, A., Rao, S.P., Inangda, N. (2013). Parametric Studies on Window-To-Wall Ratio for Passive Design Optimisation of Day lighting in High-Rise Office Buildings in Kuala Lumpur, Malaysia. Journal of Design and Built Environment.
[35] Nedhal, A.T., Syed, F.S.F., Adel, A. (2016). Relationship between window-to-floor area ratio and single-point daylight factor in varied residential rooms in Malaysia. Indian Journal of Science and Technology, 9(33): 1-8. http://dx.doi.org/10.17485/ijst/2016/v9i33/86216
[36] Gugliermetti, F., Bisegna, F. (2006). Daylighting with external shading devices: design and simulation algorithms. Building and Environment, 41(2): 136-149. http://dx.doi.org/10.1016/j.buildenv.2004.12.011
[37] Wong, N.H., Istiadji, A.D. (2004). Effect of external shading devices on daylighting penetration in residential buildings. Lighting Research & Technology, 36(4): 317-330. http://dx.doi.org/10.1191/1365782804li126oa
[38] Al-Tamimi, N.A., Fadzil, S.F.S. (2011). The potential of shading devices for temperature reduction in high-rise residential buildings in the tropics. Procedia Engineering, 21: 273-282. https://doi.org/10.1016/j.proeng.2011.11.2015
[39] Mayhoub, M.S., Carter, D.J. (2011). The costs and benefits of using daylight guidance to light office buildings. Building and Environment, 46(3): 698-710. http://dx.doi.org/10.1016/j.buildenv.2010.09.014
[40] Maier, A.E. (2016). Daylight as starting point for retrofitting residential buildings and cities. Acta Technica Napocensis: Civil Engineering & Architecture, 58(4).
[41] Jamaludin, A.A., Hussein, H., Keumalab, N., Ariffinb, A.R.M. (2017). Post occupancy evaluation of residential college building with bioclimatic design strategies in tropical climate condition of Malaysia. Jurnal Teknologi, pp. 113-122. https://doi.org/10.11113/jt.v79.5607
[42] Jamaludin, A.A., Mahmood, N.Z., Keumala, N., Ariffin, A.R.M., Hussein, H. (2013). Energy audit and prospective energy conservation: Studies at residential college buildings in a tropical region. Facilities, 31(3/4): 158-173. https://doi.org/10.1108/02632771311299430
[43] Ghasemi, M., Kandar, M.Z., Noroozi, M. (2015). Investigating the effect of well geometry on the daylight performance in the adjoining spaces of vertical top-lit atrium buildings. Indoor and Built Environment, 25(6): 934-948. https://doi.org/10.1177%2F1420326X15589121
[44] Dalumo, D.B., Lim, Y.W. (2021). Comparative study on computer simulation of solar shading performance with heliodon and artificial sky. Journal of Daylighting, 8(1): 50-64. https://doi.org/10.15627/jd.2021.4
[45] Freewan, A.A.Y., al Dalala, J.A. (2020). Assessment of daylight performance of advanced daylighting strategies in large university classrooms; case study classrooms at JUST. Alexandria Engineering Journal, 59(2):791-802. https://doi.org/10.1016/j.aej.2019.12.049
[46] Solmaz, A.S. (2019). A critical review on building performance simulation tools. Alam Cipta, 12(2): 7-21.
[47] Zain-Ahmed, A., Sopian, K., Abidin, Z.Z., Othman, M.Y.H. (2002). The availability of daylight from tropical skies—A case study of Malaysia. Renewable Energy, 25(1): 21-30. https://doi.org/10.1016/S0960-1481(00)00209-3
[48] Linhart, F., Wittkopf, S.K., Scartezzini, J.L. (2010). Performance of anidolic daylighting systems in tropical climates–parametric studies for identification of main influencing factors. Solar Energy, 84(7): 1085-1094. https://doi.org/10.1016/j.solener.2010.01.014
[49] Mousavi, S.M., Khan, T.H., Lim, Y.W. (2016). Empirical validation of Radiance-IES daylight simulation for furnished and unfurnished rooms under a tropical sky. International Journal of Sustainable Building Technology and Urban Development, 7(1). https://doi.org/10.1080/2093761X.2016.1167646
[50] Li, D.H.W., Lam, J.C. (2000). Solar heat gain factors and the implications to building designs in subtropical regions. Energy and Buildings, 32(1): 47-55. https://doi.org/10.1016/S0378-7788(99)00035-3
[51] Lim, Y.W. (2011). Internal shading for efficient tropical daylighting in high-rise open plan office. Ph.D. dissertation. Department of Architecture, Faculty of Built Environment, Universiti Teknologi Malaysia, Malaysia.
[52] Nikpour, M., Kandar, M.Z., Mosavi, E. (2013). Investigating daylight quality using self-shading strategy in energy commission building in Malaysia. Indoor and Built Environment, 22(5): 822-835. https://doi.org/10.1177%2F1420326X12458512
[53] Huff, C.J., Huff, J.C. (2011). Curved light shelf system for daylighting an interior space. Google Patents.
[54] Jamaludin, A.A. (2014). Performance of Bioclimatic Design Strategies at Residential College Buildings in University of Malaya. Ph.D. dissertation. Facculty of Built Environment, University of Malaya, Malaysia.
[55] Koo, S.Y., Yeo, M.S., Kim, K.W. (2010). Automated blind control to maximize the benefits of daylight in buildings. Building and Environment, 45(6): 1508-1520. http://dx.doi.org/10.1016/j.buildenv.2009.12.014
[56] Sanati, L., Utzinger, M. (2013). The effect of window shading design on occupant use of blinds and electric lighting. Building and Environment, 64: 67-76. https://doi.org/10.1016/j.buildenv.2013.02.013
[57] Konis, K. (2013). Evaluating daylighting effectiveness and occupant visual comfort in a side-lit open-plan office building in San Francisco, California. Building and Environment, 59: 662-677. http://dx.doi.org/10.1016/j.buildenv.2012.09.017
[58] Jamaludin, A.A., Keumala, N., Ariffin, A.R.M., Hussein, H. (2014). Satisfaction and perception of residents towards bioclimatic design strategies: Residential college buildings. Indoor and Built Environment, 23(7): 933-945. http://dx.doi.org/10.1177/1420326X13481614
[59] Mekhilef, S., Saidur, R., Said, S.M., Hong, P.H., Islam, M.R. (2014). Techno-economic evaluation of energy efficiency measures in high rise residential buildings in Malaysia. Clean Technologies and Environmental Policy, 16(1): 23-35. http://dx.doi.org/10.1007/s10098-013-0587-5
[60] Jamaludin, A.A., Hussein, H., Keumala, N., Ariffin, A.R.M. (2015). The dynamics of daylighting at a residential college building with the internal courtyard arrangement. International Journal of Architectural Research: ArchNet-IJAR, 9(3): 148-165. http://dx.doi.org/10.26687/archnet-ijar.v9i3.588
[61] Brain, J. (2015). 5 Considerations for Daylighting Systems in Retrofit Projects. CIRALIGHT. http://www.ciralight.com/blog/5-considerations-for-daylighting-systems-in-retrofit-projects, accessed on Jan. 18, 2019.
[62] Jughans, L. (2008). Design, elements and strategies: Daylighting. Bioclimatic Housing: Innovative Designs for Warm Climates, 345-365.
[63] Lam, J.C., Tsang, C.L., Li, D.H.W., Cheung, S.O. (2005). Residential building envelope heat gain and cooling energy requirements. Energy, 30(7): 933-951. https://doi.org/10.1016/j.energy.2004.07.001
[64] Li, D.H.W., Wong, S.L., Tsang, C.L., Cheung, G.H.W. (2006). A study of the daylighting performance and energy use in heavily obstructed residential buildings via computer simulation techniques. Energy and Buildings, 38(11): 1343-1348. https://doi.org/10.1016/j.enbuild.2006.04.001
[65] Bahdad, A.A.S., Fadzil, S.F.S., Taib, N. (2020). Optimization of daylight performance based on controllable light-shelf parameters using genetic algorithms in the tropical climate of malaysia. Journal of Daylighting, 7(1): 122-136. https://doi.org/10.15627/jd.2020.10
[66] Mirrahimi, S., Mohamed, M.F., Haw, L.C., Ibrahim, N.L.N., Yusoff, W.F.M., Aflaki, A. (2016). The effect of building envelope on the thermal comfort and energy saving for high-rise buildings in hot-humid climate. Renewable and Sustainable Energy Reviews, 53: 1508-1519. https://doi.org/10.1016/j.rser.2015.09.055
[67] Lim, G.H., Hirning, M.B., Keumala, N., Ghafar, N.A. (2017). Daylight performance and users’ visual appraisal for green building offices in Malaysia. Energy and Buildings, 141: 175-185. https://doi.org/10.1016/j.enbuild.2017.02.028
[68] Nasrollahi, N., Shokry, E. (2020). Parametric analysis of architectural elements on daylight, visual comfort, and electrical energy performance in the study spaces. Journal of Daylighting, 7(1):57-72. https://doi.org/10.15627/jd.2020.5
[69] IESNA. (1993). Lighting Handbook: Reference and Application. Illuminating Engineering Society of North America.
[70] Ward, G. (1996). Adeline 2.0-Radiance Reference Manual, Advanced Daylighting and Electric Lighting Integrated New Environment. Vol. 1: Lawrence Berkeley Laboratory.
[71] Djamila, H., Ming, C.C., Kumaresan, S. (2011). Estimation of exterior vertical daylight for the humid tropic of Kota Kinabalu city in East Malaysia. Renewable Energy, 36(1): 9-15. https://doi.org/10.1016/j.renene.2010.06.040
[72] Mousavi, S.M., Khan, T.H., Wah, L.Y. (2018). Impact of furniture layout on indoor daylighting performance in existing residential buildings in Malaysia. Journal of Daylighting, 5(1). https://doi.org/10.15627/jd.2018.1
[73] Heng, C.Y.S., Lim, Y.W., Ossen, D.R. (2020). Horizontal light pipe transporter for deep plan high-rise office daylighting in tropical climate. Building and Environment, 171: 106645. https://doi.org/10.1016/j.buildenv.2020.106645
[74] Joshua, A., Lim, Y.W. (2020). Daylighting and lighting energy saving in south-oriented open-plan office with light shelf in the tropics. European Journal of Molecular and Clinical Medicine, 7(3): 723-744.
[75] Lim, Y.W., Heng, C.Y.S. (2016). Dynamic internal light shelf for tropical daylighting in high-rise office buildings. Building and Environment, 106: 155-166. https://doi.org/10.1016/j.buildenv.2016.06.030
[76] Tools Ladybug. (n.d.). epwmap. https://www.ladybug.tools/epwmap/.
[77] Cantin, F., Dubois, M.C. (2011). Daylighting metrics based on illuminance, distribution, glare and directivity. Lighting Research and Technology, 43(3): 291-307. https://doi.org/10.1177/1477153510393319
[78] Carlucci, S., Cattarin, G., Causone, F., Pagliano, L. (2015). Multi-objective optimization of a nearly zero-energy building based on thermal and visual discomfort minimization using a non-dominated sorting genetic algorithm (NSGA-II). Energy and Buildings, 104: 378-394. https://doi.org/10.1016/j.enbuild.2015.06.064
[79] Mardaljevic, J., Heschong, L., Lee, E. (2009). Daylight metrics and energy savings. Lighting Research and Technology, 41(3): 261-283. https://doi.org/10.1177/1477153509339703
[80] Nabil, A., Mardaljevic, J. (2006). Useful daylight illuminances: A replacement for daylight factors. Energy and Buildings, 38(7): 905-913. https://doi.org/10.1016/j.enbuild.2006.03.013
[81] Dubois, M.C. (2001). Impact of solar shading devices on daylight quality: simulations with radiance. Division of Energy and Building Design, Lund University, Sweden.
[82] Ho, M.C., Chiang, C.M., Chou, P.C., Chang, K.F., Lee, C.Y. (2008). Optimal sun-shading design for enhanced daylight illumination of subtropical classrooms. Energy and Buildings, 40(10): 1844-1855. https://doi.org/10.1016/J.ENBUILD.2008.04.012
[83] Carlucci, S., Causone, F., de Rosa, F., Pagliano, L. (2015). A review of indices for assessing visual comfort with a view to their use in optimization processes to support building integrated design. In Renewable and Sustainable Energy Reviews, 47: 1016-1033. https://doi.org/10.1016/j.rser.2015.03.062
[84] Jakubiec, J.A., Reinhart, C.F. (2012). The ‘adaptive zone’-A concept for assessing discomfort glare throughout daylit spaces. Lighting Research and Technology, 44(2): 149-170. https://doi.org/10.1177/1477153511420097
[85] Suk, J.Y., Schiler, M., Kensek, K. (2013). Development of new daylight glare analysis methodology using absolute glare factor and relative glare factor. Energy and Buildings, 64: 113-122. https://doi.org/10.1016/j.enbuild.2013.04.020
[86] Costanzo, V., Evola, G., Marletta, L., Nascone, F.P. (2018). Application of climate based daylight modelling to the refurbishment of a school building in sicily. Sustainability (Switzerland), 10(8): 2653. https://doi.org/10.3390/su10082653
[87] Pierson, C., Wienold, J., Bodart, M. (2018). Daylight discomfort glare evaluation with evalglare: Influence of parameters and methods on the accuracy of discomfort glare prediction. Buildings, 8(8): 94. https://doi.org/10.3390/buildings8080094
[88] Mousavi, S.M. (2017). Interior Retrofit for Efficient Tropical Daylighting in Home Office Workspaces. Ph.D. dissertation. Department of Architecture, Universiti Teknologi Malaysia, Johor Bahru, Malaysia.
[89] Lim, Y.W., Ahmad, M.H., Ossen, D.R. (2013). Internal shading for efficient tropical daylighting in malaysian contemporary high-rise open plan office. Indoor and Built Environment, 22(6): 932-951. https://doi.org/10.1177%2F1420326X12463024
[90] Lim, Y.W., Ahmad, M.H. (2014). The effects of direct sunlight on light shelf performance under tropical sky. Indoor and Built Environment, 24(6): 788-802. https://doi.org/10.1177%2F1420326X14536066
[91] Bahdad, A.A.S., Fadzil, S.F.S., Onubi, H.O., BenLasod, S.A. (2021). Multi-dimensions optimization for optimum modifications of light-shelves parameters for daylighting and energy efficiency. International Journal of Environmental Science and Technology. https://doi.org/10.1007/s13762-021-03328-9
[92] Zazzini, P., Romano, A., di Lorenzo, A., Portaluri, V., di Crescenzo, A. (2020). Experimental analysis of the performance of light shelves in different geometrical configurations through the scale model approach. Journal of Daylighting, 7(1): 37-56. https://doi.org/10.15627/jd.2020.4
[93] Reinhart, C.F. (2005). A simulation-based review of the ubiquitous window-headheight to daylit zone depth rule-of-thumb. IBPSA 2005 - International Building Performance Simulation Association 2005, 1011-1018.
[94] Mousavi, S.M., Khan, T.H., Lim, Y.W., Mohammadi, A. (2021). Impact of internal shading controls on efficient daylighting in home-office workspaces in tropical climates. Jurnal Teknologi, 83(6): 141-156. https://doi.org/10.11113/jurnalteknologi.v83.16635