Adem Dreshaj | Bedri Millaku* | Elvis Elezaj | Bekë Kuqi
© 2021 IIETA. This article is published by IIETA and is licensed under the CC BY 4.0 license (http://creativecommons.org/licenses/by/4.0/).
OPEN ACCESS
The purpose of this research is to determine the content of heavy metals in the lakes of Kosovo, lakes with heavy metals such as: (Hg, Cd, Pb, As, Fe, Zn, Ni, Cu), in water and water sediment in Lake Radoniq and Lake Badovc. Determination of heavy metals (Pb, Cd, Hg, As), in muscle tissue and fish organs. Parameters as an indicator of fish safety for food, indicator of environmental pollution (Kosovo lake bioten). Age of fish, the amount of fat are important factors that affect the accumulation of heavy metals in fish. This indicates that the bioaccumulation of heavy metals is a special process and indicates the concentration of heavy metals in the body of the fish. The high concentration of Fe in fish organs is of particular importance for hemoglobin and its role in fish. Metal indicators such as biocumulation factors are different, for example, for Pb can be increased with high concentrations compared to international parameters which depends on the species of fish and the location of catching s137 fish, the concentration of heavy metals in the Lake and the impacts from agricultural activities. The concentration of heavy metals in the body of aquatic life depends on the way in which heavy metals penetrate, giving the body the opportunity to detoxify them through metabolism. Metabolism means the exchange of substances, the uninterrupted exchange of matter between the living organism and the external environment. This process is the basis of life, which allows a cell to grow and reproduce, maintain its structure and respond to its environment.
heavy metals, fish and biotic pollution
Human intervention in natural ecosystems disrupts the life chain [1]. The amount of heavy metal concentration in fish organs as in muscle tissue, the content in the digestive tract and liver, indicate that the content of heavy metals in the digestive tract, liver and fish muscles [2]. The results show that the place of capture of the fish has a significant impact on the content of arsenic and heavy metals in muscle tissue, digestive tract and liver of the fish [3]. Analytical research shows that the content of arsenic and other heavy metals in water and sediments, simultaneously indicate the safety of fish as food and may be an indicator of environmental pollution [4]. Absorption of heavy metals through fish gills has a significant impact on the content of heavy metals in the gills. The gills, as well as the organs of the digestive tract, are active metabolic parts [5]. Accumulation of heavy metals, as evidenced in various species of fish [6]. Muscle tissue contains fewer heavy metals than gums and internal organs [7]. In the intestinal tract, in the mucosa are found heavy metals, from which they cannot be removed during the preparation of the sample, which in turn affects the increase in the content of heavy metals in the digestive tract [8].
Metabolism as a biochemical phenomenon: Active metabolism is the energy needed for physical activity, it is worth noting that the more a living thing moves, the faster the metabolic process takes place [9]. The opinion of STARLING which says that any physiological problem can also be a biochemical problem and vice versa [10]. Thinkers have preoccupied themselves with questions such as, "What is life?" What happens in the body in the process of its vital activity? How does the organism interact with the external environment, etc.? The study of the chemical composition of living organisms, of living matter, and the study of the chemical processes of metabolism of substances in living organisms are vital processes [11].
In living organisms, many substances with inorganic (mineral) nature have been found, such as Ca, P, Na, K, microelements, Fe, then ultra-micro elements, Cu, Zn, Fe, Co, etc., [12]. Biochemical dynamics or the science of metabolism explores the decomposition, conversion, motility and synthesis of some inorganic and organic compounds as components of revision from the moment of absorption (entry into the blood or lymph), to the moment of excretion through the kidneys, lungs, sweat glands and colon [13].
Leaden: The main sources of lead pollution are metallurgy (lead), gasoline lead additives (tetraethyl lead), the use of lead dyes, and lead-type pesticides [14]. About 90% of the body's load on lead is in the bone which has negative effects on health [9]. Lead is released into the human body through the mouth, breath and skin (0.08 - 0.12 mg / kg) and urine (0.04 mg / l).
Cadmium: The most important source of cadmium in the air is industrial plants. Other sources of anthropogenic origin include phosphate fertilizers, containing up to 35 mg / kg phosphorus pentoxide [15]. Atmospheric precipitation is another major source of cadmium in the environment [3]. The liver and kidneys concentrate more Cd than other parts of the body. Cadmium is concentrated at 8 µg / g in marine species and 3 μg / g in salmon meat. Cadmium accumulates mainly in crab hepatopancreas and levels of 30-50 ppm.
Mercury: mercury in the food chain is introduced through atmospheric precipitation enters the lakes, accumulates in the sediments of the lakes [16]. Transformation of Hg by bacteria such as mercury methyl (CH3Hg +), which is highly toxic. From methyl water sediments, mercury enters food chains that accumulate in the fat of animals with bioaccumulation, reaching high levels in animals towards the top of the food chain, such as fish.
Arsenic: Arsenic is naturally present in the soil and is present in the air in the form of dust particles. The composition of arsenic gases (alkyl arsenic) can be released from the soil as a result of biogenic processes. The use of arsenic in agriculture and industry also contributes to its release into the atmosphere. Estimates of annual emissions from anthropogenic sources averaged 18,900 metric tons. The average daily air intake ranges from 0.0003 to 0.0004 µg / kg body weight per day.
Bioaccumulation: Fish, being the most developed species in freshwater, is the best indicator of the concentration of heavy metals in water. Bioaccumulation can be due to bioconcentration (absorption from the food chain), or biomagnification (Biomagnification is a process of transferring pollutants that cannot be degraded by the environment, usually in the form of high-risk pesticides such as DDT, e which follows the direction of the food chain). As a parameter for determining the amount of pollutants by bioaccumulation, the coefficient of separation between water and fish meat can be used [17]. The greatest bioaccumulation is between water and algae at the end of the food chain, which has a high effect on the concentration of heavy fish metals. Analyzing heavy metals in fish, it is important to examine the internal organs (liver, kidneys, spleen), as these provide real data on fish pollution. If the water is constantly contaminated with heavy metals, environmental hazard tests can be reliable concentrating the heavy metals in the fish muscles.
Bioconcentration: The accumulation of dangerous substances in aquatic organisms (fish) is an informative and very important criterion for the risk of introducing these substances into the human body [18]. Flora and fauna are nutritious for fish, and fish in the food chain are at a higher level in the content of heavy metals in the body because the intake of these substances from food. The high rate of mercury bioconcentration in fish meat underscores its importance in terms of its toxicity and importance in environmental pollution. Fish absorb metal ions through the gills and skin [19]. Muscles and elongated internal organs may have a high content of cadmium, mercury and lead metal.
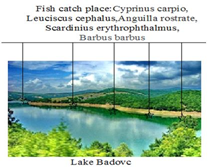
Badovci Lake is a lake which is located 5 km away from Prishtina. It is one of the main reservoirs in Kosovo for the use of drinking water and which supplies water to Prishtina and its surroundings. At full capacity, the lake is 3.5 kilometers long and 500 meters wide. The maximum depth is 30 m, and has a total volume of 26 million cubic meters of water. The catchment area of the lake is 109 km2 (42 sq mi). For testing purposes, water samples were taken from Lake Badovc in positions (A1, A2, A3, A4, A5) and sediment samples from Lake Badovc in positions (C1, C2, C3, C4, C5).
Figure 1. Place the samples Badovci Lake
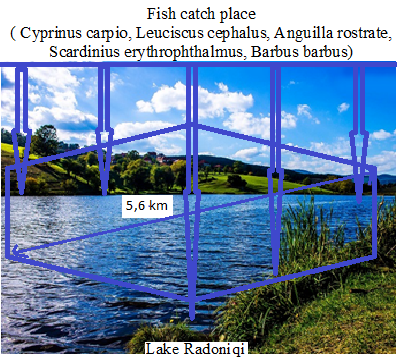
Radoniqi Lake is an artificial lake in the Municipality of Gjakova that supplies water to about 214,000 inhabitants, and is used to irrigate 10,500 ha of land. With an area of 5.62 km2. The capacity of the dam is 113 million m3. In these lakes a large number of species are cultivated, especially fish which have been used for analytical purposes for environmental studies and food safety. Samples in Lake Radoniq in positions (B1, B2, B3, B4, B5) and samples in Lake Radoniq in positions (D1, D2, D3, D4, D5).
Figure 2. Place the samples Radoniqi Lake
This research presents the findings of the study including the analysis and interpretation of the analyzed data. The data are presented in the table and interpreted following the order of the answer to the specific questions of the problem as the population grows and the industry develops, the demand for water is growing, which in turn leads to the formation of large amounts of wastewater. Polluted waters, in most cases, flow directly into the natural inflows of the lake, causing undesirable phenomena, in cases of changing the organoleptic properties of water, such as wind, taste and increased concentration of heavy metals.
Table 1. Content of heavy metals in water Lakes such as: (Zn, Ni, Fe, Pb, Cd, As, Cu, Hg)
|
Sampling point |
Content µg/kg |
||||||||
|
Zn |
Ni |
Fe |
Pb |
Cd |
As |
Cu |
Hg |
||
|
Badovci Lake |
A1 |
0.032 |
139.4 |
0.32 |
32.58 |
0.61 |
0.004 |
0.03 |
0.69 |
|
A2 |
0.022 |
145.8 |
0.29 |
33.49 |
0.77 |
0.003 |
0.04 |
0.71 |
|
|
A3 |
0.030 |
129.0 |
0.48 |
31.12 |
0.12 |
0.002 |
0.05 |
0.67 |
|
|
A4 |
0.029 |
144.1 |
0.33 |
41.23 |
0.99 |
0.004 |
0.03 |
0.77 |
|
|
A5 |
0.019 |
135.1 |
0.42 |
26.56 |
0.35 |
0.005 |
0.04 |
0.45 |
|
|
Radoniqi Lake |
B1 |
0.030 |
129.1 |
0.4 |
30.23 |
0.69 |
0.004 |
0.02 |
0.61 |
|
B2 |
0.019 |
123.8 |
0.3 |
31.11 |
0.79 |
0.004 |
0.05 |
0.48 |
|
|
B3 |
0.020 |
111.0 |
0.5 |
29.11 |
0.67 |
0.003 |
0.04 |
0.51 |
|
|
B4 |
0.049 |
112.1 |
0.3 |
33.21 |
0.79 |
0.006 |
0.06 |
0.52 |
|
|
B5 |
0.044 |
139.1 |
0.3 |
29.44 |
0.81 |
0.005 |
0.07 |
0.67 |
|
Table 2. Content of heavy sedimentary metals of Lakes such as: (Zn, Ni, Fe Pb, Cd, Hg, As, Cu, Hg)
|
Samples |
Content µg/kg /k |
||||||||
|
Zn |
Ni |
Fe |
Pb |
Cd |
As |
Cu |
Hg |
||
|
Badovci Lake |
C1 |
139.4 |
32.37 |
16104 |
32.58 |
0.61 |
8.90 |
35.95 |
0.69 |
|
C2 |
123.2 |
33.24 |
15689 |
30.12 |
0.55 |
6.10 |
32.12 |
0.56 |
|
|
C3 |
113.4 |
31.12 |
14235 |
29.23 |
0.67 |
4.29 |
41.40 |
0.44 |
|
|
C4 |
149.7 |
43.99 |
13247 |
27.99 |
0.79 |
5.47 |
33.45 |
0.39 |
|
|
C5 |
126.2 |
19.16 |
12824 |
36.27 |
0.43 |
7.18 |
34.15 |
0.41 |
|
|
Radoniqi Lake |
D1 |
270.4 |
88.42 |
17530 |
64.92 |
1.69 |
13,89 |
50.93 |
0.80 |
|
D2 |
266.2 |
67.23 |
16781 |
64.95 |
1.09 |
11.24 |
49.04 |
0.78 |
|
|
D3 |
281.4 |
62.44 |
14718 |
55.60 |
1.80 |
17.01 |
55.02 |
0.58 |
|
|
D4 |
282.2 |
51.2 |
15925 |
45.29 |
1.12 |
13.05 |
39.12 |
0.71 |
|
|
D5 |
290.0 |
49.02 |
14231 |
49.02 |
0.99 |
12.08 |
41.03 |
0.55 |
|
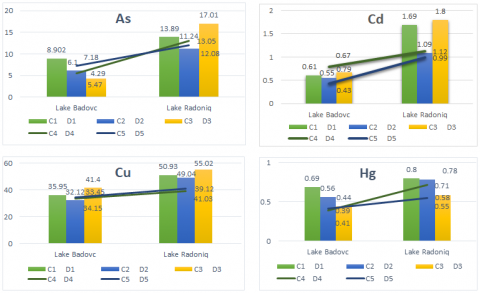
Figure 3. Graphic representation of heavy metals in the water of lakes (Cd, As, Cu, Hg)
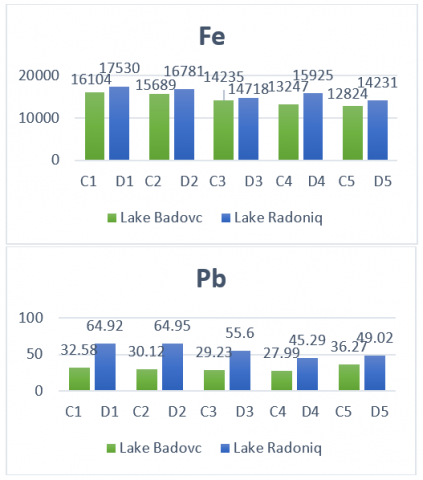
Figure 4. Graphic representation of heavy metals in the water of lakes (Zn, Ni, Fe, Pb)
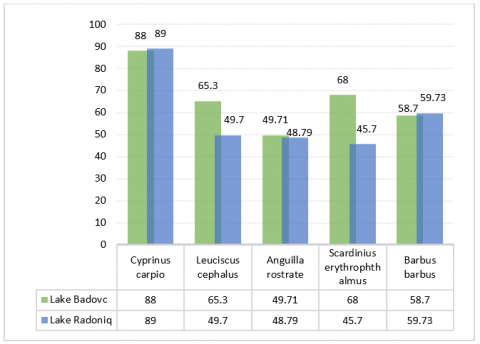
Table 3. The average weight of fish from 5 samples in Badovci Lake and 5 Samples Radon Lake: Carp (Cyprinus carpio), Mlyshi (Leuciscus cephalus), Eagle (Anguilla rostrate), Sykuqja (Scardinius erythrophthalmus), Mrena (Barbus barbus)
|
Samples |
Content g/kg |
||||
|
Cyprinus carpio |
Leuciscus cephalus |
Anguilla rostrate |
Scardinius erythrophthalmus |
Barbus barbus |
|
|
Badovci L. |
88.0 |
65.3 |
49.71 |
68.0 |
58.7 |
|
Radoniqi L. |
89.0 |
49.7 |
48.79 |
45.70 |
59.73 |
Table 4. Heavy metal content (Pb, Cd, Hg, As), in muscle tissue and liver (Cyprinus carpio)
|
Samples |
µg / kg / kg content (muscle tissue, Cyprinus carpio) |
µg / kg / kg content (liver, Cyprinus carpio) |
||||||
|
Pb |
Cd |
Hg |
As |
Pb |
Cd |
Hg |
As |
|
|
Badovci L. |
48.27 |
13.80 |
139.5 |
35.93 |
47.33 |
132.30 |
206.30 |
18.07 |
|
Radoniqi L. |
7.80 |
4.47 |
19.73 |
18.73 |
63.53 |
130.20 |
220.44 |
19.27 |
Table 5. Heavy metal content (Pb, Cd, Hg, AS) in the digestive tract and muscle tissue (Leuciscus cephalus)
|
Samples |
µg / kg / kg content (digestive tract, Leuciscus cephalus) |
µg / kg / kg content (Muscle tissue, Leuciscus cephalus) |
||||||
|
Pb |
Cd |
Hg |
As |
Pb |
Cd |
Hg |
As |
|
|
Badovci L. |
151.8 |
62.20 |
252.6 |
65.13 |
14.13 |
7.73 |
327.30 |
2.66 |
|
Radoniqi L. |
130.3 |
68.07 |
269.21 |
73.53 |
68.40 |
15.53 |
534.10 |
3.33 |
Table 6. Heavy metal content (Pb, Cd, Hg, AS) in the liver and digestive tract (Anguilla rostrate)
|
Samples |
µg / kg / kg liver content, Anguilla rostrate) |
µg / kg / kg content (digestive tract, Anguilla rostrate) |
||||||
|
Pb |
Cd |
Hg |
As |
Pb |
Cd |
Hg |
As |
|
|
L Badovcit |
105.19 |
171.11 |
181.1 |
74.03 |
33.71 |
111.1 |
152.30 |
4.20 |
|
L Radoniqit |
122.49 |
201.11 |
216.1 |
82.34 |
90.12 |
125.10 |
218.00 |
7.90 |
Table 7. Heavy metal content (Pb, Cd, Hg, AS) in muscle tissue and digestive tract (Scardinius erythrophthalmus)
|
Samples |
µg / kg / kg content (muscle tissue, Scardinius erythrophthalmus) |
µg / kg / kg content (Digestive tract, Scardinius erythrophthalmus) |
||||||
|
Pb |
Cd |
Hg |
As |
Pb |
Cd |
Hg |
As |
|
|
Badovci L. |
31.01 |
12.53 |
218.00 |
13.91 |
39.79 |
111.11 |
151.10 |
4.21 |
|
Radoniqi L. |
42.02 |
16.27 |
219.20 |
12.09 |
89.13 |
125.79 |
330.1 |
5.19 |
Table 8. Heavy metal content (Pb, Cd, Hg, AS) in the digestive tract and liver (Barbus barbus)
|
Samples |
µg / kg / kg content (digestive tract, Barbus barbus) |
µg / kg / kg content (liver tract, Barbus barbus) |
||||||
|
Pb |
Cd |
Hg |
As |
Pb |
Cd |
Hg |
As |
|
|
Badovci L. |
214.32 |
112.70 |
297.10 |
14.21 |
36.69 |
60.39 |
113.53 |
2.74 |
|
Radoniqi L. |
264.24 |
178.20 |
281.00 |
13.22 |
116.00 |
117.2 |
225.55 |
3.80 |
Figure 5. Graphical representation of the average weight of fish in sample point
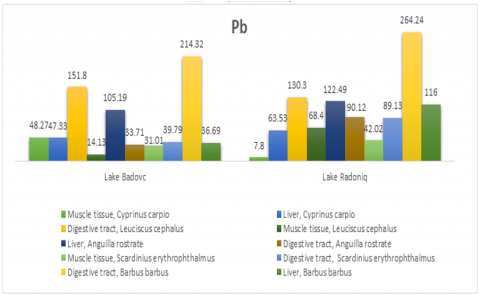
Figure 6. Graphical presentation of Pb content in carp fish (Cyprinus carpio), Mlyshi (Leuciscus cephalus), Eel (Anguilla rostrate), Sykuqja (Scardinius erythrophthalmus), Mrena (Barbus barbus)
Figure 7. Graphic presentation of Cd content in carp fish (Cyprinus carpio), Mlyshi (Leuciscus cephalus), Eel (Anguilla rostrate), Sykuqja (Scardinius erythrophthalmus), Mrena (Barbus barbus)
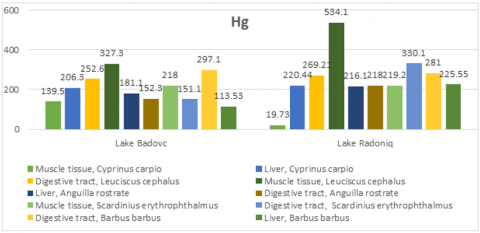
Figure 8. Graphic presentation of Hg content in carp fish (Cyprinus carpio), Mlyshi (Leuciscus cephalus), Eel (Anguilla rostrate), Sykuqja (Scardinius erythrophthalmus), Mrena (Barbus barbus)
Figure 9. Graphic representation of the contents of as in carp fish (Cyprinus carpio), Mlyshi (Leuciscus cephalus), Eel (Anguilla rostrate), Sykuqja (Scardinius erythrophthalmus), Mrena (Barbus barbus)
Analysis of the chemical composition in the water of the two lakes, the results showed that there were significant differences in the amount of heavy metals between the two lakes where the arsenic content in Lake Badovci (see Figure 1) varies from 8.9 m µg / kg / kg, in Lake Radoniqi (see Figure 2) 17.01 µg / kg / kg. From this we can conclude that the difference between the amounts of metal concentration in the study cases, specifically Lake Radoniqi (see Tables 1 and 2, Figures 3 and 4) was higher values for 8.11 µg / kg / kg than the amount of metals in Lake Badovci (see Tables 1 and 2, Figures 3 and 4). The results of heavy metals in the lake water taken as a sample to analyze the cadmium concentration in Lake Radoniqi vary from 1.8 µg / kg / kg, while in the case of sampling in Lake Badovci it varies from 0.79 µg / kg / kg (see Table 3, 8, also Figure 5). The concentration of samples taken as a case study for heavy metals is the amount of metal Cd in Lake Radoniqi turns out to be higher for the value 1.01 µg / kg / kg (see Table 4 and Figure 7). The quantities of heavy metals analyzed in this research show different ways of transporting heavy metals in water through different factors from environmental impacts. The concentration of lead metal in the samples taken for study in Lake Radoniq varies from 214.32 µg / kg / kg, while Lake Badovc varies from 264.24 µg / kg / kg (see Table 7 and Figure 9). Regarding the results shown above we can generate that the highest concentration of the amount of metal Pb in Lake Radoniqi is higher by 49.92 µg / kg / kg) than in the other case of the study. The concentration of mercury metal in Lake Radoniqi varies from 0.69 µg / kg / kg, while in Lake Badovci it varies from 0.8 µg / kg / kg, and therefore we can say that the amount of mercury in Lake Radoniqi has shown a focus with greater 0.11 µg / kg / kg) than in the case of the other study. From the analyzed samples it seems that all the data analyzed in Lake Radoniqi are higher and are more polluted due to Lake Radoniqi, the low rate of monitoring, the amount of waste dumping is high on the shore of the lake, near this the lake cultivates various agricultural products compared to Lake Badovci, from which there is no such destination, whether agricultural or environmental.
The accumulated metal chain deposited in these cases of lakes has shown to create a new food line for the species in these waters. Based on the standard required by the EU permitting rules, the amount of Pb (see Table 5 and Figure 6) and Hg (see Table 6 and Figure 8) was higher according to the EU regulation. Since the content of heavy metals in fish muscle tissue can vary depending on the species, sex, age, season, diet, so they can pose a potential nutritional risk to humans.
To prevent pollution of natural resources, to achieve international standards, we recommend that attention be focused on the following:
Prevention of water, air and land pollution, as well as the installation of catalysts, removal of old vehicles from the roads of Kosovo (implementation of environmental laws);
Ensuring the provision of quality and water ecosystems, air and land, through adequate environmental monitoring;
Rehabilitation and growth of greenery in degraded areas;
Construction of measuring stations in air, water and soil, chemical and microbiological monitoring, for example the level of surface water pollution;
Current state of knowledge in environmental management;
General functioning of environmental management, non-destruction of the environment and its rehabilitation;
Environmental pollution management (waste system reducing the use of pesticides and herbicides, etc., increasing the tourist offer).
[1] Abakpa, G.O., Umoh, V.J., Ameh, J.B., Yakubu, S.E. (2013). Microbial quality of irrigation water and irrigated vegetables in Kano State, Nigeria. International Food Research Journal, 20(5): 2933.
[2] Adams, M.R., Moss, M.O. (2000). Food Microbiology. 2nd Ed. Royal Society of Chemistry, Cambridge, UK, 479.
[3] Alam, M., Ahsan, S., Pazhani, G.P., Tamura, K., Ramamurthy, T., Gomes, D.J., Nair, G.B. (2006). Phenotypic and molecular characteristics of Escherichia coli isolated from aquatic environment of Bangladesh. Microbiology and immunology, 50(5): 359-370. https://doi.org/10.1111/j.1348-0421.2006.tb03802.x
[4] Bytyçi, P., Fetoshi, O., Durmishi, B., Cadraku, H., Ismaili, M., Shala-Abazi, A. (2018). Status assessment of heavy metals in water of the Lepenci River Basin, Kosova. Journal of Ecological Engineering, 19(5): 19-32. https://doi.org/10.12911/22998993/91273
[5] Amoah, P., Drechsel, P., Henseler, M., Abaidoo, R.C. (2007). Irrigated urban vegetable production in Ghana: microbiological contamination in farms and markets and associated consumer risk groups. Journal of Water and Health, 5(3): 455-466. https://doi.org/10.2166/wh.2007.041
[6] Anon. (2007). Consumer Attitudes to Food Standards Report, Wave 7. London, UK: Food Standards Agency. http://www.food.gov.uk/multimedia/pdfs/cas07uk.pdf
[7] Beqiraj, S., Liçaj, P., Luotonen, H., Adhami, E., Hellsten, S., Pritzl, G. (2008). Situation of benthic macroinvertebrates in Vjosa River, Albania, and their relationships with water quality and environmental state. In Conference Proceedings “Balwois, pp. 416-428.
[8] Dreshaj, A. (2013). Doctorate: Study chemical - environmental watershed White Drin and Ibar in Kosovo University Tirana.
[9] Ntanos, S., Kyriakopoulos, G., Skordoulis, M., Chalikias, M., Arabatzis, G. (2019). An application of the New Environmental Paradigm (NEP) scale in a Greek context. Energies, 12(2): 239. https://doi.org/10.3390/en12020239
[10] Jusik, S., Staniszewski, R. (2019). Shading of river channels is an important factor reducing macrophyte biodiversity. Pol J Environ Stud., 28(3): 1215-1222. https://doi.org/10.15244/pjoes/81559
[11] Raghu, H.S., Ravindra, P. (2010). Antimicrobial activity and phytochemical study of Phyllanthus emblica Linn. International Journal of Pharmaceutical Studies and Research, 1(1): 30-33.
[12] Charoenteeraboon, J., Ngamkitidechakul, C., Soonthornchareonnon, N., Jaijoy, K., Sireeratawong, S. (2010). Antioxidant activities of the standardized water extract from fruit of phyllanthus emblica linn. Songklanakarin Journal of Science and Technology, 32(6): 599-604.
[13] Cowan, M.M. (1999). Plant products as Antimicrobial agents. American Society for Microbiology, 12(4): 564-582. https://doi.org/10.1128/CMR.12.4.564
[14] Lateef, A. (2004). The microbiology of a pharmaceutical effluent and its public health implications. World Journal of Microbiology and Biotechnology, 20(2): 167-171. https://doi.org/10.1023/B:WIBI.0000021752.29468.4e
[15] Guler, G.O., Kiztanir, B., Aktumsek, A., Citil, O.B., Ozparlak, H. (2008). Determination of the seasonal changes on total fatty acid composition and ω3/ω6 ratios of carp (Cyprinus carpio L.) muscle lipids in Beysehir Lake. Food Chemistry, 108: 689-694. https://doi.org/10.1016/j.foodchem.2007.10. 080.
[16] Barth, M., Hankinson, T.R., Zhuang, H., Breidt, F., (2009). Microbiological Spoilage of Fruits and Vegetables. In: Sperber, W.H., Doyle, M.P. (Ed.), Compendium of the Microbiological Spoilage of Foods and Beverages. (pp. 135-183), Newyork, Epublishing Inc.
[17] Krishnasree, V., Nethra, P.V., Dheeksha, J., Madumitha, M.S., Vidyaeswari, R., Lakshya, P. (2018). A pilot study on assessing the sustainability of food safety and hygienic practices in street food handling system. Asian Journal of Dairy and Food Research, 37(3): 321-325. https://doi.org/10.18805/ajdfr.DR-1381
[18] Friberg, L.M., Piscaor, G.F., Nordberg, T. (1974). Cadmium in the Environmental, 2nd ed., CRC Press, Cleveland, OH. https://doi.org/10.1007/978-3-0348-7238-6
[19] Soehartono, T. (1997). Overview of trade in Gaharu in Indonesia. In: Report of the Third Regional Workshop of the Conservation and Sustainable management of Trees. Hanoi, Vietnam. WCMC IUCN/SSC.