Linsen Duan | Mingshun Xiang | Jin Yang* | Xiaohan Wei | Chunjian Wang
© 2020 IIETA. This article is published by IIETA and is licensed under the CC BY 4.0 license (http://creativecommons.org/licenses/by/4.0/).
OPEN ACCESS
The 2008 Wenchuan Earthquake caused serious eco-environmental problems. To promote the restoration of ecological functions, it is important to carry out follow-up monitoring and scientific assessment of the eco-environment in the earthquake-stricken area. Based on the remote sensing (RS) images captured by Landsat satellites, this paper extracts and inverts the eco-environmental factors using RS and geographical information system (GIS) techniques. Then, an assessment index system was set up for the eco-environment in the earthquake-stricken area based on the pressure-state-response (P-S-R) model. After that, the Analytic Network Process (ANP) was adopted to thoroughly assess the eco-environment in the study area. The results show that the eco-environment state of the study area worsened quickly before a gradual improvement, exhibiting a benign development trend; the most significant eco-environment changes took place in the following areas: the worst-hit towns, both sides of the Beichuan Great Fault Zone, river banks, and regions with frequent human activities; the eco-environment restoration is mainly affected by the long-term impact of the earthquake and its secondary geological disasters, restoration measures, geological conditions, and intensity of human activities. The research results provide insights into the progress of ecological restoration and the dynamic changes of ecological functions in the earthquake-stricken areas, laying a scientific basis for preparing ecological restoration measures for different stages.
eco-environment state, remote sensing (RS), earthquake, geological disaster, analytic network process (ANP)
The worst-hit area of the Wenchuan earthquake is the transitional zone between the eastern edge of the Qinghai-Tibet Plateau and the Sichuan Basin. The area has a wide elevation span, rugged terrain, and diverse landform types; it’s a very important area for biodiversity conservation in China, it’s the birthplace of a few important rivers such as Jialing River, Fujiang River, and Minjiang River in Sichuan Province, therefore it has a crucial ecological status [1-4]. The Wenchuan Earthquake and its secondary geological disasters not only caused huge casualties and property losses, but also greatly destroyed forests, grass land, water, and other land resources; the ecological function of the area had been seriously degraded, which directly threatened the regional ecological security [5]. The earthquake-stricken area is located in the Longmen Mountains, where secondary disasters caused by the earthquake occur from time to time and are prone to form disaster chains. The eco-environment of this area is fragile and the preservation of ecological restoration is of great difficulty, which have severely restricted the restoration and reconstruction of the eco-environment after the disaster [6-11]. Assessing the eco-environment of the disaster area based on long-term tracking and observation is a prerequisite for timely following up the progress of ecological restoration in the disaster area and ensuring the normal functioning of the ecosystem [12]. Therefore, a thorough and timely understanding of the damages of eco-environment caused by the earthquake and its secondary geological disasters, and the restoration progress of the damaged eco-environment, is conductive to the summarization of the effects and experience of ecological restoration and reconstruction after strong earthquakes, and then measures for the restoration of eco-environment at different stages could be proposed and improved in a more targeted manner, so that the sustainable use of terrestrial ecosystems in disaster areas could be protected, restored and promoted, which has a positive role in the implementation of the Sustainable Development Goals proposed by the United Nations [13-16].
The ecological and environmental issues in the earthquake-stricken areas have always been the focus of attention of scholars and government departments. Based on Landsat TM remote sensing images before and after earthquakes, Lu et al. [17] used the difference in vegetation index to determine the extent of damage of vegetation in the disaster area caused by earthquake, and then evaluated the vegetation restoration rate, and analyzed the damage situation of the vegetation and the spatial difference characteristics of the natural restoration patterns. Jiao et al. [18] evaluated the changes in the eco-environment after the earthquake, and found that the speed of ecological restoration slowed down over time. Wang et al. [15] found that as the distance from the epicenter increases, the interference of earthquake on ecosystem gradually weakens. Huang et al. [19] studied the vegetation species composition and species combination in the typical landslide area of the Wenchuan earthquake and found that, 9 years after the earthquake, the vegetation had recovered to the grass-shrub mixed community stage [19]. Yunus et al. [20] quantified the impact of co-seism induced by the Wenchuan earthquake and the post-earthquake geological disasters on the vegetation. In recent years, scientists have realized that ecological restoration is an effective measure to improve the fragile ecosystem and restrain geological disasters, and the research on the coordination mechanism of the post-earthquake eco-environment and geological disasters has been developed to a certain extent [21, 22]. Li et al. [23] found that the geological disaster area affected in the Wenchuan earthquake decreased at a rate of 12% per year, and the vegetation in the damaged area was restored at a rate of 15%-20% per year, the occurrence of geological disasters and vegetation restoration are coupled. Galve et al. [24] found that applying structural protection measures on unstable slopes can reduce the risk of landslides, but only by combining with the development of agriculture and forestry can it exert a longer effect. Yang et al. [25] found that the restoration of vegetation in the damaged area of the Wenchuan earthquake has a positive effect on preventing geological disasters, and disasters such as landslides will disappear within 20 years after the earthquake.
In existing studies, most of them analyzed the relationship between the intensity of earthquakes and the degree of vegetation damage, the damages caused by secondary disasters such as landslides and mudslides to the surface landscapes and the restoration process [26]. Most studies concerning ecological restoration after earthquakes focused on a single factor, and few of them applied multi-dimensional indicators to comprehensive assessment. In view of the current research trends and existing problems, this paper applies the RS and GIS technologies and combines with field investigation and data collection to identify key factors affecting the eco-environment of the earthquake-stricken area; based on the PSR framework model, this paper constructs an eco-environment assessment index system and adopts the ANP method to conduct quantitative assessment on the eco-environment situation of the study area, and analyze the changes in the eco-environment of the study area; from the four aspects of the long-term impact of the earthquake and its secondary geological disasters, restoration measures, geological conditions, and intensity of human activities, the paper explores the causes of the changes in the eco-environment of the study area. This paper aims to carry out medium and long-term tracking and observation on the prominent ecological and environmental problems in the disaster area, so as to provide scientific basis and basic support for formulating ecological restoration measures of different stages, and offering a new perspective for the research on the post-earthquake restoration.
2.1 Study area
Beichuan County is located in the northwestern part of Sichuan Province, 160 kilometers away from the provincial capital city Chengdu. It is the worst-hit area of the 5·12 Wenchuan earthquake happened in 2008 (Figure 1). The regional landform types are mainly high-middle mountains, middle mountains and low-middle mountains. The geographical coordinates are 103°44′42.41″ - 104°43′15.37″ east longitude, 31°33′35.63″ - 32°13′10.97″ north latitude, and the total area is 3083.30 km2. This area is the source of the Fujiang River, an important tributary of the Yangtze River in the middle and upper reaches, it is an important water and biodiversity conservation place in the Chengdu Plain. Since the 1930s, 32 earthquakes of magnitude 5 or higher have occurred in this area. The Wenchuan earthquake had caused serious landslides in the area, and more than 800 geological disaster areas were generated. The earthquake and its secondary geological disasters caused a decline in the ecological bearing capacity, increased the degree of landscape fragmentation, and decreased the connectivity of the landscape; the water resource was severely damaged, the biodiversity was threatened, the structure of the ecosystem was changed, and the ecological service function was affected.
Figure 1. Location of Beichuan County, Sichuan Province
2.2 Data
The paper mainly selected the TM, ETM+ and OLI remote sensing data, 30m resolution DEM data, and the measured vegetation canopy water content and soil water content of the 5 phases of year 2007 (before the earthquake), year 2008 (earthquake year), year 2011 (initial restoration period), year 2014 (mid restoration period), and year 2017 (mid-late restoration period); it also collected other data such as the meteorology, land use, cultivated land quality, administrative boundaries, statistical yearbooks, and soil records of the study area.
2.3 P-S-R framework model
The P-S-R model has a significant causal relationship, emphasizing the correlations among natural changes, human activities, economic development and eco-environment. The model reflects the impact of natural disasters and human activities on the eco-environment, thereby changing the current states of the eco-environment, so that the human society can make appropriate responds to the changes, therefore, the model is suitable for large-scale eco-environment assessment. Earthquakes and their secondary geological disasters mainly affect ecological elements such as vegetation, waters, soil, terrains, and social ecology, etc. The main eco-environmental problems caused include damage to vegetation, fragmentation of the landscape, exposed ground, water and soil loss (or soil erosion), soil degradation and water damage, etc., and these can be summarized as natural condition factors or human activity factors. Drawing on Technical Criterion for Ecosystem Status Assessment (HJ 192-2015), Standards for Classification and Gradation of Soil Erosion (SL190-2007) and other standards, this paper selected 8 pressure indicators such as soil erosion, ground slope, and land disturbance, etc.; 10 status indicators such as ecological water content, and vegetation coverage, etc.; 4 response indicators such as per capita GDP and per capita income, etc.; and an eco-environment assessment index system of the study area has been constructed in the paper (Figure 2).
Figure 2. P-S-R-based eco-environment assessment model for earthquake-stricken area
2.4 Research methods
2.4.1 Standardization of indicators
Standardization of forward indicators: larger forward indicator values indicate better eco-environment. The processing method is as follows:
${{y}_{i}}=\frac{{{x}_{i}}-{{x}_{\min }}}{{{x}_{\max }}-{{x}_{\min }}}$ (1)
Standardization of backward indicators: smaller backward indicator values indicate better eco-environment. The processing method is as follows:
${{y}_{i}}=\frac{{{x}_{\max }}-{{x}_{i}}}{{{x}_{\max }}-{{x}_{\min }}}$ (2)
where, yi is the standardized value of indicator i after conversion, xi is the original value of indicator i before standardization, xmin is the minimum value of indicator i, and xmax is the maximum value of indicator i.
2.4.2 Eco-environment assessment method
The Network Analytic Hierarchy Process (NAHP) is suitable for non-independent hierarchical structure. Compared with AHP, NAHP is more complicated [27]; NAHP is composed of control layer and network layer. The control layer is composed of m elements, represented by P1, P2, ..., Pm; the network layer is composed of n element sets, represented by D1, D2, ..., Dn, again Di is composed of di1, di2, ···, dini (i=1, 2, ···, n). Through normalization processing and eigenvalue method, the ranking vector $\left(w_{i 1}^{j k}, w_{i 2}^{j k}, \ldots, w_{i n_{i}}^{j k}\right)^{T}$ was obtained, and then the sub-block Wij of the hypermatrix (Formula 3) was obtained as well.
${{W}_{ij}}=\left[ \begin{matrix} w_{i1}^{j1} & w_{i1}^{j2} & \cdots & w_{i1}^{j{{n}_{j}}} \\ w_{i2}^{j1} & w_{i2}^{j2} & \cdots & w_{i1}^{j{{n}_{j}}} \\ \vdots & \vdots & \vdots & \vdots \\ w_{i{{n}_{i}}}^{j1} & w_{i{{n}_{i}}}^{j2} & \cdots & w_{i{{n}_{i}}}^{j{{n}_{j}}} \\\end{matrix} \right]$ (3)
where, the ranking vectors of the influence of elements di1, di2, ..., dini in Di on the elements dj1, dj2, ..., djnj in Dj are the column vectors in Wij. When elements in Di have no effect on the elements in Dj, Wij=0, and W, the final hypermatrix obtained, is expressed as:
$W=\left[ \begin{matrix} {{w}_{11}} & {{w}_{12}} & \cdots & {{w}_{1\text{n}}} \\ {{w}_{21}} & {{w}_{22}} & \cdots & {{w}_{2n}} \\ \vdots & \vdots & \vdots & \vdots \\ {{w}_{n1}} & {{w}_{n2}} & \cdots & {{w}_{nn}} \\\end{matrix} \right]$ (4)
The control layer elements Ps(s=1, 2, ···, m) were taken as the criteria, the element set Dj (j=1, 2, ···, n) was taken as the sub-criteria, and the 1-9 scaling method was adopted as the judgment matrix to obtain the relative importance weight values of each element group with respect to Dj (j=1, 2, ···, n), and the normalization processing was performed according to the rules of normalization, and the sorting vector $\left(a_{1 j}, a_{2 j}, \cdots, a_{n j}\right)^{T}$ was obtained; when the elements have no relationship with Dj, the corresponding component vector was 0, then the sorting vectors corresponding to each element were calculated to obtain the weighted matrix Q (Formula 5) as follows.
$Q=\left[ \begin{matrix} {{q}_{11}} & {{q}_{12}} & \cdots & {{q}_{1\text{n}}} \\ {{q}_{21}} & {{q}_{22}} & \cdots & {{w}_{2n}} \\ \vdots & \vdots & \vdots & \vdots \\ {{w}_{n1}} & {{q}_{n2}} & \cdots & {{q}_{nn}} \\\end{matrix} \right]$ (5)
Formula 6 was used to calculate the weighted hypermatrix $\varpi$.
$\varpi ={{q}_{ij}}\times {{W}_{ij}}$ (6)
The element $\varpi_{i j}$ in the weighted hypermatrix $\varpi$ represented the one-step dominance degree of element i with respect to element j. Through the obtained weight values and Formula 7, the comprehensive assessment result of the assessment object could be calculated.
${{W}_{p}}=\sum\limits_{i=1}^{n}{{{R}_{is}}\times {{e}_{i}}}$ (7)
where, Wp is the value of the comprehensive assessment result; Ris is the standardized value of the i-th indicator; ei is the weight value of the i-th indicator.
Based on the principle of NAHP, this paper constructed a Super Decisions model for the assessment of eco-environment in the study area. Through Formulas 3 and 6, the unweighted hypermatrix, weighted hypermatrix, and limiting hypermatrix were obtained, and the weight coefficients of 22 indicators were obtained as well. Through Formula 7, the eco-environment indexes of the 5 time periods were calculated, and the accuracy was verified via field investigation. The larger the eco-environment index, the better the eco-environment and the more stable the ecosystem; on the contrary, the smaller the eco-environment index, the worse the eco-environment conditions, and the greater the restriction on the life of people. The distribution of the eco-environment quality of the study area in each period is shown in Figure 3.
Figure 3. Eco-environment assessment results of the study area in each period
3.1 Overall assessment of the eco-environment in the study area
According to the eco-environment classification standards stipulated in Technical Criterion for Ecosystem Status Assessment (HJ 192-2015), the eco-environment situation was divided into 5 degrees of <2.0, 2.0-2.5, 2.5-3.0, 3.0-3.5 and >3.5, represented by I (very poor), II (poor), III (average), IV (good), V(very good), respectively; and higher degree indicates better eco-environment quality. The distribution of the eco-environment of each degree is shown in Table 1 below.
It can be seen from Table 1 that the areas with a “very-good” degree eco-environment before the earthquake accounted for more than 80%, and there’s almost no areas with very poor or poor degrees eco-environment, indicating that the eco-environment of the study area was of high quality. After the Wenchuan earthquake, the areas with very-good degree eco-environment decreased significantly, and the areas with good degree eco-environment increased by 33.6 percentage; areas with very-poor, poor and average degrees eco-environment were 8 times more than before the earthquake, the regional eco-environment deteriorated significantly, and the ecological situation was very serious. From 2008 to 2011, the areas with very-good degree eco-environment increased to 57.88%, the areas with low-degree eco-environment decreased significantly, and the eco-environment of the study area was greatly restored. From 2011 to 2014, areas with very-good and good degrees eco-environment increased by 0.86% and 4.53% respectively compared with the previous period, the proportions of other degrees of eco-environment decreased further, indicating that although the restoration speed of the eco-environment of the study area during the restoration period slowed down, the dominant position of very-good and good degrees eco-environment had been continuously strengthened, and the quality of eco-environment continued to improve. Between 2014-2017, areas with very-good degree eco-environment accounted for more than 60%, but the areas with poor or average degrees eco-environment increased slightly compared with the previous period, indicating that although the trend of very-good degree eco-environment in the study area was more significant, the eco-environment quality of local areas was declining, which requires relevant departments to pay attention and take targeted measures.
Table 1. Statistics of eco-environment distribution in the study area during the five periods
|
Time period |
Ecological index |
Ⅰ |
Ⅱ |
Ⅲ |
Ⅳ |
Ⅴ |
|
Year 2007 |
Area (hectare) |
0.00 |
565.09 |
6306.66 |
52392.46 |
249066.01 |
|
Proportion (%) |
0.00 |
0.18 |
2.05 |
16.99 |
80.78 |
|
|
Year 2008 |
Area (hectare) |
5168.83 |
23819.81 |
51777.21 |
156038.73 |
71525.64 |
|
Proportion (%) |
1.68 |
7.73 |
16.79 |
50.61 |
23.20 |
|
|
Year 2011 |
Area (hectare) |
464.89 |
7404.09 |
30890.76 |
91113.09 |
178457.40 |
|
Proportion (%) |
0.15 |
2.40 |
10.02 |
29.55 |
57.88 |
|
|
Year 2014 |
Area (hectare) |
225.52 |
2848.64 |
19038.96 |
105089.63 |
181127.47 |
|
Proportion (%) |
0.07 |
0.92 |
6.17 |
34.08 |
58.74 |
|
|
Year 2017 |
Area (hectare) |
115.90 |
3707.78 |
22141.08 |
87501.53 |
194863.92 |
|
Proportion (%) |
0.04 |
1.20 |
7.18 |
28.38 |
63.20 |
The distribution of eco-environment of the study area at different time periods was subject to algebraic operations, and the changes in the eco-environment of different time periods were calculated. Based on the changes in the eco-environment indexes and the reference values, the changes in the eco-environment were divided into 7 levels according to Technical Criterion for Ecosystem Status Assessment (HJ 192-2015), as shown in Table 2.
Table 2. Classification of changes in eco-environment
|
Level |
Significantly deteriorate |
Deteriorate |
Slightly deteriorate |
No change |
Slightly improve |
Improve |
Significantly improve |
|
Change value |
≤-0.4 |
-0.4 ~ -0.15 |
-0.15 ~ -0.05 |
-0.05 ~ 0.05 |
0.05 ~ 0.15 |
0.15 ~ 0.4 |
≥0.4 |
|
Description |
The eco-environment fluctuates drastically, and deteriorates significantly. |
The eco-environment fluctuates, and deteriorates. |
The eco-environment fluctuates, and deteriorates slightly. |
The status of eco-environment is stable, there’s no change in the eco-environment. |
The eco-environment fluctuates slightly, and improves slightly. |
The eco-environment fluctuates, and improves. |
The eco-environment fluctuates drastically, and improves significantly. |
It can be seen from Figure 4 that the eco-environment of the study area had changed significantly after the earthquake; statistically, it is found that the areas deteriorated significantly and deteriorated were 52.81% and 36.67% respectively, indicating that the development trend of the eco-environment of the study area was worsening; significantly deteriorated areas were mainly Guixi Township, Chenjiaba Township, Qushan Town, Leigu Town, Yuli Township, and other earthquake worst-hit areas; Qingpian Township, Piankou township, and Duba Township showed obvious signs of deterioration; Only Taolong Township and Tongkou Township deteriorated slightly or showed no change; and almost no area had improved in the eco-environment. From 2008 to 2011, study areas with significantly improved eco-environment accounted for 41.52%, followed by areas with improved eco-environment, and the two had jointly promoted the improvement of eco-environment in the study area; in terms of spatial distribution, in the central and south regions, the eco-environment of Kaiping Township, Qushan Town, Dunshang Township, Yongchang Town, and Anchang Town had improved; the eco-environment of Piankou Township, Guanling Township in the north region and Qingpian Township in the west region had improved slightly; and the eco-environment of some areas in the central and east regions had deteriorated slightly. From 2011 to 2014, the number of unchanged areas increased significantly, accounting for 26.91% of the total area. Overall, the eco-environment of the study area was developing towards an improvement trend, but the areas with slightly deteriorated eco-environment increased obviously, rising to 22.76%; in terms of spatial distribution, the eco-environment of the east and south regions of the area had been improved, the eco-environment of some central and north regions had deteriorated slightly, indicating that the restored ecosystem was not stable and vulnerable to external disturbances. From 2014 to 2017, unchanged areas had become the dominant type, accounting for 48.67% of the total study area. Areas with slightly improved and improved eco-environment had dominated the development direction of the eco-environment of the entire study area; in terms of spatial distribution, the eco-environment of central region had improved, and the eco-environment of south and north regions deteriorated slightly. It can be seen that after the earthquake, the eco-environment had developed from a direction of significant deterioration to a better trend of continuous improvement, indicating that during these periods, various ecological restoration measures had played a positive role, and the entire ecosystem exhibited a benign development trend; the eco-environment restoration showed obvious spatial differences, and the most fluctuating areas were along the Jianjiang River and Duba River, and Anchang Town and Yongchang Town in the south region.
Figure 4. Distribution of eco-environment changes in the study area
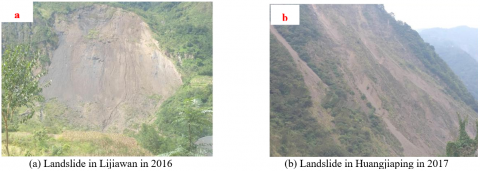
Figure 5. Field photos of geological disasters in the study area
3.3 Cause analysis of changes in eco-environment
3.3.1 Long-term impact of earthquakes and secondary geological disasters on the eco-environment
The Wenchuan earthquake not only caused loose soil and damaged surface vegetation in the study area, but also induced secondary geological disasters such as collapses, landslides, and mudslides, moreover, it aggravated the vulnerability and sensitivity of the regional eco-environment (as shown in Figure 5 above). The occurrence of secondary geological disasters in the later period, coupled with the unstable mountains and soil after the earthquake, had resulted in that many restored areas destroyed again once it encountered a heavy rain, in the end, only sporadic vegetation had remained. The restoration effect was not satisfactory and the eco-environment was restored at a slow speed.
3.3.2 Difference in ecological restoration measures
Under the influence of human activities in the artificial restoration area, agricultural activities are quickly restored on some abandoned land and bare land, the rapid growth of crops increases the coverage of surface vegetation, reduces soil erosion and hidden geological risks; engineering restoration measures can eliminate or reduce the occurrence of geological disasters and provide guarantee for the growth and development of surface vegetation. In artificial restoration area, the vegetation can be restored to a higher level within a short time. The advantages of natural restoration are "fewer investment" and "smaller disturbance", it relies on the self-organization and self-sustainability of the ecosystem itself to restore, but the disturbance resistance ability of the eco-environment in the artificial restoration area is relatively weak. Some well restored areas will destroy again due to rain erosion, and the preserved trees are also difficult to restore to the pre-earthquake level within a short period of time. Compared with artificial restoration area, the restoration speed of natural restoration area is slower, the restoration period is longer, therefore, it requires tracking and monitoring. The difference in restoration measures is an important reason for the spatial difference of eco-environment restoration in the study area.
3.3.3 Difference in geological environmental conditions
The eco-environment of the study area exhibited a law of the farther away from the earthquake fault zone, the better the eco-environment. On the one hand, the farther away from the fault zone, the smaller the earthquake intensity, when the intensity of an earthquake reaches IX degree, the earthquake will cause damage to the eco-environment, when it reaches the XI degree, the damage to the eco-environment will be very serious [28]; on the other hand, the seismic wave will radiate to the surroundings with the fault zone as the axis, the fault fracture zone has a magnifying effect on the seismic wave, when earthquake occurs, the crustal movement near the fault zone is more strenuous, the surface rupture caused by the Wenchuan earthquake runs through the entire study area along the Yingxiu-Beichuan fault, and the destructive power is huge; secondary geological disasters are mainly controlled by the seismogenic fault, the distribution follows the law of the closer to the seismogenic fault zone, the denser the distribution of disaster points. Therefore, generally, the problems of eco-environment around the earthquake fault zone are more prominent, and the area around the earthquake fault zone should be taken as the key area for long-term eco-environment monitoring.
Stratum lithology has an impact on the frequency and spatial distribution of geological disasters, and is closely related to the development process of soil, which determines the corresponding vegetation. Therefore, the stratum lithology plays an important role in the changes of regional eco-environment. First, under the action of earthquake, with the increase of lithological hardness, the possibility of collapse will increase; while with the decrease of lithological hardness, the development degree of landslides and mudslides will increase, therefore, after an earthquake, the eco-environment problems of the extremely soft rock, soft rock and slightly soft rock areas have become more prominent. Second, in terms of the distribution of stratum lithology, the study area is less distributed with extremely soft rocks and soft rocks, the distributed areas were mainly the Yongchang Town and Yong'an Town, and the two towns are the main human activity areas in the study area, and their eco-environment is strongly disturbed by human activities; hard rocks and slightly hard rock are mainly distributed in the northwest and central regions of the study area, in these regions, the vegetation coverage is extremely high, the biodiversity is rich, the ecological water content is high, the land is broad, sparsely populated, and less disturbed by human activities. Third, lithology determines the weathering speed, soil formation efficiency and soil composition, and affects the distribution of water resources and the growth rate of vegetation, which affects the restoration rate of the eco-environment; the higher the intensity of the lithology, the more difficult it is to form soil layer, so the water conservation capacity is weaker, and it is harder for the eco-environment to restore after destruction.
3.3.4 Impact of post-earthquake human activities
After an earthquake, a large number of restoration and reconstruction activities are required, which would occupy a large amount of land resources. In particular, the original vegetation will be completely destroyed during the mining and quarrying process, which will greatly affect the growth of vegetation around the quarries, causing air pollution, and breaking the balance of water resources, all of which will restrict the restoration speed of the regional eco-environment. For example, the original vegetation coverage of Yunlin Village in Xiangquan Township was relatively high, and its eco-environment was good, however, after a short period of quarrying, dozens of exposed spots of various sizes were generated in the region. The quarrying of rocks would cause great damages to mountains and vegetation. The piling of waste rocks and residues would occupy the land for the second time, and some of them might be dumped into nearby rivers and creeks, changing the surface water system and causing eco-environmental problems. Therefore, human activities are also an important factor affecting the development trend of regional eco-environment.
This paper adopted RS and GIS technologies to extract and invert key parameter information of the eco-environment, combining with basic data such as economy and population, 22 indicators such as ecological water content, soil erosion, and vegetation coverage were selected for the research, and the PSR framework model was applied to construct an eco-environmental assessment system of the study area; based on the principles of the ANP method, the eco-environment of Beichuan County was monitored and evaluated dynamically, the results showed that:
(1) The overall eco-environment of the study area before the earthquake was relatively good, regions with an eco-environment index greater than 3.5 dominated the area. After the Wenchuan earthquake, the regional eco-environment deteriorated significantly, and the deteriorated areas were significantly distributed in earthquake worst-hit towns such as Guixi, Chenjiaba, Qushan, Xuanping, Yuli, and Leigu, etc. After three ecological restoration periods, the eco-environment of the study area had been significantly improved, and regions with good eco-environment had gradually dominated the study area. On the whole, the overall situation of the eco-environment in the study area showed a rapid decline first and a gradual improvement trend later, indicating that the ecological restoration measures during the periods were effective and the regional eco-environment exhibited a benign development trend.
(2) In terms of the change intensity of the eco-environment, the proportion of study area that deteriorated significantly had decreased from 52.81% in the earthquake year to 1.81% in 2017, and the proportion of unchanged area recovered from 0.98% to 48.67%, indicating that while the regional eco-environment was improving continuously, the change intensity of the eco-environment became weaker, the entire ecosystem gradually stabilized, and the disturbance resistance ability was enhanced. In terms of the spatial distribution of changes in the eco-environment, the earthquake worst-hit towns, the both sides of the Beichuan Great Fault Zone, the banks of main river systems, and villages and towns with frequent human activities were areas with the greatest change intensity in eco-environment, and they should be taken as key areas for the tracking, monitoring and assessment of post-earthquake eco-environment restoration.
(3) The long-term impact of earthquake and secondary geological disasters on the eco-environment, the difference in ecological restoration measures, the difference in geological environmental conditions, and the intensity of post-earthquake human activities are the main controlling factors affecting the restoration of the eco-environment in the study area. The selection of ecological restoration measures needs to comprehensively take into account the various influencing factors and their internal connections. The initial restoration stage is a rapid period of ecological restoration, and it is the critical period for ecological restoration. At this stage, artificial restoration measures should be appropriately strengthened to eliminate hidden geological disasters as soon as possible, create good conditions for vegetation restoration, and promote ecological restoration by reducing disasters. In the mid-term restoration stage, for earthquake fault zones, roads, river banks, and other key areas, secondary geological disaster management and eco-environment monitoring should be strengthened; as for other areas, natural restoration is still the main restoration measure. At the same time, the coverage rate of regional vegetation should be increased continuously to achieve ecological disaster reduction, thereby achieving the goal of coordinated development of disaster reduction and ecological restoration. In mid-late restoration stage, large-scale earth-and-stone engineering works should not be carried out, locally implemented artificial measures are still mainly to eliminate hidden geological disasters and to prevent secondary damages to the eco-environment; at the same time, economic crops can be planted on some stable slopes, so as to reduce the damages to biological resources with green sustainable development.
This work is supported by Sichuan Science and Technology program (Grant No.: 20ZDYFS0308).
[1] Opdam, P., Foppen, R., Vos, C. (2001). Bridging the gap between ecology and spatial planning in landscape ecology. Landscape Ecology, 16(8): 767-779. https://doi.org/10.1023/A:1014475908949
[2] Loucks, C.J., Zhi, L., Dinerstein, E., Dajun, W., Dali, F., Hao, W. (2003). The giant pandas of the Qinling Mountains, China: a case study in designing conservation landscapes for elevational migrants. Conservation Biology, 17(2): 558-565. https://doi.org/10.1046/j.1523-1739.2003.01494.x
[3] Zhang, J., Hull, V., Huang, J., Yang, W., Zhou, S., Xu, W., Huang, Y., Ouyang, Z.Y., Zhang, H.M., Liu, J. (2014). Natural recovery and restoration in giant panda habitat after the Wenchuan earthquake. Forest Ecology and Management, 319: 1-9. https://doi.org/10.1016/j.foreco.2014.01.029
[4] Peng, J., Du, Y., Liu, Y., Hu, X. (2016). How to assess urban development potential in mountain areas? An approach of ecological carrying capacity in the view of coupled human and natural systems. Ecological Indicators, 60: 1017-1030. https://doi.org/10.1016/j.ecolind.2015.09.008
[5] Zhang, Z., Swaisgood, R.R., Zhang, S., Nordstrom, L.A., Wang, H., Gu, X., Hu, J.C., Wei, F. (2011). Old-growth forest is what giant pandas really need. Biology Letters, 7(3): 403-406. https://doi.org/10.1098/rsbl.2010.1081
[6] Chen, M., Tang, C., Xiong, J., Shi, Q.Y., Li, N., Gong, L.F., Wang, X.D., Tie, Y. (2020). The long-term evolution of landslide activity near the epicentral area of the 2008 Wenchuan earthquake in China. Geomorphology, 367: 107317. https://doi.org/10.1016/j.geomorph.2020.107317
[7] Cui, P., Wei, F., Chen, X., He, S. (2008). Geo-hazards in Wenchuan earthquake area and countermeasures for disaster reduction. Bull Chin Acad Sci, 23(4): 317-323.
[8] Zhang, S., Zhang, L.M. (2017). Impact of the 2008 Wenchuan earthquake in China on subsequent long-term debris flow activities in the epicentral area. Geomorphology, 276: 86-103. https://doi.org/10.1016/j.geomorph.2016.10.009
[9] Fan, X., Juang, C.H., Wasowski, J., Huang, R., Xu, Q., Scaringi, G., van Westen, C.J., Havenith, H.B. (2018). What we have learned from the 2008 Wenchuan Earthquake and its aftermath: A decade of research and challenges. Engineering Geology, 241: 25-32. https://doi.org/10.1016/j.enggeo.2018.05.004
[10] Fan, R.L., Zhang, L.M., Wang, H.J., Fan, X.M. (2018). Evolution of debris flow activities in Gaojiagou Ravine during 2008–2016 after the Wenchuan earthquake. Engineering Geology, 235: 1-10. https://doi.org/10.1016/j.enggeo.2018.01.017
[11] Fan, X., Scaringi, G., Korup, O., West, A. J., van Westen, C. J., Tanyas, H., Hovius, N., Hales, T.C., Jibson, R.W., Allstadt, K.E., Zhang, L.M., Evans, S.G., Xu, C., Li, G., Pei, X.J., Huang, R.Q. (2019). Earthquake‐induced chains of geologic hazards: Patterns, mechanisms, and impacts. Reviews of Geophysics, 57(2): 421-503. http://dx.doi.org/10.1029/2018RG000626
[12] Connell, D.J. (2010). Sustainable livelihoods and ecosystem health: Exploring methodological relations as a source of synergy. EcoHealth, 7(3): 351-360. https://doi.org/10.1007/s10393-010-0353-7
[13] Yang, X., Zhang, Q. (2013). Seismic spatial information grid: applications of geo-informatics in earthquake disaster management. In International Conference on Geo-Informatics in Resource Management and Sustainable Ecosystem, pp. 397-406. https://doi.org/10.1007/978-3-642-41908-9_41
[14] Chen, L., Wu, F., Yang, W., Zhang, J. (2012). A comparison on ecosystem services before/after “5.12” Wenchuan earthquake. Acta Ecologica Sinica, 32(5): 271-273. https://doi.org/10.1016/j.chnaes.2012.07.002
[15] Wang, Y.K., Fu, B., Xu, P. (2012). Evaluation the impact of earthquake on ecosystem services. Procedia Environmental Sciences, 13: 954-966. https://doi.org/10.1016/j.proenv.2012.01.089
[16] Rapport, D.J., Maffi, L. (2011). Eco-cultural health, global health, and sustainability. Ecological Research, 26(6): 1039-1049. https://doi.org/10.1007/s11284-010-0703-5
[17] Lu, T., Zeng, H., Luo, Y., Wang, Q., Shi, F., Sun, G., Wu, Y., Wu, N. (2012). Monitoring vegetation recovery after China’s May 2008 Wenchuan earthquake using Landsat TM time-series data: A case study in Mao County. Ecological Research, 27(5): 955-966. https://doi.org/10.1007/s11284-012-0976-y
[18] Jiao, Q., Zhang, B., Liu, L., Li, Z., Yue, Y., Hu, Y. (2014). Assessment of spatio-temporal variations in vegetation recovery after the Wenchuan earthquake using Landsat data. Natural Hazards, 70(2): 1309-1326. https://doi.org/10.1007/s11069-013-0875-8
[19] Huang, Y.Y., Han, H., Tang, C., Liu, S.J. (2017). Plant community composition and interspecific relationships among dominant species on a post-seismic landslide in Hongchun Gully, China. Journal of Mountain Science, 14(10): 1985-1994. https://doi.org/10.1007/s11629-017-4382-3
[20] Yunus, A.P., Fan, X., Tang, X., Jie, D., Xu, Q., Huang, R. (2020). Decadal vegetation succession from MODIS reveals the spatio-temporal evolution of post-seismic landsliding after the 2008 Wenchuan earthquake. Remote Sensing of Environment, 236: 111476. https://doi.org/10.1016/j.rse.2019.111476
[21] Shen, P., Zhang, L.M., Fan, R.L., Zhu, H., Zhang, S. (2020). Declining geohazard activity with vegetation recovery during first ten years after the 2008 Wenchuan earthquake. Geomorphology, 352: 106989. https://doi.org/10.1016/j.geomorph.2019.106989
[22] Sestras, P., Bondrea, M.V., Cetean, H., Sălăgean, T., Bilaşco, Ş., NAȘ, S., Spalevic, V., Fountas, S., Cimpeanu, S.M. (2018). Ameliorative, ecological and landscape roles of Făget Forest, Cluj-Napoca, Romania, and possibilities of avoiding risks based on GIS landslide susceptibility map. Notulae Botanicae Horti Agrobotanici Cluj-Napoca, 46(1): 292-300. https://doi.org/10.15835/nbha46110866
[23] Li, Z., Jiao, Q., Liu, L., Tang, H., Liu, T. (2014). Monitoring geologic hazards and vegetation recovery in the Wenchuan earthquake region using aerial photography. ISPRS International Journal of Geo-Information, 3(1): 368-390. https://doi.org/10.3390/ijgi3010368
[24] Galve, J.P., Cevasco, A., Brandolini, P., Soldati, M. (2015). Assessment of shallow landslide risk mitigation measures based on land use planning through probabilistic modelling. Landslides, 12(1): 101-114. https://doi.org/10.1007/s10346-014-0478-9
[25] Yang, W., Qi, W., Zhou, J. (2018). Decreased post-seismic landslides linked to vegetation recovery after the 2008 Wenchuan earthquake. Ecological Indicators, 89: 438-444. https://doi.org/10.1016/j.ecolind.2017.12.006
[26] Cheng, T.T., Gu, B. (2019). Study on ecological restoration of Dujiangyan after "5.12" Wenchuan earthquake. Journal of Sichuan University (Natural Science Edition), 56(13): 563-572. https://doi.org/10.3969/j.issn.0490-6756.2019.03.030
[27] Saaty, T.L. (1996). Decision making for Leaders. Pittsburgh: RWS Publications.
[28] Tschirley, J.B. (1997). Considerations and constraints on the use of indicators in sustainable agriculture and rural development. Fao Land & Water Bulletin, (2): 5.