Ahmed Adnan Saeed* | Luay Taha Mullahwaish
© 2020 IIETA. This article is published by IIETA and is licensed under the CC BY 4.0 license (http://creativecommons.org/licenses/by/4.0/).
OPEN ACCESS
Urban green spaces are among most important indicators of amenities, which include providing entertainment, aesthetic enjoyment and environmental quality. However, most of these values lack their relationship to market prices, which leads to gradual overruns of those areas through urban sprawl. As a result, there is a need to obtain quantitative information on implicit and non-market advantages and benefits of urban green areas that have been classified in Ramadi into three categories. Main procedure is to integrate real estate that is bought and sold on market with convenience values and that people are willing to pay money to live near local comfort environment. Statistical models that stakeholders use can then be used to identify those green environmental facilities. It should be possible to determine monetary value of benefits provided by green spaces. Research was conducted in city of Ramadi, which is experiencing a large difference in real estate prices, which facilitates application of statistical models to evaluate green spaces. Results clearly affirmed positive effects of green spaces in urban areas on values of neighboring homes, and highlighted preferences of investors and residents alike. Independent variables were area of green space, distance from green scene, duration of access to park and public green space, and percentage of urban green areas. Moreover, variables of land use intensity and density of educational environment proved to be of great importance in model. As a result, recommendations provide insight into stakeholders and policy makers involved in urban planning.
Ramadi city, parks, plaza, orchard, real estate, price
The development of environmental awareness has increased demand for green spaces for a variety of goals, most important of which is enjoyment of aesthetics, entertainment and environmental quality [1]. However, comfort values associated with green urban areas are non-market prices because they are environmental benefits [2] that cannot be directly traded in market [3]. In absence of clear prices for environmental facilities on market, urban planners often ignore or reduce these benefits, resulting in reduced urban green space and gradual erosion under pretext of urban development [3]. These conflicting trends raise need to protect green areas, which requires an estimate of indirect market price of green spaces. Evaluation of these non-economic recreational resources by population is not a new concept for economists [4]. Economic evaluation comes from effect of green zone on prices of neighboring properties in different proportions.
One of models for determining environmental economic value of recreational spaces is transportation models. Basic premise is that time spent by people visiting green site is cost of transportation, and therefore this model is appropriate when different distances are to reach recreational use [5].
Thus, application of model to environmental economics reached a statistical relationship between real estate prices and air quality. This relationship led economists to study and analyze information about house prices [6]. Since ownership is a fixed commodity with social and economic dimensions, difference in real estate prices will be justified by a number of factors specific to housing unit, such as quality of house structure, characteristics of neighborhood, access to city center, and access to goods and services within home environment.
Urban green spaces produce financial benefits that are supposed to make neighborhood a beautiful place to live, and these benefits are reflected in surrounding property prices. As a result, it is possible to estimate value of urban green spaces and that estimating environmental value from actual market transaction prices will be easy.
GIS development has made it a powerful but underutilized tool in environmental economies [7]. Among its most important advantages is placement of characteristics on city map [8]. It has enabled identification of clear, accurate, consistent and neutral variables, such as easy access to green areas in a fast and economically efficient way. Which can be used to better measure characteristics of environment, thus increasing understanding of difference in real estate market.
The research structure consists of an introduction that defines general direction of research to focus on relationship between green areas and real estate prices, then defining research problem, hypothesis and goals. After that, study clarified scope of study and its expansion over specific time periods shown in maps, tables and figures, then divided city into regions and collected information through questionnaire with residents and real estate offices. Through approved data, 17 indicators were evaluated and data entered in a statistical model to determine effect of independent variables on approved (price) variable.
Research problem
• Clarify relationship between values of green areas and market prices, and they were ignored or underestimated by some planners in Iraqi cities.
• Progressive urban encroachment on green areas
Research Hypothesis
Knowing price values that are related to implicit and non-market benefits of green areas, protect them from violations and raise real estate prices in urban areas.
Research objectives:
(1) Urban Green Space Assessment.
(2) Search for appropriate variables in statistical models for measurements of green areas;
(3) Provide monetary value for green space for planners and decision-makers in urban areas to improve green development and planning projects.
(4) Provide a pilot study in Ramadi city on quantitative assessment of urban green facilities.
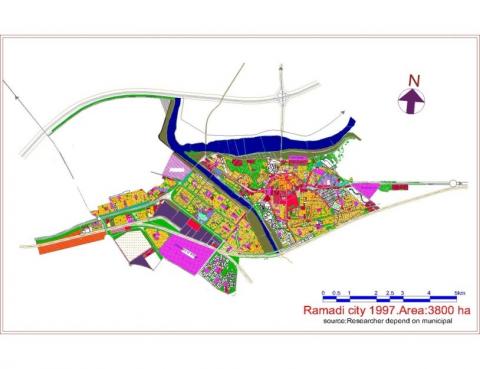
Figure 1. Ramadi city / 1997. (Researcher by AutoCad)
Figure 2. Image (GPS) of Ramadi city 2018. (Researcher from Base map of ArcMap)
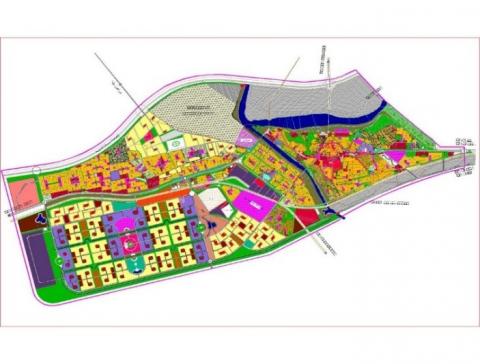
Figure 3. Master plan of Ramadi city 2018. Researcher depend on Municipa
This study was conducted in city of Ramadi, Anbar province. Where it witnessed large population growth and expansion in master plan prepared by Directorate of Urban Planning (Figure 1), which has expanded significantly over past 20 years (Figure 1 & Figure 2). Built-up area expanded from 4,086 hectares in 1986 to more than 8,114 hectares in 2018. City of Ramadi has approximately 1664 hectares of public green areas classified as parks, plaza and orchards, or about 14.5% of total area of study (Figure 3).
In built-up area of Ramadi city, there are low density of public green areas, most of which are located on outskirts of urban areas, especially in north and north-east and on banks of Euphrates and Alwarar River, which divide city into three parts, including proposed expansion area (Table 1). Maintaining areas is therefore a major problem.
Table 1. Change in percentage of built-up areas and green areas in Ramadi 1986-2018
|
|
1997 |
1986 |
% |
2018 |
% |
|
Area of Ramadi city |
3800 ha |
5404 ha |
0 |
11642 |
- |
|
Built area |
2112 ha |
4086 ha |
69.6 |
8114 ha |
75.6 |
|
Green area |
635 ha |
398 ha |
7.4 |
|
|
|
Green area in proposed expansion |
|
- |
|
1942 ha |
16.7 |
|
|
Source: the researcher depends on Master plan of Ramadi city |
||||
Use of models to estimate implicit prices as an attempt to preserve urban green spaces in city, as well as any other environmental resources linked to real estate prices. This was results of classic market of real estate system, where state reserves rights to price per square meter by region, especially in assessment of fees or taxes. The system restricts sale of residential use in market as a real goods by market mechanisms and real estate offices in normal state of city. It was impossible to check prices of local transactions (Figure 4). However, nature of social housing can change radically since desire of decision-makers to raise proportion of green areas.
The research provides an opportunity to develop and implement accurate and credible property price estimation for benefits of green urban facilities. In addition, real estate prices are secret of profession for investors of real estate and they do not want to provide other items in real estate market details. Based on model, study is an attemption to indirectly assess green spaces in urban areas. At same time, implicit prices have been estimated for other environmental characteristics related with housing such as educational sector (university in first degree) and environmental concerns.
Figure 4. The average land prices in city of Ramadi 2018 / USD.m2
Economic value model
All of inputs to statistical model were based on master plan, field survey and questionnaire in Ramadi city especially real estate bureau.
Multi-linear regression model
Estimated linear model in the search follows:
$\mathrm{V}=\alpha_{0}+\mathrm{E}_{1}+\mathrm{G}_{1}+\mathrm{L} \eta+\Sigma$ (1)
where, V is a vector (n × 1) for real estate prices; E is a matrix of characteristics of environment of neighborhood (n × 1); G is a matrix (n x 1) for accessibility characteristics Σ is a vector (n × 1) for random error terms. Table 2 provides description of variables in model.
Simi logarithmic model
Model of Simi Log. was determined by converting a normal log. of housing price into multiple regression models, model follows:
$\ln \mathrm{P}=\alpha_{0}+\mathrm{E}_{1}+\mathrm{G}_{1}+\mathrm{L} \eta+\Sigma$ (2)
In addition to application linear regression modeling and semi-log in Table 3 and another analysis was performed using the stepwise regression of SPSS program to eliminate overlapping indicators and variables in Table 4.
Classifications and criteria for green areas in Iraq
Calculation of the need for recreational spaces was based on internationally accepted standards and norms, taking into account the city's climatic and social conditions. Table 5 shows standards of green areas in Iraq:
Table 2. Independent variables and their expected effects on real estate prices
|
Independent variable |
Specifications |
Expected impact |
|
X1 |
A straight-line distance from real estate to nearest park boundary (measuring integrated impact of nearest park) / meter length |
+ |
|
X2 |
A straight line distance to nearest green plaza (integrated impact meter for nearest green area) / meter length |
+ |
|
X3 |
A straight line distance to nearest orchard (integrated impact meter for nearest green area) / meter length |
+ |
|
X4 |
Type closest urban green area. park, plaza, orchard with 1, 2 and 3, respectively |
+ |
|
X5 |
Scale for easy access to center; accumulated time from center of residential block to commercial center (per minute) |
- |
|
X6 |
Scale for easy access to park. Time accumulated from center of residential complex to nearest park (per minute) |
- |
|
X7 |
Scale for easy access to plaza. Time accumulated from center of residential complex to nearest park (per minute) |
- |
|
X8 |
Scale for easy access to orchard. Time accumulated from center of residential complex to nearest park (per minute) |
- |
|
X9 |
Percentage of green landscapes in a radius of 400 meters, indicating proportion of greening housing block |
+ |
|
X10 |
(%) Of number of public green spaces in a radius of 500 meters |
؟ |
|
X11 |
Area of public green areas in a radius of 500 meters (ha) |
؟ |
|
X12 |
Richness of patches of adjacent urban green areas in a circle outside radius of 500 meters(ha) |
؟ |
|
X13 |
Richness of green area of adjacent land uses in outer circle radius of 500 meters, (number) |
؟ |
|
X14 |
Density of green patch in land uses in a radius of 500 meters (number) |
؟ |
|
X15 |
Residential blocks (number) |
+ |
|
X16 |
Educational environment scale, distance from university’s neighborhood center (number colleges within a circle of 1000 meters) |
+ |
|
X17 |
Scale of environmental imbalance, number of factories within a radius of 1000 meters |
- |
|
|
?: undetermined sign |
|
Table 3. Results of regression for linear model and model of Simi log, Y: price
|
Semi-log model (R2 = 0.697, adjusted R2 = 0.649) |
Independent variables |
Linear model (R2 = 0.692, adjusted R2 = 0.641) |
Independent variables |
||
|
t-Ratio |
Coefficients |
t-Ratio |
Coefficients |
||
|
24.364 |
8.435 |
constants |
3.601 |
4205.715 |
constants |
|
0.107 |
1.836E−03 |
X1 |
0.752 |
43.308 |
X1 |
|
1.381 |
4.611E−02 |
X2 |
1.893 |
213.252 |
X2 |
|
1.083 |
1.872E−02 |
X3 |
1.478 |
86.161 |
X3 |
|
0.288 |
1.538E−02 |
X4 |
1.561 |
280.158 |
X4 |
|
−1.116 |
−6.022E−03 |
X5 |
−1.221 |
−22.225 |
X5 |
|
−1.188 |
−1.136E−02 |
X6 |
−0.367 |
−11.872 |
X6 |
|
−0.922 |
−9.528E−03 |
X7 |
−1.073 |
−37.477 |
X7 |
|
−0.962 |
−7.303E−03 |
X8 |
−0.623 |
−15.936 |
X8 |
|
4.982 |
2.031E−02 |
X9 |
4.536 |
62.325 |
X9 |
|
1.587 |
1.875E−03 |
X10 |
1.355 |
5.402 |
X10 |
|
3.227 |
0.137 |
X11 |
2.972 |
429.779 |
X11 |
|
−3.062 |
−0.352 |
X12 |
−2.921 |
−1130.392 |
X12 |
|
−4.318 |
−0.117 |
X13 |
−4.087 |
−377.080 |
X13 |
|
−1.472 |
−2.721E−03 |
X14 |
−0.661 |
−4.128 |
X14 |
|
2.694 |
7.475E−02 |
X15 |
2.077 |
194.434 |
X15 |
|
2.207 |
1.721E−02 |
X16 |
2.641 |
69.401 |
X16 |
|
−0.615 |
−4.245E−03 |
X17 |
−0.795 |
−18.517 |
X17 |
|
Source: researcher from outputs of SPSS |
|||||
Table 4. Regression results after exclusion of structural variables
|
model of Semi.log (R2 = 0.672, adjusted R2 = 0.646) |
Independent variables |
Linear model (R2 = 0.647, adjusted R2 = 0.621) |
Independent variables |
||||
|
P.value |
t.Ratio |
Coefficients |
|
P.value |
t.Ratio |
Coefficients |
|
|
0.0 |
37.837 |
8.171 |
constants |
0.0 |
4.667 |
3736.851 |
constants |
|
0.0 |
4.093 |
4.918E−02 |
X3 |
0.001 |
3.274 |
142.093 |
X3 |
|
0.0 |
−5.083 |
−0.122 |
X13 |
0.0 |
−5.318 |
−416.877 |
X13 |
|
0.0 |
5.701 |
2.054E−02 |
X9 |
0.0 |
4.996 |
63.545 |
X9 |
|
0.01 |
−2.572 |
−1.848E−02 |
X7 |
0.084 |
−1.736 |
−51.632 |
X7 |
|
0.012 |
2.528 |
6.294E−02 |
X15 |
0.003 |
2.963 |
71.812 |
X16 |
|
0.017 |
−2.404 |
−1.641E−02 |
X6 |
0.083 |
1.745 |
154.358 |
X15 |
|
0.008 |
2.647 |
1.842E−02 |
X16 |
0.170 |
−1.378 |
−32.086 |
X6 |
|
0.002 |
3.282 |
0.138 |
X11 |
0.021 |
2.312 |
371.238 |
X4 |
|
0.005 |
−2.781 |
−0.191 |
X12 |
0.080 |
1.761 |
188.578 |
X2 |
|
Source: outputs of SPSS |
|||||||
Table 5. Classifications and criteria for green areas in Iraq
|
Green area type |
Code on comprehensive development design map |
Design for 2000 |
|
|
Recreational spaces |
|
m2/ Person |
Area/ha |
|
1.Fully dedicated to public |
|
|
|
|
a.Parks and squares in center |
OP (open space) |
4 |
1740 |
|
b.Parks and squares in district |
OP |
3 |
1300 |
|
c.Parks, squares and playgrounds in the neighborhood |
RC, RB.RA.RM |
5 |
2150 |
|
d.Peripheral entertainment centers |
OR (recreation) |
1.2 |
720 |
|
2.Partly dedicated to public |
|
|
|
|
a.Sports yards in center |
OS (sport) |
0.8 |
470 |
|
b.Sports yards in district |
OS |
1.2 |
510 |
|
c.Plant and animal gardens |
OP |
0.8 |
350 |
|
d.Private gardens |
RC.RB.RA |
1.2 |
5160 |
|
Total area |
|
28 |
12400 |
|
Source: Comprehensive Development Design Report for Baghdad City until 2000, Baghdad Municipality, 1973. |
|||
Data and identification variables (Evaluation indicators)
For application model, we must specify properties and variables to include in estimates before using them in form. It may include most recognizing relevant variables that have been omitted from analysis and determining how to obtain variables that are actually required [9].
First: Home price data and structure characteristics
Given power of attracting urban green spaces to people, rapid urban development has occupied many of them in recent years. However, proper management and intelligent planning are needed to prevent excessive land allocation, and improving spatial type of green area requires an assessment of economic values for these areas. Therefore, accurate quantitative information in terms of benefits of green space is urgently needed for planning of all cities.
House prices have fluctuated significantly, so a survey of data collection has been conducted only in 2018. All homes surveyed were built between 2012 and 2013, because prices were more stable. One year of information was used to avoid problems that result from changes of time, but with small sample. In end, 45 residential blocks within urban area were selected with 100 units per block (Figure 5), often built with traditional building technology, with basic infrastructure and varying public services.
Figure 5. 45 blocks of case study.
Initially, variables related to structure characteristics, including age of property, and provision of water, sewage or Internet were designed. As a result, characteristics of study show similarities in structure, not only in age but also in terms of design and features. In general, properties of property structure seem to vary in size, mostly in size of residential unit. Especially when some data showed that relevant size of property has a positive relationship with price of selling. The main focus of research is not on a model that shows price of property in first place, but rather on contribution of elected variables in green areas. Therefore, variables of structural properties of houses were eliminated from final analysis. Square meter price for each residential group was chosen as (dependent variable) in model. Master plan of study area shows that most of property is located within inner structure of city.
Second: Data of Environmental characteristics
They include variables related to environmental characteristics, including those of urban green spaces, educational environment and environmental imbalances (such as pollution of industrial).
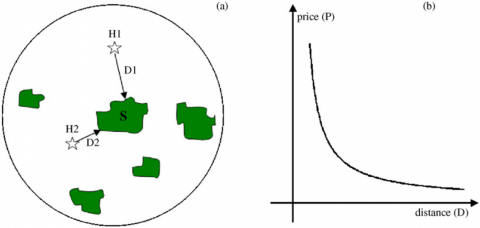
In order to assess impact of green spaces on price of a particular property, variables that determine characteristics of urban green spaces, such as their type, distance between property and area of nearest green area are usually explained [10]. Different types of green areas may affect real estate values, which must be taken into account in input models. Therefore, main green areas were divided into three categories (park, plaza and orchard) and weighed as follows (1, 2 and 3 respectively) according to expected effect of facility, for offer positive impact on sale value of housing (Figure 6). For example, when swab variable is selected for nearest green area, spatial pattern (except for type of green area) is ignored.
Schools as an important service directly and clearly affect real estate value [12]. Certainly, in any city people are looking for educational use when buying house, and many researches has found that house prices are higher with a better and closer learning environment. [7]. In this study, university and its colleges (Agriculture, Medical Group, Education for Girls, Faculty of Knowledge) were selected as an indicator of impact of educational environment. The study focused on effect of distance from nearest education institute (density of colleges) is very clear and influential. It therefore assumes that all colleges have same quality of influence. In contrast to positive impact of facilities, pollution by wastes (waste residues, gasses and sewage) discharged by industry would directly harm population in surrounding area and result in evaporation effects on nearby real estates [7]. Some research has generally found a relationship of statistically significant to effect of these features, especially glass laboratory and industrial district, distance and density of surrounding industry affects price of accommodation. The sectorial also affects housing prices.
Figure 6. (a) Describe potential impact of distance to nearest green area on price of housing, resulting from spatial pattern of green spaces and Characteristics; (b) relationship between distance –price [11]
Third: spatial characteristics data
A) Ease of access variables: Variables define accessibility to local facilities [13] In this research, accessibility measure was calculated time of travelling (minutes) from each house to both public areas and CBD by vehicle or Walk along different types of roads.
B) Landscape measures: The spatial pattern (organization and composition) and land use around Green Zone will also affect price of real estate and land alike. The landscape environment has become one of fastest developing areas. One reason is that spatial type can be analyzed through extensive use of landscape scales [14].
Results of estimated parameters are given in Table 4&5. Resulting of estimated coefficients using both multi-regression linear and model semi-log. were shown in accordance with expectations. Where it provides indication that characteristics of green areas significantly affect prices of real estate. most noteworthy finding from regression analysis is that effect of aggregation of green areas and their number is positive. A 500-meter radius around properties is small for city scale but it is enough so that all green areas, whether grouped or fragmented, increase value of property around it within this circle. Semi-log model of real estate price is a slightly better functional form dependent variable, which has improved two variables: patches number of green areas and richness of it. But on other hand, Semi-log model is prevented from price of real estate and not included in model of variables: type of green space and area each one of them.
Positive effect of types of green areas indicates that different types of public green spaces of different characteristics differ in their effect on price of housing. Measurements of spatial landscape, richness of land use area and density of their have a negative impact on prices of neighboring houses. Environmental chaos has little to do with impact on home prices, confirming that nearby industrial pollutants are reducing value of property.
Results can be summarized as:
(1) Constant value is positive because of basic price of properties, regardless of additional features. It notes that variables chosen have given explanatory power to reflect residents' preferences by choosing location of house.
(2) Horticulture Distance Index (Park) revealed that proximity to orchard had a positive impact on comfort and increased house price by 5% for each increase in index. However, two distance indicators for other distances (distance from park size and distance from yard, park and orchard) did not show even importance at 10% level.
(3) Richness for land use variable has a strong negative impact on housing values, noting that people prefer to live in comfortable environment with homogeneous land use in vicinity of their homes.
(4) Properties that are associated with greenery have higher property values, with every single percentage of greenery adding about 2.1% to price per square meter.
(5) Access to orchards was not very significant at 10%, while access to squares and gardens was significant at 5%. Easy access to squares showed little higher importance than access to parks. A 1% improvement in access to yards and gardens will result in an increase price of square meter: 1.8 and 1.6%, respectively
(6) Important and positive impact of location has shown that people prefer to live in South and West of Ramadi.
(7) Positive effect of number of spots confirms that increasing number of green areas increases value of residential land or real estate. However, a negative signal has emerged for richness of greenery that suggests that increasing this type of public greenery around property can reduce price of houses. Although richness of urban green spaces will lead to more opportunities for recreation, but at same time will have negative effects such as noise and night lights.
• Characteristics of urban green spaces have a weak impact on real estate prices in Ramadi city due to their locations, small areas and irregular distribution.
• Effect of green area collection and number of patches is both positive on real estate prices but uneven in impact.
• Due to demand for land in urban areas, distribution of green areas (even if scattered) and increased number of patches will lead to positive values favored by people, especially in crowded center of Ramadi city.
• Percentage of green areas has a strong positive impact on housing prices, Because of its convenience, leisure and clean environment.
• Different indicators of distance from green areas have a positive effect on prices of selling homes, especially in a hot dry environment with temperatures up to 50°C.
• Low duration and cost of access to public green areas and CBD have a significant positive impact on property prices, especially if paths are green or paved with emphasis on walking and cycling, which is one of most important principles of sustainable transport. The city of Ramadi has this advantage significantly.
• Positive effects of different types of green spaces differ in their impact on price of houses according to different characteristics in terms of size, number, richness, location or urban design. It has no negative impact.
• The degree of spatial appearance (view out) of land use, richness of land use, its intensity and its high diversity (mixed use) have a positive impact on prices of neighboring houses, with high availability and high permeability, transportation options and proximity from secondary centers in Ramadi.
• Although environmental imbalance has a weak relation to real estate prices, but it is statistically significant with values, which confirms that nearby pollution of industrial weaken prices especially that heavy factories have become in center of city of Ramadi because of continuous expansion. Another important point is site of contaminated factories in north-west with direction of prevailing winds and Euphrates River, which requires Department of Environment to raise this use in order to preserve environment.
The research is an attempt to design statistical models to evaluate values of amenities for green areas in city of Ramadi, and it is highlighted that these incentive models can be developed or improved through spatial variables, thus contributing to further planning in economy and environment, thus promoting development of environmental economy.
Concepts of interaction, educational environment, need for environmental quality, and index of distances have provided possibility of using variables of specifications in model, which is clearly distinguished from some previous studies on environment in Ramadi. Where many factors that may affect real estate market have been listed.
Integration of economy and natural and hydrological environment (presence of two rivers in city) is an objective that deserves considerable benefits with simulation of systematic analysis involving spatial analysis. In this study, six measures of landscape (percentage of green space in urban areas, richness of area of green areas, number of patches of green space, collection of green spaces, density of land uses and intensity of land use) are available in model, allowing a more complete interpretation Of economic value of green areas, which is reflected in diversity of land uses and land prices.
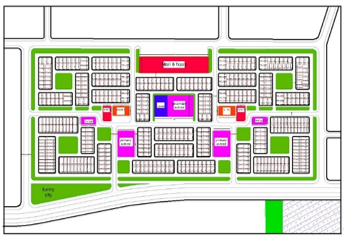
Results of modeling can be used to devise policy decisions on conservation and distribution in urban green areas. For example, negative impacts of access to green landscape on river and positive impact of index of green space and location of housing sector on housing prices indicate that t population appreciates larger green areas that are easily accessible. However, there is a real conflict between attractiveness of green landscape and its protection as riverfront areas in the city of Ramadi, raising need to develop initiatives to preserve / privatize many public green areas. In addition to evaluating value of green space, spatial analysis of impact of comfort on distribution of land use patterns can also contribute to policies analysis and urban design, particularly in helping to target detailed area planning, and contribute to understanding potential values lost when green areas are fade. In addition, public culture and awareness and expected results that construction of new green spaces in urban areas will raise real estate values and help investors to greening environment and development of more public green areas in residential projects in Ramadi city (Figure 7).
Figure 7. Designing a green residential neighborhood in Ramadi (2019). Researcher from Anbar
The updated urban master plan for Ramadi (2015) has been designed so that development of urban in West and to a lesser extent, to east. However, statistical significance of real estate prices, density of area of green space, Easy access to green spaces and their spatial distribution all show that existing green spaces are inadequate, implying that a balance should be made in green space facilities anywhere. It is therefore proposed to reduce new green areas in eastern and northern regions in order to reduce encroachment on landscape with preserve area's respiration. Research also recommends that procedures of land use planning should include systematic evaluation benefits of green spaces, with a critical assessment of loss environmental facilities when considering alternatives and densities. All of this would contribute to reorientation of urbanization and sustainable development in urban areas.
Although estimated coefficients of 17 variables were all consistent with expected values, and although they may be critical, present study has some limitations that deserve further studies, as:
-Reasonable house values were available only for 2018.
-Relatively low value of R2 is due to size of small sample.
-Social awareness of values of green space can be linked to social factors. For example, a family with children can put more value near learning environment than environmental facilities.
Finally, researches on environmental and economic valuation of green space is still relatively limited in Iraq. As a result, it is hoped that results of research will be reference for assessment of green space in cities of Iraq. The study has contributed to determining economic value of green areas and its significant positive effects on real estate prices, but institutional and cultural differences between countries make difficult in comparing results. Research on environmental and economic assessment of urban green space in Iraq remains relatively limited. As a result, it is hoped that results of research will offer a resource for assessment of green area and provide common economic, social and environmental criteria as a guide for urban planners and designers.
This research was written in Center for Urban and Regional Planning, at University of Baghdad. So, we thank Center’s teaching staff and real estate owners in Ramadi.
[1] Tyrvainen, L., Miettinen, A. (2000). Property prices and urban forest amenities. Journal of Environmental Economics and Management, 39(2): 205-223. https://doi.org/10.1006/jeem.1999.1097
[2] Miller, R.W. (1997). Urban Forestry: Planning and Managing Urban Green Spaces. 2nd ed. Prentice-Hall, Englewood Cliffs, NJ, p. 502.
[3] Sengupta, S., Osgood, D.D. (2003). The value of remoteness: A hedonic estimation of ranchette prices. Ecological Economics, 44(1): 91-103. https://doi.org/10.1016/S0921-8009(02)00254-9
[4] Price, C. (2000). Valuation of unpriced products: contingent valuation, cost benefit analysis and participatory democracy. Land Use Policy, 17(3): 187-196. https://doi.org/10.1016/S0264-8377(00)00020-X
[5] Dwyer, J.F., Peterson, G.L., Darragh, A.J. (1983). Estimating the value of urban forests using the travel cost method. J. Arboriculture, 9: 182– 185.
[6] Geoghegan, J., Wainger, L.A., Bockstael, N.E. (1997). Analysis spatial landscape indices in a hedonic framework: an ecological economics analysis using GIS. Ecol. Econ., 23(3): 251-264. https://doi.org/10.1016/S0921-8009(97)00583-1
[7] Brasington, D.M., Hite, D. (2005). Demand for environmental quality: A spatial hedonic analysis. Regional Sci. Urban Econ., 35(1): 57-82. https://doi.org/10.1016/j.regsciurbeco.2003.09.001
[8] Din, A., Hoesli, M., Bender, A. (2001). Environmental variables and real estate prices. In: the series papers with number 2001.04. Ecole des Hautes Etudes Commerciales, University de Geneve, Switzerland. https://doi.org/10.1080%2F00420980120080899
[9] Cheshire, P., Sheppard, S. (1995). On the price of land and the value of amenities. Economica, 62(246): 247-267.
[10] Morancho, A.B. (2003). A hedonic valuation of urban green areas. Landsc. Urban Plann., 66(1): 35-41. https://doi.org/10.1016/S0169-2046(03)00093-8
[11] Kong, F.H., Yin, H.W., Nakagoshi, N. (007). Using GIS and landscape metrics in the hedonic price modeling of the amenity value of urban green space: A case study in Jinan City, China. Landscape and Urban Planning, 79(3-4): 240-252. https://doi.org/10.1016/j.landurbplan.2006.02.013
[12] Goodman, A.C., Thibodeau, T.G. (1998). Housing market segmentation. J. Housing Econ., 7(2): 121-143. https://doi.org/10.1006/jhec.1998.0229
[13] Lake, I., Lovett, A.A., Bateman, I., Day, B. (2000). Using GIS and large-scale digital data to implement hedonic pricing studies. Int. J. Geograph. Inform. Sci., 14(6): 521-541. https://doi.org/10.1080/136588100415729
[14] Li, H., Wu, J.G. (2004). Use and misuse of landscape indices. Landsc. Ecol., 19: 389-399. https://doi.org/10.1023/B:LAND.0000030441.15628.d6