Hong Li | Ting Wu* | Juan Ran | Jijuan Zhan | Yongtao Zhu
© 2020 IIETA. This article is published by IIETA and is licensed under the CC BY 4.0 license (http://creativecommons.org/licenses/by/4.0/).
OPEN ACCESS
The production and supply of fresh agricultural products (APs) vary greatly with seasons and regions. However, there is no seasonality or regionality in consumer demand for such products. The supply-demand contradiction hinders the coordinated development of agriculture and logistics. To solve the contradiction, this paper measures the level of fruit and vegetable (F&V) specialized production, and evaluates the quality of front-end cold-chain (FECC) logistics. Next, the coupling degree model was extended into a coupling coordination model. Taking Xinjiang as the study area, the authors empirically analyzed the coupling coordination between the specialized production level of vegetables and the quality of FECC logistics, and that between the specialized production level of fruits and the quality of FECC logistics. The results show that the spatial coupling coordination between F&V specialized production and FECC logistics is relatively low in Xinjiang; the dynamic coupling coordination between fruit industry and FECC logistics is lower than that between vegetable industry and FECC logistics; the incoordination and slight coordination are attributable to the insufficient supports of FECC logistics, and the low strength of specialized production. Finally, several countermeasures were put forward to improve the coupling coordination between F&V specialized production and FECC logistics in Xinjiang. The research findings shed new light on sustainable development of cold chain logistics for fresh APs.
specialized production of fruits and vegetables (F&V), front-end cold-chain (FECC) logistics, dynamic factor analysis, spatial coupling
China has entered a new normal of economic growth. The growth pattern must be resource efficient and friendly to the environment. Therefore, relevant departments have prepared a series of incentive policies to modernize agriculture and synergize it with secondary and tertiary industries. In 2020, the central government promised to develop farmlands to a high standard, improve distribution facilities and market for agricultural products (APs), and promote the industry chain and value chain of agriculture. With the aim to ensure food safety and upgrade the consumption structure, the State Council shared its opinions on the development of cold-chain logistics: APs producers should build front-end cold-chain (FECC) facilities of reasonable sizes, deploy advanced cold-chain equipment, and enjoy favorable policies on first-mile delivery.
The production and supply of fresh APs vary greatly with seasons and regions. However, there is no seasonality or regionality in consumer demand for such products. The supply-demand contradiction hinders the coordinated development of agriculture and logistics. On the one hand, the decentralized farmlands, coupled with inefficient circulation of APs, make it difficult to provide the integrated resources required for specialized production; on the other hand, the existing FECC facilities are insufficient to deliver fresh APs in large quantities, due to the short shelf life and high logistics costs of fresh APs. The above problems with the production and delivery of fresh APs could be solved through largescale production and intensive operations.
According to systems theory, the coordination of a system depends on the elements of each subsystem and the synergy between subsystems. If the elements are ideal and the synergy is good, the overall function of the system will surpass the functions of all subsystems combined [1]. Therefore, the specialized agriculture and FECC logistics in a region should be coupled to achieve coordinated development between the two factors [2]. The largescale production of specialized APs enables FECC logistics to provide efficient and professional services at low costs. Meanwhile, advanced FECC logistics guarantee the first-mile delivery of fresh APs like fruits and vegetables (F&V), giving impetus to the development of modern, specialized agriculture. To sum up, there is a mutualistic relationship between F&V specialized production and FECC logistics.
Developed countries have long been developing and exploring F&V specialized production, as well as cold-chain logistics of fresh APs. The existing studies mainly focus on spatial economics of APs [3], logistics efficiency [4, 5], supply chain coordination [6], operation of cold-chain logistics [7], to name but a few. Based on the spatial economics theory, some scholars discussed the economic issues of logistics in the spatial dimension [8], and analyzed regional economic changes based on spatial interaction [9], highlighting the importance of the coupled operations between economy, resources and environment to the sustainability of urban development [10, 11]. Some scholars evaluated how economic growth is influenced by the capacity of F&V production agglomeration and the spatial clustering of cold-chain logistics [12, 13], and proved that spatial proximity, a key metric of agglomeration, is an important feature of cold-chain logistics. However, the previous research basically overlooks the dynamic relationship between the F&V specialized production and cold-chain logistics [14]. The precooling technique, which is critical to the fresh storage of F&V products, and first-mile delivery system are relatively mature [15-17]. On this basis, it is very meaningful to grasp the spatial features of F&V specialized production and FECC logistics: these features help to identify the spatial and temporal laws of regional economy, making the economy more coordinated and sustainable [18, 19].
In the early 1970s, Chinese scholars started to study the precooling and fresh storage of F&V. Their research clarifies the role of precooling in the cold chain of fresh APs, and discloses how each precooling method affects the shelf life and quality of F&V [20, 21]. Despite its importance to fresh APs production, FECC facilities have not been widely constructed in underdeveloped regions. Currently, the Chinese government subsidizes the primary processing of APs based on the resource allocation, integration ability, devotion, and funding. However, there is no dynamic mechanism to evaluate or track whether the subsidies promote the coordinated development between specialized production and the FECC logistics [22]. Moreover, there is no report that systematically measures the quality of FECC logistics [23], not to mention how the quality of FECC logistics adapts to or matches with the level of specialized production. To make up for these gaps, it is highly necessary to evaluate the coupling and coordinated development between F&V specialized production and FECC logistics in each region, and find out the causes of the regional difference in coupling coordination degree. After all, the demand for FECC logistics directly depends on the spatial distribution and evolution features of F&V specialized production in superior producing regions. Without these features, it is impossible to rationalize the spatial structure or provide precise services of FECC logistics for F&V.
Through the above analysis, this paper measures the level of F&V specialized production and the quality of FECC logistics in Xinjiang, China. On this basis, a coupling coordination model was established to evaluate the coupling coordination degree between the level of F&V specialized production and the quality of FECC logistics in each region of Xinjiang. Through horizontal and vertical comparisons, the regional differences in coupling coordination degree were identified and explained. Finally, several countermeasures were put forward to minimize the differences and promote the coupling and coordinated development between F&V specialized production and FECC logistics.
2.1 Location quotient
Location quotient reflects the degree of specialized production. It measures the distribution of the production factors of an industry in various regions. The quotient is often adopted to judge whether an industry is sufficiently specialized in a region. The location quotient of industry j in region i in year t can be calculated by:
$L{{Q}_{ijt}}=\frac{{{{e}_{ijt}}}/{{{e}_{it}}}\;}{{{{E}_{jt}}}/{{{E}_{t}}}\;}$ (1)
where, eijt is the output of industry j in region i in year t; eit is the output of major APs in region i in year t; Ejt is the total output of industry j in Xinjiang in year t; Et is the total output of major APs in Xinjiang in year t.
In this paper, the location quotients of vegetable industry and fruit industry are denoted as LQ_V and LQ_F, respectively.
2.2 Dynamic factor analysis
Dynamic factor analysis is a multivariate statistical method that effectively combines principal component analysis (PCA) and linear regression. During the analysis, a 3D array is constructed based on samples, variables, and time, and used to compare the states of different regions in both spatial and temporal dimensions. The specific steps of dynamic factor analysis are as follows:
Step 1. Normalize the 3D data to eliminate the impact of dimensional difference;
Step 2. Derive the mean covariance matrix ST from the covariance matrix S(t) of each year:
${{S}_{T}}=\frac{1}{T}\sum\nolimits_{t=1}^{T}{S(t)}$ (2)
Step 3. Solve the eigenvalues and eigenvectors of the mean covariance matrix ST, and find the variance contribution rate and cumulative variance contribution rate of each common factor.The mean covariance matrix fully displays the impacts from static structural difference and dynamic changes of data.
Step 4. Extract the common factors and establish the initial factor loading matrix.
Step 5. Construct the static score matrix of each sample:
${{C}_{ih}}=(\overline{{{Z}_{i}}}-\overline{Z})'{{a}_{h}},\text{ }i=1,2,\ldots I;t=1,2,\ldots T$ (3)
where, $\overline{Z_{i}}=\frac{1}{T} \sum_{t=1}^{T} Z_{i t}$ is the mean vector of each sample; $\bar{Z}=\frac{1}{I} \sum_{i=1}^{I} \bar{Z}_{i}$ is the mean vector of the sample set.
Step 6. Calculate the dynamic score of each sample:
${{C}_{iht}}=({{Z}_{it}}-\overline{{{Z}_{t}}})'{{a}_{h}},h=1\ldots k,t=1\ldots T$ (4)
where, $\bar{Z}_{t}=\frac{1}{I} \sum_{i=1}^{I} Z_{i t}$ is the mean of each variable in year t.
Step 7. Calculate the mean score E based on the dynamic scores of the samples in each year:
$E=\frac{1}{T}\sum{{{C}_{iht}}}$ (5)
2.3 Coupling coordination model
The coupling degree describes how much systems (subsystems) or elements interact with and influence each other. It is a mirror of the static coupling state between systems (subsystems) or elements. Coupling coordination degree reflects the degree of harmony and consistency between systems or elements during development, i.e. the dynamic changes and variation in coordinated state of a system in disorderly (low-level) and orderly (high-level) development.
Inspired by the physical model of capacity coupling coefficient, a coupling degree model was established for the level of F&V specialized production and the quality of FECC logistics:
${{C}_{t}}=\sqrt{\frac{{{U}_{xt}}\times {{U}_{yt}}}{{{({{U}_{xt}}+{{U}_{yt}})}^{2}}}}$ (6)
The coupling degree model accurately measures the interaction and influence between systems (subsystems) or elements, yet fails to reflect the coordination degree of the interactive development. For example, the coupling degree model could output a high value if F&V specialized production and FECC logistics are both immature in a region. It is impossible to know whether the two factors have synergistic effect, or how coordinated is their interactive development.where, Uxt is the level of F&V specialized production in year t; Uyt is the quality of FECC logistics in year t. The coupling degree Ct is positively correlated with the relevance between the two factors. A high Ct means F&V specialized production and FECC logistics interact with and influence each other; a low Ct means the two factors each develops in its own ways.
To solve the problem, the coupling degree model was extended into a coupling coordination degree model:
${{D}_{t}}={{(C\times T)}^{\frac{1}{2}}}$, $T=\alpha {{U}_{xt}}+\beta {{U}_{yt}}$ (7)
The coupling coordination degree Dt is positively correlated with the coordination between the two factors during coupling development. A high Dt means F&V specialized production and FECC logistics are well coordinated; a low Dt means F&V specialized production and FECC logistics are poorly coordinated.where, T is the coordination index about how much the overall development of F&V specialized production and FECC logistics contributes to the coupling coordination degree; α and β are two undetermined parameters, respectively reflecting the importance of the level of F&V specialized production and the quality of FECC logistics. Both factors are equally important to the coordinated development process. Thus, the values of α and β were both set to 0.5.
2.4 Evaluation index system
Evaluation index system is an organic collection of indies that reflect the various features and their correlations of the evaluation object(s). The system must be reasonable and operable, and describe the object(s) in a systematic and objective manner. Considering our research objects and purposes, this paper sets up an evaluation index system for the quality of FECC logistics (FECCLS) in F&V producing regions based on expert survey and relevant literature.
Once harvested, F&V must be always kept at a low temperature, making FECC facilities a must have. The quality of F&V FECC logistics is affected by all the relevant elements in the whole logistics process. Therefore, our evaluation index system should consider relevant industries, operating environments, as well as suppliers and consumers, and have both similarities with and differences from the evaluation index system for regional logistics development.
Table 1. Our evaluation index system
|
Primary indices |
Secondary indices |
Tertiary indices |
|
Regional economy |
Overall economic level |
Gross domestic product (GDP) |
|
Per-capita economic level |
Per-capita GDP |
|
|
Population density |
Population per unit of land area |
|
|
Urbanization |
Proportion of urban population in total population |
|
|
Supply-demand |
Supply volume |
Agricultural output value |
|
Consumption scale |
Total retail sales of consumer goods |
|
|
Trade scale |
F&V import and export |
|
|
Logistics capacity |
Agricultural machinery transport volume |
|
|
Logistics environment |
Logistics output |
Output of transport, warehousing, and mailing industry |
|
Logistics development |
Proportion of transport, warehousing, and mailing industry in tertiary industry |
|
|
Social reproduction conditions |
Total fixed assets investment in transport, warehousing, and mailing industry |
|
|
Rural logistics labor force |
Proportion of rural employees in transport, warehousing, and mailing industry |
|
|
Agricultural infrastructure |
Freshness of precooled products |
Number of cold-storage equipment |
|
Agricultural mechanization |
Total power of agricultural machinery |
|
|
Energy consumption |
Rural electricity consumption |
|
|
Agricultural facilities |
Total area of facilities |
Note: 1. “F&V import and export” is measured by the local standards of importers and exporters (Source: Urumqi Customs District); 2. “Agricultural machinery transport volume” refers to the total volume (unit: ton·km) of field transport, highway transport, and water transport by various agricultural machinery in the current year (Source: Statistical Reporting System of Xinjiang Agricultural Machinery Administration); 3. “Number of cold-storage equipment” refers to the number of cold-storage equipment used to store the harvested APs (Source: Statistical Reporting System of Xinjiang Agricultural Machinery Administration); 4. “Total area of facilities” refers to the total area of polytunnels, solar greenhouses, and multi-span greenhouses in the current year (Source: Statistical Reporting System of Xinjiang Agricultural Machinery Administration); 5. All the other tertiary indices were collected from the Xinjiang Statistical Yearbooks.
Drawing on existing evaluation index systems for regional logistics development, our evaluation index system for the quality of F&V FECC logistics was constructed in reference to the latest findings on cold-chain logistics of fresh Aps [24, 25]. Focusing on the first-mile delivery, the established system (Table 1) covers four aspects, namely, regional economy, supply-demand, logistics environment, and agricultural infrastructure.
Our evaluation index system differs from the evaluation index systems for regional logistics development in the following aspects: “supply volume” was added as a secondary index, with “agricultural output value” as its tertiary index; the tertiary index of “trade scale” was clearly defined as “F&V import and export”; the secondary index “freight scale” was adjusted to “logistics scale”, with “agricultural machinery transport volume” as its tertiary index; “agricultural infrastructure” was introduced as a new primary index, which covers four secondary indices: “freshness of precooled products”, “agricultural mechanization”, “energy consumption”, and “technology of agricultural facilities”.
3.1 Specialized production level of vegetables
The LQ_Vs from 2000 to 2016 in different regions of Xinjiang were calculated by formula (1), and sorted in descending order based on the results in 2016. The calculated LQ_Vs are listed in Table 2, with maximum and minimum values underlined.
The specialized production level of vegetable industry in each region was evaluated based on the location quotient. The greater the LQ_V, the better the specialized production. The regions with greater-than-one LQ_Vs were considered superior in specialized production of vegetables. For convenience, the LQ_V trends of the superior regions are displayed in Figure 1 below.
As shown in Figure 1, Urumqi had the highest LQ_V in most years, which exhibits a U-shaped trend. This is because Urumqi boasts the most specialized techniques of vegetable production in Xinjiang, although its vegetable output only reaches the medium level.
The LQ_V of Bayangol remained at a high level, only below that of Urumqi. The excellence of Bayangol in specialized production stems from its large scale of vegetable production.
Karamay, as an oil city, is relatively weak in agriculture. The vegetable output of Karamay was small before 2012, albeit the three-digit growth in several years. In recent years, the LQ_V of Karamay surged up, due to the continuous growth of vegetable output. The vegetable industry in Karamay is moving towards a specialized sector.
Changji is a major producing region of vegetables. The LQ_V of this region fluctuated slightly with the changes in vegetable output. With the decline in vegetable output, the LQ_V showed a slight decline the fluctuation process. However, this region still has a strong advantage in specialized production.
Despite the recent plunge, the LQ_V of Tacheng was above the general level of Xinjiang in most years, an evidence to the region’s high capacity of specialized production.
Table 2. LQ_Vs in different regions of Xinjiang from 2002 to 2016
|
Regions |
2002 |
2003 |
2004 |
2005 |
2006 |
2007 |
2008 |
2009 |
2010 |
2011 |
2012 |
2013 |
2014 |
2015 |
2016 |
|
Urumqi |
3.07 |
2.95 |
2.65 |
2.93 |
2.77 |
2.35 |
2.28 |
2.05 |
2.26 |
2.06 |
2.42 |
2.50 |
2.70 |
2.76 |
3.07 |
|
Bayingol |
1.84 |
2.01 |
1.95 |
1.95 |
2.05 |
2.01 |
1.96 |
1.93 |
2.09 |
2.12 |
2.04 |
2.18 |
2.21 |
2.28 |
2.20 |
|
Karamay |
0.81 |
0.13 |
0.51 |
0.67 |
0.58 |
0.43 |
0.81 |
0.60 |
0.77 |
1.30 |
1.25 |
1.37 |
1.55 |
1.13 |
1.62 |
|
Changji |
1.71 |
1.80 |
1.97 |
1.87 |
1.77 |
1.74 |
1.64 |
1.55 |
1.47 |
1.45 |
1.49 |
1.31 |
1.45 |
1.38 |
1.45 |
|
Tacheng |
1.38 |
1.52 |
1.53 |
1.80 |
1.57 |
1.54 |
1.59 |
1.45 |
1.27 |
1.27 |
1.06 |
0.98 |
0.99 |
1.06 |
1.10 |
|
Hami |
1.09 |
0.75 |
0.57 |
0.51 |
0.48 |
0.57 |
0.57 |
0.51 |
0.61 |
0.71 |
0.73 |
0.71 |
0.70 |
0.74 |
0.91 |
|
Kashgar |
0.60 |
0.68 |
0.60 |
0.59 |
0.68 |
0.71 |
0.73 |
0.78 |
0.77 |
0.80 |
0.92 |
1.00 |
0.86 |
0.86 |
0.83 |
|
Hotan |
0.43 |
0.31 |
0.37 |
0.53 |
0.57 |
0.55 |
0.57 |
0.59 |
0.69 |
0.58 |
0.62 |
0.61 |
0.53 |
0.57 |
0.60 |
|
Aksu |
0.57 |
0.52 |
0.48 |
0.49 |
0.50 |
0.66 |
0.67 |
0.50 |
0.54 |
0.56 |
0.67 |
0.59 |
0.58 |
0.58 |
0.59 |
|
Ili |
0.63 |
0.57 |
0.60 |
0.56 |
0.51 |
0.39 |
0.46 |
0.56 |
0.55 |
0.53 |
0.51 |
0.59 |
0.55 |
0.54 |
0.54 |
|
Turpan |
0.61 |
0.59 |
0.49 |
0.63 |
0.65 |
0.56 |
0.56 |
0.54 |
0.62 |
0.68 |
0.66 |
0.60 |
0.62 |
0.59 |
0.50 |
|
Kizilsu |
0.30 |
0.29 |
0.21 |
0.19 |
0.26 |
0.19 |
0.19 |
0.15 |
0.20 |
0.20 |
0.24 |
0.25 |
0.26 |
0.28 |
0.26 |
|
Bortala |
0.33 |
0.34 |
0.44 |
0.30 |
0.16 |
0.23 |
0.13 |
0.20 |
0.43 |
0.33 |
0.14 |
0.16 |
0.26 |
0.24 |
0.18 |
|
Altay |
0.38 |
0.19 |
0.20 |
0.25 |
0.25 |
0.34 |
0.36 |
0.29 |
0.29 |
0.23 |
0.20 |
0.15 |
0.19 |
0.00 |
0.13 |
Figure 1. LQ_V trends of superior regions in specialized production of vegetables
Table 3. LQ_Fs in different regions of Xinjiang from 2002 to 2016
|
Regions |
2002 |
2003 |
2004 |
2005 |
2006 |
2007 |
2008 |
2009 |
2010 |
2011 |
2012 |
2013 |
2014 |
2015 |
2016 |
|
Turpan |
6.88 |
6.64 |
6.14 |
5.81 |
5.67 |
5.50 |
5.35 |
5.42 |
5.19 |
5.12 |
4.62 |
4.79 |
4.48 |
4.66 |
4.19 |
|
Kizilsu |
1.39 |
1.72 |
1.81 |
2.22 |
2.14 |
2.47 |
2.53 |
3.36 |
3.27 |
3.19 |
2.79 |
2.57 |
2.45 |
2.37 |
1.90 |
|
Aksu |
1.43 |
1.37 |
1.38 |
1.39 |
1.51 |
1.90 |
1.76 |
1.72 |
2.00 |
2.27 |
2.03 |
2.18 |
2.28 |
2.13 |
2.05 |
|
Hami |
1.61 |
1.73 |
1.63 |
1.52 |
1.49 |
1.28 |
1.21 |
1.24 |
1.42 |
1.26 |
1.31 |
1.54 |
1.16 |
1.44 |
1.18 |
|
Hotan |
1.53 |
1.32 |
1.17 |
1.25 |
1.21 |
1.30 |
1.33 |
1.44 |
1.23 |
1.41 |
1.26 |
1.43 |
1.61 |
1.67 |
1.63 |
|
Kashgar |
1.19 |
1.18 |
1.24 |
1.23 |
1.35 |
1.32 |
1.18 |
1.20 |
1.02 |
1.26 |
1.12 |
0.97 |
1.01 |
1.06 |
1.06 |
|
Bayangol |
1.06 |
0.95 |
0.96 |
1.12 |
1.15 |
0.95 |
0.93 |
0.99 |
1.14 |
0.63 |
0.88 |
0.96 |
1.03 |
0.88 |
0.87 |
|
Ili |
0.33 |
0.35 |
0.34 |
0.31 |
0.26 |
0.22 |
0.18 |
0.29 |
0.40 |
0.45 |
0.44 |
0.44 |
0.44 |
0.42 |
0.39 |
|
Changji |
0.29 |
0.38 |
0.34 |
0.33 |
0.30 |
0.28 |
0.24 |
0.24 |
0.25 |
0.21 |
0.26 |
0.19 |
0.20 |
0.23 |
0.22 |
|
Urumqi |
0.04 |
0.08 |
0.14 |
0.22 |
0.20 |
0.18 |
0.17 |
0.15 |
0.10 |
0.11 |
0.08 |
0.06 |
0.06 |
0.07 |
0.08 |
|
Tacheng |
0.06 |
0.09 |
0.06 |
0.07 |
0.05 |
0.04 |
0.05 |
0.05 |
0.05 |
0.04 |
0.04 |
0.06 |
0.07 |
0.07 |
0.08 |
|
Bortala |
0.12 |
0.11 |
0.10 |
0.08 |
0.08 |
0.05 |
0.05 |
0.04 |
0.03 |
0.02 |
0.03 |
0.05 |
0.02 |
0.02 |
0.03 |
|
Altay |
0.00 |
0.00 |
0.01 |
0.01 |
0.01 |
0.01 |
0.01 |
0.01 |
0.01 |
0.01 |
0.01 |
0.01 |
0.08 |
0.08 |
0.11 |
|
Karamay |
0.00 |
0.00 |
0.00 |
0.00 |
0.00 |
0.00 |
0.00 |
0.00 |
0.00 |
0.00 |
0.00 |
0.00 |
0.04 |
0.03 |
0.01 |
Figure 2. LQ_F trends of superior regions in specialized production of fruits
3.2 Specialized production level of fruits
The LQ_Fs from 2000 to 2016 in different regions of Xinjiang were calculated by formula (1), and sorted in descending order based on the results in 2016. The calculated LQ_Vs are listed in Table 3 above, with maximum and minimum values underlined.
The regions with greater-than-one LQ_Fs were considered superior in specialized production of fruits. For convenience, the LQ_V trends of the superior regions are displayed in Figure 2 above.
Figure 2 shows a high regional difference in LQ_F. On average, Turpan achieved higher LQ_F than any other region, about twice that of the runner-up Kizilsu. Hence, Turpan is the undisputed leader in specialized production of fruits.
Besides, the LQ_F of individual regions basically stabilized in the observation period, with very limited oscillations. The trend lines of the top three regions, namely, Turpan, Kizilsu, and Aksu, rarely intersected each other throughout the observation period. The results show the lack of competition and mutual influence between the superior regions of fruit production. Each superior region is busy building their own fist products.
3.3 Quality of FECC logistics
Through dynamic factor analysis, the static score, dynamic score, and mean sore of the quality of F&V FECC logistics were calculated for each region in Xinjiang, and sorted in descending order by the mean score. The calculated results are presented in Table 4 below, where zeros mean the quality is below the average of Xinjiang.
As shown in Table 4, Urumqi greatly outperformed the other regions in the quality of F&V FECC logistics. Lies at the core of the Silk Road Economic Belt, Urumqi is the center stage of Xinjiang in economy, politics, culture, science, education, and transport. Dynamic factor analysis shows that this region enjoys high regional advantages in logistics supply-demand and agricultural-rural development. These advantages are reflected in terms of GDP, population density, consumption scale, supply volume, agricultural mechanization, energy consumption, and agricultural facilities.
Four regions were above the average quality of F&V FECC logistics in Xinjiang, including Changji, Karamay, Ili, and Bayangol. The quality of FECC logistics varies between these regions, and depends on different factors. Among them, Changji has geographical advantages in agricultural-rural development, logistics infrastructure, as well as the trade and logistics of APs, thanks to its proximity to Urumqi. The regional advantages of Karamay focus on energy economy and urban construction. Ili excels in the trade and logistics of APs, because of its large agricultural trade ports. Bayangol has certain advantages in logistics capacity and logistics infrastructure, but falls short in many other aspects. That is why its F&V FECC logistics is of average quality.
For different reasons, the other regions were below the average level of Xinjiang in the quality of F&V FECC logistics. Kashgar, Aksu, and Hotan were inactive in logistics supply-demand; Kizilsu is clearly inferior in agricultural-rural development and logistics infrastructure; Hotan and Turpan are weak in urban economy.
Table 4. Static and mean scores of the quality of F&V FECC logistics in different regions of Xinjiang from 2002 to 2016
|
Regions |
2012 |
2013 |
2014 |
2015 |
2016 |
Mean score |
Static score |
Rank |
Grade |
|
Urumqi |
2.712 |
2.673 |
3.165 |
3.734 |
3.119 |
3.081 |
2.200 |
1 |
High |
|
Changji |
0.684 |
0.695 |
0.778 |
1.061 |
0.945 |
0.833 |
0.595 |
2 |
General |
|
Karamay |
0.516 |
0.567 |
0.367 |
0.087 |
0.263 |
0.360 |
0.257 |
3 |
|
|
Ili |
0.161 |
0.144 |
0.145 |
0.314 |
0.190 |
0.191 |
0.136 |
4 |
|
|
Bayangol |
0.085 |
0.094 |
0.090 |
-0.005 |
0.036 |
0.060 |
0.043 |
5 |
|
|
Hami |
-0.184 |
-0.153 |
0.053 |
-0.257 |
-0.103 |
-0.129 |
-0.092 |
6 |
Strongly low |
|
Kashgar |
-0.347 |
-0.284 |
-0.162 |
-0.064 |
0.008 |
-0.170 |
-0.121 |
7 |
|
|
Aksu |
-0.208 |
-0.196 |
-0.414 |
-0.361 |
-0.289 |
-0.294 |
-0.210 |
8 |
|
|
Bortala |
-0.320 |
-0.335 |
-0.278 |
-0.446 |
-0.418 |
-0.360 |
-0.257 |
9 |
|
|
Tacheng |
-0.338 |
-0.260 |
-0.379 |
-0.492 |
-0.481 |
-0.390 |
-0.278 |
10 |
|
|
Turpan |
-0.500 |
-0.537 |
-0.701 |
-0.732 |
-0.570 |
-0.608 |
-0.434 |
11 |
|
|
Altay |
-0.503 |
-0.557 |
-0.598 |
-0.727 |
-0.818 |
-0.640 |
-0.457 |
12 |
|
|
Hotan |
-0.845 |
-0.914 |
-0.979 |
-0.908 |
-0.797 |
-0.889 |
-0.635 |
13 |
|
|
Kizilsu |
-0.913 |
-0.938 |
-1.087 |
-1.204 |
-1.084 |
-1.045 |
-0.747 |
14 |
Slightly low |
4.1 Coupling coordination analysis
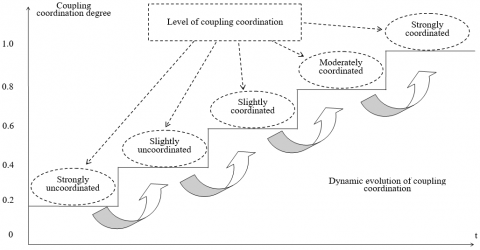
According to relevant literature, the coupling coordination degree was evenly divided into five levels: strongly uncoordinated (0.0-0.2 point), slightly uncoordinated (0.2-0.4 point), slightly coordinated (0.4-0.6 point), moderately coordinated (0.6-0.8 point), and strongly coordinated (0.8-1.0 point). The coupling coordination between the level of F&V specialized production and the quality of FECC logistics is illustrated in Figure 3.
As shown in Figure 3, F&V specialized production and FECC logistics became more and more coordinated with the elapse of time. Overall, the level of coupling coordination gradually shifted from strongly uncoordinated to strongly coordinated.
4.1.1 Coupling coordination of vegetable industry
The coupling coordination degrees between the specialized production level of vegetables and the quality of FECC logistics in different regions of Xinjiang were calculated by formulas (6) and (7), and sorted in descending order (Table 5). The coupling coordination degree of each region in each year was evaluated against the scale in Figure 3.
As shown in Table 5, Urumqi is the only moderately coordinated region in terms of the coupling coordination of specialized production level of vegetables and the quality of FECC logistics; Changji and Bayangol are slightly coordinated; Kashgar, Karamay, Ili, Tacheng, Aksu, Hami, and Turpan are slightly uncoordinated; Bortala, Hotan, Kizilsu, and Altay are strongly uncoordinated. The different levels of coupling coordination reflect the regional difference in the development of specialized production of vegetables and FECC logistics.
Currently, only a few regions, such as Urumqi, Changji, and Bayangol, are in coordinated states. Urumqi is moderately coordinated, while the latter two regions are slightly coordinated. Meanwhile, most regions, namely, Kashgar, Karamay, and Bortala, are in uncoordinated states.
About 64% of all uncoordinated regions belong to the slightly uncoordinated level. Among them, Kashgar, Karamay and Ili are gradually approaching the slightly coordinated state. There are fewer strongly uncoordinated regions concerning the specialized production of vegetables than those concerning the specialized production of fruits. Among the strongly uncoordinated regions, Bortala and Hotan are improving in coupling coordination level.
Over the time, the coupling coordination of specialized production level of vegetables and the quality of FECC logistics is increasing in all regions of Xinjiang, except Altay.
Table 5. Coupling coordination degrees between the specialized production level of vegetables and the quality of FECC logistics in different regions of Xinjiang
|
Regions |
2012 |
2013 |
2014 |
2015 |
2016 |
Coupling coordination level |
|
Urumqi |
0.703 |
0.701 |
0.706 |
0.704 |
0.704 |
Moderately coordinated |
|
Changji |
0.528 |
0.500 |
0.519 |
0.520 |
0.534 |
Slightly coordinated |
|
Bayangol |
0.388 |
0.385 |
0.389 |
0.392 |
0.407 |
|
|
Kashgar |
0.359 |
0.370 |
0.374 |
0.388 |
0.404 |
Slightly uncoordinated |
|
Karamay |
0.358 |
0.376 |
0.376 |
0.336 |
0.392 |
|
|
Ili |
0.376 |
0.379 |
0.366 |
0.381 |
0.390 |
|
|
Tacheng |
0.336 |
0.333 |
0.335 |
0.344 |
0.355 |
|
|
Aksu |
0.315 |
0.302 |
0.280 |
0.298 |
0.315 |
|
|
Hami |
0.249 |
0.249 |
0.258 |
0.256 |
0.291 |
|
|
Turpan |
0.242 |
0.231 |
0.220 |
0.231 |
0.242 |
|
|
Bortala |
0.147 |
0.171 |
0.217 |
0.221 |
0.201 |
Strongly uncoordinated |
|
Hotan |
0.141 |
0.112 |
0.138 |
0.185 |
0.198 |
|
|
Kizilsu |
0.046 |
0.055 |
0.049 |
0.063 |
0.063 |
|
|
Altay |
0.056 |
0.050 |
0.055 |
0.048 |
0.044 |
Figure 3. Coupling coordination between the level of F&V specialized production and the quality of FECC logistics
Table 6. Coupling coordination degrees between the specialized production level of fruits and the quality of FECC logistics in different regions of Xinjiang
|
Regions |
2012 |
2013 |
2014 |
2015 |
2016 |
Coupling coordination level |
|
Kashgar |
0.423 |
0.433 |
0.417 |
0.413 |
0.429 |
Slightly coordinated |
|
Turpan |
0.376 |
0.373 |
0.400 |
0.403 |
0.422 |
|
|
Aksu |
0.411 |
0.408 |
0.389 |
0.394 |
0.418 |
|
|
Ili |
0.365 |
0.361 |
0.358 |
0.354 |
0.354 |
Slightly uncoordinated |
|
Chang ji |
0.337 |
0.313 |
0.320 |
0.324 |
0.326 |
|
|
Bayangol |
0.315 |
0.320 |
0.330 |
0.303 |
0.316 |
|
|
Hami |
0.309 |
0.325 |
0.322 |
0.309 |
0.313 |
|
|
Urumqi |
0.293 |
0.279 |
0.251 |
0.256 |
0.273 |
|
|
Hotan |
0.181 |
0.149 |
0.205 |
0.250 |
0.261 |
|
|
Karamay |
0.150 |
0.167 |
0.165 |
0.163 |
0.175 |
Strongly uncoordinated |
|
Tacheng |
0.141 |
0.157 |
0.051 |
0.093 |
0.127 |
|
|
Bortala |
0.078 |
0.079 |
0.113 |
0.113 |
0.125 |
|
|
Altay |
0.128 |
0.125 |
0.125 |
0.121 |
0.118 |
|
|
Kizilsu |
0.156 |
0.137 |
0.129 |
0.082 |
0.097 |
4.1.2 Coupling coordination of fruit industry
The coupling coordination degrees between the specialized production level of fruits and the quality of FECC logistics in different regions of Xinjiang were calculated, and sorted in descending order (Table 6). The coupling coordination degree of each region in each year was also evaluated against the scale in Figure 3.
As shown in Table 6, Aksu, Kashgar, and Turpan are slightly coordinated in terms of the coupling coordination of specialized production level of vegetables and the quality of FECC logistics; Ili, Changji, Bayangol, Hami, Urumqi, and Hotan are slightly uncoordinated; Tacheng, Bortala, Altay, Kizilsu, and Karamay are strongly uncoordinated. Overall, 21% of all regions in Xinjiang are slightly coordinated, 43% are slightly uncoordinated, and 36% are strongly uncoordinated.
The slightly coordinated regions have always achieved the highest coupling coordination degrees. This means the specialized production of vegetables has entered the state of stable coordinated development with FECC logistics, with prominent interactions between the two factors.
The slightly uncoordinated regions have relatively low coupling coordination degrees. Hotan is the only slightly uncoordinated region, whose coupling coordination degree rises steadily. The coupling coordination degrees of the other slightly uncoordinated regions are still fluctuating. With the elapse of time, the coupling coordination levels are rather unstable. The changes in Bayangol and Hami are relatively small, indicating that the specialized production of fruits and FECC logistics in the two regions are slightly affected by uncertain factors.
The strongly uncoordinated regions lag far behind the slightly coordinated regions in coupling coordination degree, owing to their weaknesses in resources, geopolitics, social economy, and infrastructure that suit specialized production of fruits and FECC logistics. It is difficult for the two factors to realize coordinated development in a short time, despite the measures taken by the government.
4.2 Causes of coupling differences between vegetable industry and fruit industry
The above analysis shows that the dynamic coupling coordination between the level of specialized production of fruits and FECC logistics is not as high as that between the level of specialized production of vegetables and FECC logistics. The main reasons are as follows:
First, there are differences between fruit industry and vegetable industry in the spatial pattern of specialized production levels. For specialized production of fruits, the superior regions concentrate in less-developed counties in the south and east; these countries have vast stretches of open ground. For specialized production of vegetables, the superior regions center on Urumqi, Changji and other important cities. Hence, vegetable industry has stronger logistics supports than fruit industry.
Second, there are differences between fruit industry and vegetable industry in planting conditions, planting techniques, and the completeness of agricultural facilities. In vegetable industry, agricultural facilities like polytunnels, solar greenhouses, and multi-span greenhouses are widely adopted, such that vegetables can be planted even if the geographical environment is unfavorable. By contrast, such facilities are not widely applied in the fruit industry, which greatly limits the plan table varieties.
Third, there are differences between fruit industry and vegetable industry in industry development and consumer demand. As basic food sources for humans, vegetables provide necessary vitamins, dietary fiber, and minerals. The traditional diet in China has a high demand for fresh foods like vegetables. That is, the stable supply of vegetables is a matter of people’s livelihood. By contrast, the distribution channels of fruits are more market-oriented and diverse. High-quality fruits are often sold as high-end products for a small group of consumers, creating a certain amount of added value. The difference in product value results in disparity between vegetables and fruits in the elasticity of supply and demand.
4.3 Causes of spatial coupling differences
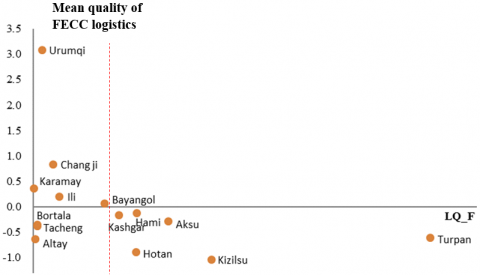
The mean LQ_F, mean LQ_V, and mean quality of FECC logistics in each region of Xinjiang were prepared into two scatterplots (Figure 4). Each scatterplot was split into four quadrants by the LQ axis and the critical line of LQ=1.
Then, the causes of spatial coupling differences were analyzed by comparing the left subgraph with Table 5, and the right subgraph with Table 6. The coupling coordination levels of regions in the four quadrants are summarized in Table 7 below.
It can be seen that the F&V specialized production and FECC logistics can achieve coupling and coordinated development (slightly, moderately or strongly coordinated), only if both factors are on high levels; the development will be uncoordinated, if the F&V specialized production is near the critical line or the FECC logistics is of poor quality.
In the first quadrant (high specialization and good logistics), the mean score of FECC logistics is positive, and the LQ_V or FQ_V is greater than 1. The regions in this quadrant have achieved a certain scale in the specialized production of vegetables or fruits. The FECC logistics in these regions is of high quality, under the positive spillover effects of social economy, political geography, infrastructure, and population density. The advanced FECC logistics manages to radiate the surroundings and link up adjacent regions.
In the second quadrant (low specialization and good logistics), the mean score of FECC logistics is positive, and the LQ_V or FQ_V is smaller than 1. The regions in this quadrant are not good at specialized production of vegetables or fruits, under constraints of environment, agricultural location, and planting conditions. The lack of specialization does not match the advanced FECC logistics, resulting in uncoordinated development.
In the third quadrant (low specialization and poor logistics), the mean score of FECC logistics is negative, and the LQ_V or FQ_V is smaller than 1. The regions in this quadrant are neither good at specialized production of vegetables or fruits, nor advanced in FECC logistics. Hence, the two factors cannot develop coordinately, leading to strong incoordination. It is possible for slightly uncoordinated regions to gradually improve their coupling coordination level. Under unchangeable constraints like resource endowment, the strongly uncoordinated regions (e.g. Altay) are not suitable produce vegetables or fruits, and should develop other special APs. The geography, social economy, or population in such regions cannot effectively drive the growth of FECC logistics.
In the third quadrant (high specialization and poor logistics), the mean score of FECC logistics is negative, and the LQ_V or FQ_V is greater than 1. Many fruit producing regions fall in this quadrant, and differ in the level of dynamic coupling coordination. Some of them are slightly coordinated, some are slightly uncoordinated, and some are strongly uncoordinated. This means poor FECC logistics does not necessarily bring incoordination, but regions with poor FECC logistics could achieve slight coordination at the most. In this quadrant, the multiple superior regions of specialized production of fruits have relatively low coupling coordination, owing to the insufficient services of the FECC logistics. There are immense difficulties in building FECC logistics infrastructure, because these regions cluster in remote villages of southern Xinjiang. The logistics capacity is far smaller than the actual demand for fruits. For instance, Turpan and Kizilsu, both have advantages in specialized production of fruits, are faced with strong incoordination arising from poor FECC logistics.
In summary, the spatial coupling coordination between F&V specialized production and FECC logistics is relatively low in Xinjiang. In many regions, the two factors restrict the development of each other, failing to achieve mutual progress or coordinated development. To improve the dynamic coupling coordination, different strategies should be adopted for vegetable industry and fruit industry. For vegetable industry, there is ample room for growth in specialization level; more regions should be encouraged to develop agricultural facilities, paving the way for specialized, scale production. For fruit industry, superior producing regions are highly concentrated. Each region has its unique strength in specialized production, yet lacks supports from FECC logistics. The causes of incoordination or slight coordination should be identified based on the quadrant of each region, before putting forward effective countermeasures.
Figure 4. Scatterplots of LQ_F, LQ_V and quality of FECC logistics in each region of Xinjiang
Table 7. Distribution of coupling coordination levels in each quadrant (Unit: each)
|
Quadrants |
Slightly coordinated |
Slightly uncoordinated |
Strongly uncoordinated |
Causes of incoordination |
|||
|
Left subgraph |
Right subgraph |
Left subgraph |
Right subgraph |
Left subgraph |
Right subgraph |
||
|
First quadrant |
3 |
|
|
|
|
|
— |
|
Second quadrant |
|
|
2 |
3 |
|
1 |
Low level of specialized production |
|
Third quadrant |
|
|
4 |
|
4 |
3 |
Low level of specialized production Low quality of FECC logistics |
|
Fourth quadrant |
|
3 |
1 |
2 |
|
1 |
Low quality of FECC logistics |
This paper measures the level of F&V specialized production and the quality of FECC logistics, and extends the coupling degree model into a coupling coordination model. On this basis, the authors empirically analyzed the coupling coordination between the specialized production level of vegetables and the quality of FECC logistics, and that between the specialized production level of fruits and the quality of FECC logistics.
Through the analysis, the incoordination or slight coordination between the two factors were attributable to the level of specialized production and the quality of FECC logistics. Incoordination may occur in regions good at F&V specialized production (e.g. Turpan and Hami), due to the insufficient support from FECC logistics. Incoordination may occur in regions with advanced FECC logistics (e.g. Urumqi), as they are not superior producing regions of F&V. Strong incoordination may occur in regions with weaknesses in F&V specialized production and FECC logistics (e.g. Altay).
Currently, the mismatch between the level of specialized production and the quality of FECC logistics hinders the regional economy in Xinjiang, and goes against the dynamic coupling and coordinated development between the two factors. Therefore, the following strategies were designed to create a long-term mechanism for coupling and coordinated growth between F&V specialized production and FECC logistics in Xinjiang:
First, fully understand the spatial coupling between the two factors.
There are interactions and mutual impacts between F&V specialized production and FECC logistics. F&V specialized production not only affects the quality of FECC logistics, but also supports FECC logistics materially and financially. In return, FECC logistics promotes the benefits of the former through mechanisms like capital flow, spatial spillover, and service improvement. Understanding the spatial coupling between the two factors helps to guarantee the first-mile delivery of F&V products.
Second, recognize the importance of the two factors.
Out of the 84 counties in Xinjiang, only 36.2% are relatively good at F&V specialized production, and only 23.7% have relatively complete FECC logistics system. The unoptimistic situation has its root in the poor awareness of F&V specialized production and FECC logistics among ordinary farmers. To solve the problem, the government should step up the publicity of the two factors, making them more acceptable by farmers. Once the farmers recognize the importance of the two factors, it is possible to improve the level of specialized production and the quality of FECC logistics, and enhance the popularity and competitiveness of Xinjiang’s F&V.
Third, innovate the development models of the two factors.
There are two bottlenecks in the development of F&V specialized production and FECC logistics in Xinjiang. On the one hand, the specialized F&V producers are too scattered and small to satisfy the huge market demand. On the other hand, the weak FECC logistics system restricts the growth of F&V industries. To resolve the bottlenecks, relatively large producers should be encouraged to expand the production and upgrade facilities, so that small producers could follow suit. Meanwhile, the whole logistics process of F&V products should be streamlined, advanced techniques should be introduced to keep products fresh, and the logistics services should be tracked and supervised in the long term.
Fourth, strengthen the infrastructure of FECC logistics.
Xinjiang has invested heavily in the infrastructure of FECC logistics. However, the irrational layout of the infrastructure, coupled with relatively low product turnover, resource utilization, and product circulation, drags down the overall quality of logistics services. To make the services satisfactory, it is imperative to rationalize the site selection, functions, management, and operation of the infrastructure of FECC logistics. For example, the refrigeration houses should be arranged in proper places, and refrigerated trucks should be scheduled as per the real-time supply and demand.
Fifth, build a complete cold-chain logistics system for F&V.
Xinjiang should develop a largescale and standard agglomeration of F&V industries. To this end, the production resources and logistics channels must be effectively integrated by setting up a complete cold-chain logistics system for F&V. The producers, logistics providers and distributors of F&V should be organized into an organic whole. The government should standardize the terms, symbols, and codes of F&V products, and regulate the environment, techniques, and management of F&V logistics. Finally, relevant laws, regulations and industry standards should be developed, leaving no loopholes.
This work was supported by National Natural Science Foundation of China (Grant No.: 71562033), Postgraduate Research Innovation Project of Xinjiang Agricultural University (Grant No.: XJAUGRI2017-031), and Science and Technology Planning Project of Xinjiang Uygur Autonomous Region (Grant No.: 2018D07020). The authors would like to thank the anonymous reviewers for their valuable comments.
[1] Francois, P. (1950). Economic space: theory and application. The Quarterly Journal of Economics, 64(1): 89-104. https://doi.org/10.2307/1881960
[2] Wang, C., Meng, Q. (2020). Research on the Sustainable Synergetic Development of Chinese Urban Economies in the Context of a Study of Industrial Agglomeration. Sustainability, 12(3): 1122. https://doi.org/10.3390/su12031122
[3] González-Val, R., Marcén, M. (2019). Agglomeration economies in small cities and business: The impact of the great recession in Aragón (Spain). Sustainability, 11(14): 3770. https://doi.org/10.3390/su11143770
[4] Hsiao, Y.H., Chen, M.C., Lu, K.Y., Chin, C.L. (2018). Last-mile distribution planning for fruit-and-vegetable cold chains. The International Journal of Logistics Management, 3: 56-63. https://doi.org/10.1108/IJLM-01-2017-0002
[5] Wang, S., Tao, F., Shi, Y. (2018). Optimization of location–routing problem for cold chain logistics considering carbon footprint. International Journal of Environmental Research and Public Health, 15(1): 86. https://doi.org/10.3390/ijerph15010086
[6] Ülgen, V.S., Björklund, M., Simm, N., Forslund, H. (2019). Inter-organizational supply chain interaction for sustainability: A systematic literature review. Sustainability, 11(19): 5488. https://doi.org/10.3390/su11195488
[7] Liu, J., Zhang, X., Li, Z., Zhang, X., Jemric, T., Wang, X. (2019). Quality monitoring and analysis of Xinjiang ‘Korla’ fragrant pear in cold chain logistics and home storage with multi-sensor technology. Applied Sciences, 9(18): 3895. https://doi.org/10.3390/app9183895
[8] Hu, X., Yang, H., Yang, J., Zhang, Z. (2019). Spatial Correlation Network of Format in the Central Districts of a Megacity: The Case of Shanghai. Sustainability, 11(19): 5191. https://doi.org/10.3390/su11195191
[9] Liu, J., Zhou, J., Liu, F., Yue, X., Kong, Y., Wang, X. (2019). Interaction Analysis and Sustainable Development Strategy between Port and City: The Case of Liaoning. Sustainability, 11(19): 5366. https://doi.org/10.3390/su11195366
[10] Zhao, Y., Wang, S. (2015). The relationship between urbanization, economic growth and energy consumption in China: an econometric perspective analysis. Sustainability, 7(5): 5609-5627. https://doi.org/10.3390/su7055609
[11] Wang, S., Ma, H., Zhao, Y. (2014). Exploring the relationship between urbanization and the eco-environment-A case study of Beijing-Tianjin-Hebei region. Ecological Indicators, 45: 171-183. https://doi.org/10.1016/j.ecolind.2014.04.006
[12] Han, H., Li, H., Zhang, K. (2019). Spatial-temporal coupling analysis of the coordination between urbanization and water ecosystem in the Yangtze River Economic Belt. International journal of environmental research and public health, 16(19): 3757. https://doi.org/10.3390/ijerph16193757
[13] Cui, X., Fang, C., Liu, H., Liu, X. (2019). Assessing sustainability of urbanization by a coordinated development index for an Urbanization-Resources-Environment complex system: A case study of Jing-Jin-Ji region, China. Ecological Indicators, 96: 383-391. https://doi.org/10.1016/j.ecolind.2018.09.009
[14] Yazdani, M., Chatterjee, P., Zavadskas, E.K., Zolfani, S. H. (2017). Integrated QFD-MCDM framework for green supplier selection. Journal of Cleaner Production, 142: 3728-3740. https://doi.org/10.1016/j.jclepro.2016.10.095
[15] Renko, S., Vignali, C., Ozimek, I., Żakowska-Biemans, S. (2011). Determinants of Polish consumers' food choices and their implication for the national food industry. British Food Journal, 113: 125-145. https://doi.org/10.1108/00070701111097394
[16] Manikas, I., Terry, L.A. (2009). A case study assessment of the operational performance of a multiple fresh produce distribution centre in the UK. British Food Journal, 111: 333-359. https://doi.org/10.1108/00070700910957276
[17] Zhang, J., Cao, W., Park, M. (2019). Reliability analysis and optimization of cold chain distribution system for fresh agricultural products. Sustainability, 11(13): 3618. https://doi.org/10.3390/su11133618
[18] Cen, Y., Zhang, P., Yan, Y., Jing, W., Zhang, Y., Li, Y., Yang, D., Liu, X., Geng, W., Rong, T. (2019). Spatial and temporal agglomeration characteristics and coupling relationship of urban built-up land and economic hinterland-A case study of the lower yellow river, China. Sustainability, 11(19): 5218. https://doi.org/10.3390/su11195218
[19] Ma, L., Long, H.L., Zhang, Y.N., Tu, S.S., Ge, D.Z. (2018). Spatio-temporal coupling relationship between agricultural labor changes and agricultural economic development at county level in China and its implications for rural revitalization. Acta Geographica Sinica, 73: 2364-2377. https://doi.org/10.11821/dlxb201812007
[20] Bal, E. (2013). Postharvest application of chitosan and low temperature storage affect respiration rate and quality of plum fruits. Journal of Agricultural Science & Technology, 15: 1219-1230.
[21] Brosnan, T., Sun, D.W. (2001). Precooling techniques and applications for horticultural products a review. International Journal of Refrigeration, 24: 154-170. https://doi.org/10.1016/s0140-7007(00)00017-7
[22] Defryn, C., Vanovermeire, C., Sörensen, K. (2016). Gain sharing in horizontal logistic co-operation: A case study in the fresh fruit and vegetables sector. Sustainable Logistics and Supply Chains, 75-89. https://doi.org/10.1007/978-3-319-17419-8_4
[23] Hariga, M., As'ad, R., Shamayleh, A. (2017). Integrated economic and environmental models for a multi stage cold supply chain under carbon tax regulation. Journal of Cleaner Production, 166: 1357-1371. https://doi.org/10.1016/j.jclepro.2017.08.105
[24] Vrat, P., Gupta, R., Bhatnagar, A., Pathak, D.K., Fulzele, V. (2018). Literature review analytics (LRA) on sustainable cold-chain for perishable food products: research trends and future directions. Opsearch, 55(3-4): 601-627. https://doi.org/10.1007/s12597-018-0338-9
[25] Jiang, Y.M., Wang, S.Y., Ma, X.L. (2017). Research on cold-chain logistics system of agricultural products based on carbon optimization. Science and Technology Management Research, 37(18): 221-227. https://doi.org/10.3969/j.issn.1000-7695.2017.18.035