Qingwei Wang | Qiang Yan* | Mei Song | Baojun Hou | Songtao Zhang
© 2020 IIETA. This article is published by IIETA and is licensed under the CC BY 4.0 license (http://creativecommons.org/licenses/by/4.0/).
OPEN ACCESS
The US has successfully explored and developed shale gas resources, making shale gas a research hotspot. This paper firstly compares the shale gas research in the US and China, pointing out China should develop a new method for prospective survey on shale gas, rather than copy the American method for shale gas exploration and development. Taking the coal-bearing blocks in Junggar Basin as the objects, this paper explores how to classify organic matters, recover the organic matter abundance, and estimate resources in prospective survey areas with weak research foundation and severely weathered outcrop samples. The main findings are as follows: (1) The weathering has an impact on the identification of kerogen type; the type of kerogen should be determined by multiple standards; among the various methods, the maceral method and carbon isotope method are less disturbed by weathering effect. (2) Most of the kerogens of mudstones/shales in Xishanyao Formation, Junggar Basin belong to type II, and only a few belong to type I. The kerogen types are favorable for shale gas generation. (3) The weathering recovery coefficient of the samples in the Junggar Basin was determined, referring to that in regions with similar strata and climate. Besides, the authors also calculated the adsorbed and free gas volumes of East and South Junggar Coalfields. The research results provide a guide for prospective surveys on shale gas in areas with weak research foundation and difficulty in obtaining fresh, low-cost shale samples.
shale gas, kerogen, organic matter types, recovery
The shale gas industry has a history of almost 200 years. In 1821, shale gas was discovered in the Appalachian Basin in upstate New York [1]. The concept of shale gas was coined by Curtis (2002) from the Colorado School of Mines [2]. In recent years, the “shale gas revolution” was set off in North America, triggering a boom of shale gas extraction across the globe [3].
China has abundant reserves of shale gas. According to American scholars and U.S. Energy Information Administration (EIA), the technically recoverable amount of shale gas in China is estimated as 36 trillion m3. Meanwhile, Chinese scholars put the estimate at 25 trillion m3 [4-7].
However, there is no unified standard for identifying the exact reserves of shale gas in China, due to the weak foundation of shale gas resource prediction in the country [8, 9]. It is no easy task to quantify shale gas reserves. The shale gas reserves in the US were proved through decades of explorations, based on the production experience of around 60,000 wells in nine industrial development zones of shale gas [4].
China did not explore or develop shale gas until less than 10 years ago, and has only made breakthroughs in a few places in the southwest, namely, Qianjiang, Chongqing and Lianyuan, Hunan. So far, China has only drilled 100-plus shale gas wells and developed a few shale gases fields. As a result, there is a severe lack of necessary data, especially downhole data, and an extremely limited amount of parameters (e.g. controllable reserves per well).
In China, the shale gas resources are estimated by simple analogy. The estimation results are obviously unreliable [8, 10-12]. The former Ministry of Land and Resources pointed out in China Shale Gas Resources Survey Report (2014) that “China has a great potential of shale gas resources, but the enrichment rule is not clear. Recoverable resources have not yet been truly implemented.” [13]
In the light of the above, it is not suitable for China to evaluate its shale gas reserves by the strategy in North America: drill wells all over the field and estimate the reserves controlled by each well. Taking the coal-bearing blocks of the Junggar Basin for example, this paper explores how to classify organic matters and estimate resources in prospective survey areas with weak research foundation and severely weathered outcrop samples.
The Junggar Basin is a continental intraplate basin developed from the Late Carboniferous to Quaternary period [14]. There are various types of fault structures in the basin [15], including the imbricate thrust structure on the northwest margin, imbricate thrust and en echelon structures on the northeast margin, normal thrust nappe structure on the southeast margin, and reverse thrust nappe structure on the southwest margin. The areas in the basin are characterized by NW trending uplifts and depressions, along with normal and reverse faults. Overall, the geological conditions are more complex on the margin than within the basin.
The Junggar Basin is a median-massif composite superimposed basin, with a double-layered basement [13, 16]. In the late Variscian movement, uplifts and depressions appeared alternatively at the basement of the basin. The basement could be divided into multiple blocks in the west-east direction and multiple belts in the north-south direction. After the Indosinian movement, the scattered depressions gathered together into a unified large basin with aa orderly sedimentary environment.
The paleo-structure, geography, climate and botany are very favorable for coal formation. Under these conditions, a coal-bearing formation was formed in early-middle Jurassic period. The Jurassic system is a set of lacustrine facies coal-bearing sediments, which is widely and thickly distributed in the Junggar Basin. The Jurassic basin was rich in coal seams and carbonaceous mudstones, thanks to the development of the river-swamp facies and flooding facies in the surroundings. Meanwhile, multiple sets of effective shale gas source rocks were developed in the coal-bearing formation [17, 18].
The center of the basin mainly contains shallow lacustrine deposits, with dark mudstones reaching the cumulative thickness of 600-700m. The source rocks are mainly developed in the Middle and Lower Jurassic Badaowan Formation, Sangonghe Formation and Xishanyao Formation. However, the studies on the coal-bearing stratum mainly focus on the coal itself, failing to explore the mudtones/shales in the formation [17-19].
3.1 Effects of weathering on kerogen and organic matter classification standard
Organic matter types can reflect the environmental features of mudstone/shale sedimentary basins in a comprehensive manner [20, 21]. The type of organic matter in source rocks reflects the difficulty of gas generation, and has great significance in the prospective survey on shale gas resources.
Based on the abundance of hydrogen, Chinese scholars have classified organic matters into five types: sapropelic (types I1 and I2), transitional (type II) and humic (types Ⅲ1 and Ⅲ2). The organic matter types are generally derived from the pyrolysis parameters of rocks, as well as the elementary composition, stable carbon isotopes, and macerals of kerogen [22].
Nevertheless, the above derivation methods have some common defects. The elementary composition in kerogen may vary slightly with the weathering intensity [23]. Under the weathering of outcrop samples, the organic elements of kerogen in mudstones/shales will migrate, resulting in the loss of carbon (C) and hydrogen (H) and the enrichment of oxygen (O). Hence, the H/C ratio will decrease, the O/C ratio will increase, and the rock pyrolysis IH will decline, causing the degradation of kerogen type [23-25]. In addition, weathering has varied impacts on the evaluation parameters of organic matter types. Thus, it is unscientific to determine kerogen type by a single method.
Meng et al. [23] suggested that the O/H ratio is the most affected elemental change by weathering, followed in descending order by the rock pyrolysis IH, the mass fraction of macerals of kerogen, the peak-height ratios at 1,460 and 1,600cm-1 of infrared spectrum, the carbon isotope of kerogen, the mass fraction of gonane, and the H/C ratio. Based on the O/C and H/C ratios, Meng and Wei et al. discriminated the organic matter types of weathered samples, and drew the following conclusions: If the weathering effect is limited to 50m, the O/C and H/C ratios can be restored for plate identification of organic matter types; If the weathering effect surpasses 50m, the organic matter types cannot be identified based on the two ratios [24-27].
So far, there is little report on the mudstones/shales in the study area. Besides, our mudstone/shale samples were collected from or near the surface, and are severely weathered. Therefore, the organic matter types of kerogen can only be identified clearly based on multiple indices. In this paper, the organic matter types are evaluated by the carbon isotope δ13C of kerogen, the organic petrological microscopy (macerals of kerogen) and the elementary composition of kerogen. The evaluation standard was developed by Huang et al. for the organic matter types in argillaceous source rocks in general lacustrine sedimentary basins of China (see Table 1) [26, 28].
Table 1. Classification standard for organic matter types in lacustrine sedimentary basins
|
Type Parameter |
I1 |
I2 |
II |
III1 |
III2 |
|
H/C ratio |
>1.5 |
1.3~1.5 |
1.0~1.3 |
0.8~1.0 |
<0.8 |
|
O/C ratio |
<0.1 |
0.15~0.1 |
0.25~0.1 |
0.25~0.3 |
>0.3 |
|
δ13C (‰) |
|
<-28.0 |
-25~-28 |
-22.5~-25 |
>-22.5 |
|
Exinite (%) |
|
>70~90 |
70~50 |
<50~10 |
<10 |
|
Vitrinite (%) |
|
<10 |
10~20 |
>20~70 |
>70~90 |
|
Type index (TI) |
|
>80~100 |
80~40 |
<40~0 |
<0~-100 |
|
Rock pyrolysis IH (mg/g) |
>700 |
400~700 |
180~400 |
100~180 |
<100 |
3.2 Applicability and results of several methods
(1) Kerogen carbon isotope δ13C method
The kerogen carbon isotope δ13C is an effective index of organic matter types. This index reflects the biogenic composition of kerogen. It is closely correlated with organic source input and sedimentary environment, and not greatly affected by maturity or weathering intensity [24].
Table 2 shows the kerogen data of mudstones/shales in the coal-bearing blocks of the Junggar Basin derived by kerogen carbon isotope δ13C. It can be seen that most kerogens belong to types I and II, which are highly favorable for shale gas generation in geological evolution.
Table 2. Results of kerogen carbon isotope δ13C
|
Sample |
Formation |
Lithology |
δ13C±, ‰ |
Type |
|
ZGY1 |
J2x |
Greyish green mudstone |
-27.6 |
II |
|
ZGY2 |
J2x |
Greyish green mudstone |
-27.8 |
II |
|
ZGY3 |
J2x |
Greyish green silt-bearing mudstone |
-26.7 |
II |
|
ZGY4 |
J2x |
Yellowish green silt-bearing mudstone |
-25.9 |
II |
|
ZGY5 |
J2x |
Grayish black carbonaceous mudstone |
-32.1 |
I |
|
ZGY6 |
J2x |
Grayish black carbonaceous mudstone |
-30.2 |
I |
|
ZGY7 |
J2x |
Grayish black carbonaceous mudstone |
-29.6 |
I |
|
ZGY8 |
J2x |
Grayish black carbonaceous mudstone |
-29.8 |
I |
|
ZGX1 (core) |
J2x |
Grayish black carbonaceous mudstone |
-26.6 |
II |
|
ZGX2 (core) |
J2x |
Grayish black carbonaceous mudstone |
-27.4 |
II |
(2) Kerogen maceral method
Table 3 lists the results of kerogen maceral method for shales in the coal-bearing blocks of the Junggar Basin.
Table 3. Results of kerogen maceral method
|
Sample |
Formation |
Sapropelinite + exinite, % |
Vitrinite, % |
TI |
Type |
|
ZGY1 |
J2x |
78.90 |
19.90 |
63.69 |
Ⅱ |
|
ZGY2 |
J2x |
88.10 |
12.01 |
78.96 |
Ⅰ |
|
ZGY3 |
J2x |
97.18 |
2.90 |
95.05 |
Ⅰ |
|
ZGY4 |
J2x |
94.90 |
4.39 |
91.62 |
Ⅰ |
|
ZGY5 |
J2x |
97.69 |
2.61 |
95.78 |
Ⅰ |
|
ZGY6 |
J2x |
96.20 |
4.32 |
92.98 |
Ⅰ |
|
ZGY7 |
J2x |
91.20 |
9.79 |
83.77 |
Ⅰ |
|
ZGY8 |
J2x |
93.50 |
4.99 |
89.76 |
Ⅰ |
|
ZGX1 (core) |
J2x |
75.83 |
20.02 |
60.52 |
II |
|
ZGX2 (core) |
J2x |
77.88 |
18.99 |
63.36 |
II |
As shown in Tables 2 and 3, the samples ZGY2 and ZGY3 were both identified as type II kerogens by kerogen carbon isotope δ13C, but recognized as type I kerogens by kerogen macerals. The significant difference is attributable to the long-term weathering of the samples under the strong tectonic movements in the study area. The organic matters of the samples underwent intense secondary transformations, such as oxidation, leaching, and degradation. Under the microscope, organic matters occupied an extremely small portion of the whole-rock samples, while clay minerals occupied about 90%. The organic macerals were mostly mineral asphalt matrix of sapropelinite, and vitrinite. None of alginate, exinite and inertinite was observed. The kerogen macerals show a good organic matter type.
(3) Kerogen elementary composition method
Kerogen elementary composition is an effective index for determining kerogen type (organic matter type) [29]. This method was adopted to process the same samples. The results show that the H/C ratio of kerogen of Xishanyao Formation mudstone fell between 0.4 and 1.0; most of the organic matters in the mudstone belong to type III, and a few belong to type II2. The findings differ greatly from the results of kerogen carbon isotope δ13C method and kerogen maceral method.
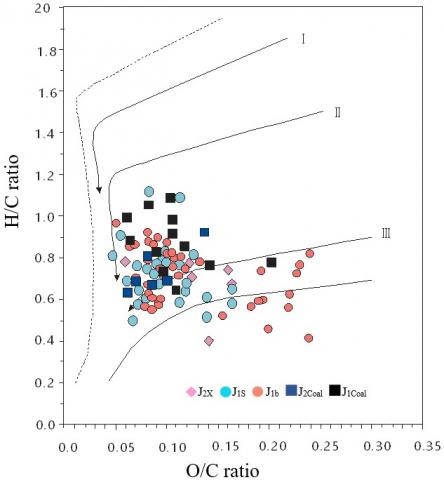
Meanwhile, kerogen elementary composition method had no difference in results on fresh core samples ZGX1 and ZGX2 from kerogen carbon isotope δ13C method and kerogen maceral method. The reason is that the samples are highly weathered, with a severe loss of C and H. The H/C ratios were basically below 0.2 and the O/C ratios fell in 0.02-0.26. The plate identification indicates that all source rock samples are type III kerogens and even “dead carbon” (Figure 1).
Figure 1. Three-terminal macerals of source rocks in Jurassic system of the Junggar Basin (Modified based on Wang’s research [19])
The kerogens were recovered by the recovery coefficient of previous studies (if the weathering effect is within 50m, the H/C ratio generally falls by 0.81% and the O/C ratio generally increases by 55.6%) [24]. The recovered kerogens still belong to type III. Therefore, the rock samples in the study area are severely weathered, and range of the weathering effect is more than 50m. The organic matter types cannot be effectively identified or classified by kerogen elementary composition method.
To sum up, it is not appropriate to classify organic matters by kerogen elemental composition in areas where the mudstone/shale samples are severely weathered. In contrast, the organic matter types can be better judged by the macerals and stable carbon isotopes of kerogen.
4.1 Recovery of organic matter abundance
The total organic carbon (TOC) content directly bears on shale gas enrichment. The content determines both the amount of shale gas generation, and the gas content of shales. Through experiments, Lu et al. [27] proved the good positive linear correlation between organic carbon content and methane adsorption capacity. The organic matters in the shales boast a strong absorbability. On the surface of kerogen, a high TOC means lots of gases are generated and adsorbed. However, the abundance of organic parent materials in rocks may change through geological history. For example, the organic matters will decrease under weathering, suppressing the abundance of organic matter. Considering the effect of weathering on the abundance of organic matter in outcrop samples, the weathering recovery coefficient is generally corrected for outcrop samples, with the aim to disclose the true organic chemical features of underground samples.
There is not yet a consensus on how much weathering affects the abundance of organic matters in rocks. As shown in Table 4, the analysis results on different regions differ greatly. Meng et al. [23] investigated the influence of weathering on the organic matter abundance in Jurassic source rock outcrops of Xining Basin, and put the weathering factor about the influence to 2.07-4.46. Zhang et al. [29] suggested that the organic carbon recovery coefficient was between 1.86 and 2.44 for the Upper Triassic-Middle Jurassic surface samples from the Qiangtang Basin on the Qinghai-Tibet Plateau, and between 1.25 and 1.45 for the Upper Permian and Lower Triassic surface samples from Daijiagou, Beibei District, Chongqing, the Upper Yangtze Plate.
Table 4. Comparison of pyrolysis and organic carbon parameters between surface and underground samples
|
Region |
Formation |
Lithology |
TOC (%) |
||
|
Underground |
Surface |
Underground/surface |
|||
|
Qinshui Basin |
C3s |
Coal |
73.04 (60) |
42.37 (4) |
1.74 |
|
Mudstone |
3.23 (20) |
1.45 (16) |
2.23 |
||
|
C3t |
Coal |
70.86 (63) |
34.79 (4) |
2.04 |
|
|
Mudstone |
2.69 (21) |
0.99 (16) |
2.72 |
||
|
Limestone |
0.97 (22) |
0.39 (33) |
2.49 |
||
|
C2b |
Mudstone |
1.64 (15) |
1.0 (9) |
1.64 |
|
|
O2 |
Limestone |
0.13 (17) |
0.08 (29) |
1.5 |
|
|
Daijiagou, Beibei, Chongqing |
T1j1 |
Limestone |
0.05 (1) |
0.04 (1) |
1.25 |
|
Region |
Formation |
Lithology |
TOC (%) |
||
|
Underground |
Surface |
Underground/surface |
|||
|
Xiaoxia Region, Xining Basin Eastern Qiangtang Basin |
J2 |
Oil shale |
20.61 (1) |
9.16 (1) |
2.25 |
|
J3s |
Limestone |
0.79 (11) |
0.58 (11) |
1.34 |
|
|
J2x |
Mudstone |
0.375 (3) |
0.21 (2) |
1.86 |
|
|
T3x |
Coal |
33.4 (4) |
24.7 (4) |
1.35 |
|
|
|
Mudstone |
3.27 (6) |
1.34 (6) |
2.44 |
|
|
J2b |
Mudstone |
0.18 (2) |
0.14 (2) |
1.29 |
|
|
|
Limestone |
0.2 (2) |
0.09 (2) |
2.17 |
|
|
Daijiagou, Beibei, Chongqing |
P2l |
Mudstone |
15.38 (1) |
10.64 (1) |
1.45 |
Table 5. Results of organic carbon analysis on rock samples from the Junggar Basin
|
Sample |
Place of origin |
Stratum |
Lithology |
TOC (%) |
Sample |
Place of origin |
Stratum |
Lithology |
TOC (%) |
|
ZGY1 |
East Junggar Coalfield |
J2x |
Dark carbonaceous mudstone |
17.2 |
ZGY6 |
East Junggar Coalfield |
J2x |
Dark carbonaceous mudstone |
16.9 |
|
ZGY2 |
East Junggar Coalfield |
J2x |
Dark carbonaceous mudstone |
24 |
ZGY7 |
Qitai County Coalmine |
J2x |
Dark mudstone |
3.74 |
|
ZGY3 |
East Junggar Coalfield |
J2x |
Dark mudstone |
2.81 |
ZGY8 |
South Junggar Coalfield |
J2x |
Dark mudstone |
1.24 |
|
ZGY4 |
East Junggar Coalfield |
J2x |
Dark carbonaceous mudstone |
44.3 |
ZGX1 |
East Junggar Coalfield |
J2x |
Dark mudstone |
4.95 |
|
ZGY5 |
East Junggar Coalfield |
J2x |
Dark mudstone |
0.224 |
ZGX2 |
East Junggar Coalfield |
J2x |
Dark mudstone |
5.01 |
The difference in analysis results is certainly affected by the regional variations in rock properties and surface geological effects. In the meantime, the difference reflects the complexity of weathering effect. The academia has not agreed upon the mechanism and evaluation method of weathering effect.
Therefore, this paper conducts an analogy on the weathering recovery coefficient of samples from the study area, and then recovers the TOC before weathering based on the measured TOC. The analogy shows that the study area is comparable to the eastern Qiangtang Basin, which has similar strata and climate. Based on the previous knowledge and the actual condition of the samples, the authors set the weathering recovery coefficient of the samples from the coal-bearing blocks of the Junggar Basin to 1.86. Under this setting, the corrected TOC of ZYG3 was 5.2, which is close to that of ZGX1 (4.95) and ZGX2 (5.01).
Based on the outcrop sampling results (Table 5) and the geochemical data from the Xinjiang Petroleum Administrative Bureau on the Junggar Basin, the mean abundance of organic carbons in mudstones/shales was 2.88% for the Xishanyao Formation, 1.32% for the Sangonghe Formation, and 1.73% for the Badaowan Formation (Table 6).
Table 6. The TOC of the Middle-Lower Jurassic source rocks in the Junggar Basin
|
Formation |
Stratum |
Type of mudstone/shale |
Range |
Mean (number of samples) |
Mean of coal series ($\frac{N \times \sum H_{N i} \times T O C_{N_{i}}}{H}$) |
|
Xishan Yao Formation
|
J2x |
Mudstone |
0.40~5.87 |
1.42 (84) |
1.55 (Corrected to 2.88) |
|
Carbonaceous mudstone |
6.23~37.40 |
18.19 (40) |
|||
|
Sangonghe Formation
|
J2s |
Mudstone |
0.40~3.51 |
1.04 (128) |
1.32 |
|
Carbonaceous mudstone |
6.03~35.69 |
17.04 (12) |
|||
|
Badaowan Formation |
J2b |
Mudstone |
0.42~5.86 |
1.68 (187) |
1.73 |
4.2 Calculation of shale gas resources
(1) Calculation of adsorbed gas volume in mudstones/shales
Considering the good positive linear correlation between organic carbon content and methane adsorption capacity, the calculation formula for the adsorbed gas volume in mudstones/shales of the study area can be fitted as y=0.205x+1.5285, in reference to the TOC data (Tables 5 and 6) and the isothermal adsorption data of East and South Junggar Coalfields (Tables 7 and 8). The formula was established for the adsorbed gas volume in Mesozoic Triassic mudstones/shales of the Ordos Basin: (y=0.16x+1.0346).
However, the gas content obtained by the isothermal adsorption method may be larger than the actual gas content. In view of the large pores in the samples, the calculation formula must be corrected before use. Considering the coal-bearing factors and porosity features of the ZGY4 sample from East Junggar Coalfield and the ZGY8 sample from South Junggar Coalfield, the correction coefficients for East Junggar Coalfield and South Junggar Coalfield were set to 0.8 and 0.6, respectively. After the correction, the calculation formula for the adsorbed gas volume in mudstones/shales of East Junggar Coalfield and South Junggar Coalfield were y=0.164x+1.2228 and y=0.123x+0.9171, respectively.
(2) Calculation of free gas volume in mudstones/shales
The free gas volume can be computed by:
Qfree=0.01φg•Sg/Z
where, φg is the porosity of shales, %; Sg is gas saturation, %; Z is the compressibility factor of natural gas.
Based on the Jurassic geological background of the Junggar Basin, this paper sets the mudstone/shale porosity to 1.4% for East Junggar Coalfield and to 8.4% for South Junggar Coalfield, referring to the shale gas geological parameters in other regions of China (e.g. the Ordos Basin) and the test data (Tables 5 and 6).
When it comes to gas saturation, different regions have varied gas saturations, due to their difference in evolution degree and amount of gas generation. The saturation also depends on pore size and pressure field. Excess gas can move freely, only if the pores are fully filled up. Under test conditions, the gas saturation of East Junggar Coalfield was set to the lowest level of 15%, and that of South Junggar Coalfield was set to 60%, according to the structural and thermal evolution of the entire basin.
In addition, the compressibility factor of natural gas was set to 1.
In this way, the free gas volumes of East Junggar Coalfield and South Junggar Coalfield were obtained as 0.84m3/t and 1.26m3/t, respectively.
Table 7. Basic data and results of isothermal adsorption test on ZGY4-sample from East Junggar Coalfield
|
Record number |
Pressure P (MPa) |
Adsorbed volume V (m3/t) |
P/V |
|
|
Measured |
Calculated |
|||
|
0 |
0.00 |
0.000 |
0.000 |
0.000 |
|
1 |
0.38 |
1.500 |
1.461 |
0.253 |
|
2 |
1.04 |
2.900 |
3.219 |
0.357 |
|
3 |
2.21 |
5.200 |
5.110 |
0.425 |
|
4 |
4.28 |
7.000 |
6.821 |
0.611 |
|
5 |
6.21 |
7.800 |
7.673 |
0.796 |
|
6 |
8.67 |
8.500 |
8.326 |
1.020 |
|
7 |
10.83 |
8.500 |
8.700 |
1.274 |
|
Test parameter |
Fitted parameter |
VL(m3/t) |
PL(MPa) |
|
|
Mudstone |
0.9982 |
10.61 |
2.38 |
|
|
Langmuir equation |
V=VL*P/(PL+P) |
|||
Table 8. Basic data and results of isothermal adsorption test on ZGY8-sample from South Junggar Coalfield
|
Record number |
Pressure P (MPa) |
Adsorbed volume V (m3/t) |
P/V |
|
|
Measured |
Calculated |
|||
|
0 |
0.00 |
0.000 |
0.000 |
0.000 |
|
1 |
0.36 |
0.190 |
0.201 |
1.888 |
|
2 |
1.08 |
0.480 |
0.484 |
2.243 |
|
3 |
2.25 |
0.780 |
0.764 |
2.884 |
|
4 |
4.33 |
1.020 |
1.026 |
4.248 |
|
5 |
6.24 |
1.180 |
1.157 |
5.286 |
|
6 |
8.68 |
1.290 |
1.259 |
6.729 |
|
7 |
10.87 |
1.290 |
1.320 |
8.430 |
|
Test parameter |
Fitted parameter |
VL(m3/t) |
PL(MPa) |
|
|
Mudstone |
0.9987 |
1.63 |
2.55 |
|
|
Langmuir equation |
V=VL*P/(PL+P) |
|||
(3) Calculation results
Based on the data of Junggar Basin (Tables 7 and 8) and the above parameter acquisition method, it is concluded that the shale gas resources was 0.089 and 0.734 trillion m3 in East Junggar Coalfield and South Junggar Coalfield, respectively.
The research of shale gas started late in China. There are very few data on the shale gas resources controlled per well. Therefore, the prospective surveys on shale gas resources cannot copy the methods in the US. It is necessary to develop a suitable method according to the situation in China. This paper explores how to classify organic matters, recover the organic matter abundance, and estimate resources in prospective survey areas with weak research foundation and severely weathered outcrop samples. The main conclusions are as follows:
(1) The analysis on experimental data shows that different methods disagree on the type of kerogen: The samples ZGY2 and ZGY3 were both identified as type II kerogens by kerogen carbon isotope δ13C, but recognized as type I kerogens by kerogen macerals. By contrast, the two samples were identified as type III kerogens by kerogen elemental composition. However, kerogen elementary composition method had no difference in results on fresh core samples ZGX1 and ZGX2 from kerogen carbon isotope δ13C method and kerogen maceral method. Thus, it is not appropriate to classify organic matters by kerogen elemental composition in areas where the mudstone/shale samples are severely weathered. In contrast, the organic matter types can be better judged by the macerals and stable carbon isotopes of kerogen.
(2) Drawing on the previous studies on the relationship between organic carbon abundance and weathering effect, the authors decided to identify the weathering recovery coefficient of the samples from the study area, and and then recover the TOC before weathering based on the measured TOC. The analogy shows that the study area is comparable to the eastern Qiangtang Basin, which has similar strata and climate. Based on the previous knowledge and the actual condition of the samples, the authors set the weathering recovery coefficient of the samples from the Junggar Basin to 1.86. Under this setting, the corrected TOC of ZYG3 is close to that of ZGX1 and ZGX2. Thus, the weathering recovery coefficient is relatively reasonable.
(3) Based on the test data on the ZGY4 sample from East Junggar Coalfield and the ZGY8 sample from South Junggar Coalfield, the calculation formulas for the adsorbed gas volume and free gas volume in the two coalfields were derived from the relationship between TOC and methane adsorption capacity. Then, it is initially estimated that the Junggar Basin (including East Junggar Coalfield and South Junggar Coalfield) has about 0.82 trillion m3 of shale gas resources.
This study is funded by the Comprehensive Research and Dynamic Tracking Evaluation of Energy Security (DD20160084); Comprehensive Evaluation and Information System Construction of National Special Coal Resources (DD20160189); Geology and Mineral Resources Survey Project: Ecological Configuration and Global Strategy of China Water Resources (DD20190652), The Influence of Water Resources and its Changing Law in Mining Activities in Coal Mining Areas in southern Qinshui, and Doctoral Talent Startup Fund(40559).
[1] Cheng, Y., Chen, G.D., Yin, Q., Xia, C.X., Wang, F.L., Zhou, L., Lu, P., Ma, L. (2017). Exploration and development status of shale gas in china and enlightenment from North American prosperous shale gas. Journal of Kunming Metallurgy College, 33(1): 16-24. https://doi.org/10.3969/j.issn.1009-0479.2017.01.004
[2] Curtis, J.B. (2002). Fractured shale-gas systems. AAPG bulletin, 86(11): 1921-1938. https://doi.org/10.1306/61EEDDBE-173E-11D7-8645000102C1865D
[3] Pollastro, R.M. (2007). Total petroleum system assessment of undiscovered resources in the giant Barnett Shale continuous (unconventional) gas accumulation, Fort Worth Basin, Texas. AAPG Bulletin, 91(4): 551-578. https://doi.org/10.1306/06200606007
[4] He, T., Lu, S., Li, W., Tan, Z., Zhang, X. (2018). Effect of salinity on source rock formation and its control on the oil content in shales in the Hetaoyuan formation from the Biyang depression, Nanxiang basin, central China. Energy & Fuels, 32(6): 6698-6707. https://doi.org/10.1021/acs.energyfuels.8b01075
[5] Handbook, F.C. (2004). US Department of Energy, Office of Fossil Energy, National Energy Technology Laboratory. Morgantown, USA.
[6] David, G., Lombardi, T.E., Martin, J.P. (2004). Fractured shale gas potential in New York. Northeastern Geology and Environmental Sciences, 26(1/2): 57-78.
[7] Zhao, H., Chen, H., Lu, S., Lu, M. (2018). Exploitation technology and prospect of shale gas in China. Frontiers in Earth Science, 8(7): 1215-1223. https://doi.org/10.12677/ag.2018.87132
[8] Kuuskraa, V. (2011). World shale gas resources: an initial assessment of 14 regions outside the United States. United States. Energy Information Administration, US Department of Energy.
[9] Xu, K., Zheng, D., Lin, S. (2019). Discussion of countermeasures for promotion of China’s oil and gas exploration and development. Oil Forum, 38(6): 6-14. https://doi.org/10.3969/j.issn.1002-302x.2019.06.002
[10] Zhang, K., Jiao, Y. (2108). Deepening the exploration-development integration to provide effective reserves for development. China Petroleum Exploration, 23(2): 76-82. https://doi.org/10.3969/j.issn.1672-7703.2018.02.010
[11] Zhou, L., Yu, C., Hua, S., Sun, C., Wang, N. (2017). Evaluation method and application of shale oil resources in Kong 2 Member of Cangdong Depression. Special Oil and Gas Reservoir, 24(6): 1-6. https://doi.org/10.3969/j.iasn.1006-6535.2017.06.001
[12] Wang, X., Mou, C., Wang, Q., Zou, K., Liang, W., Ge, X., Chen, X. (2018). Recomment on the study of lithofacies palaeogeography as a guide for geology survey of shale gas. Acta Sedimentologica Sinca, 36(2): 215-231. https://doi.org/10.14027/j.issn.1000-0550.2018.001
[13] China Geological Survey of the Ministry of Land and Resources. (2015). China Shale Gas Resources Survey Report (2014).
[14] Ma, Y.S., Cai, X.Y., Zhao, P.R. (2018). China’s shale gas exploration and development: Understanding and practice. Petroleum Exploration and Development, 45(4): 561-574. https://doi.org/10.11698/PED.2018.04.03
[15] Zhang, D.W. (2011). Main solution ways to speed up shale gas exploration and development in China. Natural Gas Industry, 31(5): 1-5. https://doi.org/10.3787/j.issn.1000-0976.2011.05.001
[16] Meng, C.P., Zhu, M.H., Yang, X.M., Yi, X.Q., Zhou, X. (2011). Division of Sedimentary Facies and Sequence Stratigraphy of Jurassic Sangonghe Formation in the Center of Junggar Basin. Journal of Oil and Gas Technology, 33(2): 27-31. https://doi.org/10.3969/j.issn.1000-9752.2011.02.006
[17] Tang, X.F., Wang, G., Zhang, Z. (2018). A study on uranium metallogenic model of Jurassic in Kamust Region, Junggar Basin. Geological Review, 64(3): 647-657. https://doi.org/10.16509/j.georeview.2018.03.010
[18] Zheng, M., Fan, X., He, W., Yang, T. (2019). Overlapping evolution of deep geological structure and hydrocarbon accumulation in Junggar Basin. Earth Science Frontiers, 26(1): 22-32. https://doi.org/10.13745/j.esf.sf.2019.1.2
[19] Sun, S.D., Chen, C., Du, J., Xu, S.F., Hu, Z.W., Wang, G.Q. (2016). Magnetic characteristics and tectonic implications of crust in Junggar Basin and its surroundings. Earth Science, 41(7): 1216-1224. https://doi.org/10.3799/dqkx.2016.099
[20] Chen, J.P., Wang, X.L., Deng, C.P., Liang, D.G., Zhang, Y.Q., Zhao, Z., Ni, Y.Y., Zhi, D.M., Yang, H.B. (2016). Geochemical features of source rocks and crude oil in the Junggar Basin, Northwest China. Acta Geologica Sinica, 90(1): 37-67. https://doi.org/10.3969/j.issn.0001-5717.2016.01.003
[21] Qian, Y., Wang, Z.D., Zhang, T., Tuo, J.C., Wang, X.F., Wang, Z.Y. (2017) Geochemical characteristic of Jurassic source rocks and natural gas in the eastern Jungar basin and exploration potential of low-mature gas. Acta Petrolei Sinica, 38(1): 44-54. https://doi.org/10.7623/syxb201701005
[22] Hu, W.Q., Li, Y.B., Chen, X., Ma, L.T., Liu, C., Huang, Y., Qiao, F., Wang, D., Liu, Z.Z. (2020) Origin and source of natural gas in the Upper Paleozoic in Linxing area, Ordos Basin. Natural Gas Geoscience, 31(1): 26-36. https://doi.org/10.11764/j.issn.1672-1926.2019.08.009
[23] Meng, Y.L., Xiao, L.H., Yang, J.S., Wang, J.G., Sun, Y.L. (1999). Influences of weathering on organic matter of outcrop and correcting methods in Xining Basin. Geochimica, 28(1): 42-50.
[24] Li, C., Wen, Z. G., Xu, Y. H., Du, Y. B., Diao, F., Zhang, L. (2011). Evaluation of Carboniferous source rocks in Qaidam Basin. Natural Gas Geoscience, 22(5): 854-859. https://doi.org/10.11764/j.issn.1672-1926.2011.05.854
[25] Wei, J.S., Lu, J.C., Wei, X.Y., Han, W., Jiang, T. (2012). The influence of intense weathering on the evaluation indexes of hydrocarbon source rocks: A case study of Carboniferous-Permian Strata of Ejin Banner and its neighboring areas. Geological Bulletin of China, 31(10): 1715-1723. https://doi.org/10.3969/j.issn.1671-2552.2012.10.016
[26] Huang, D.F., Xiong, C.W., Yang, J.J., Xu, Z.Q., Wang, K.R. (1999). gas source discrimination and natural gas genetic types of central gas field in E'erduosi Basin. Natural Gas Industry, 6(6): 1-5.
[27] Lu, X.C., Li, F.C., Watson, A.T. (1995). Adsorption measurements in Devonian shales. Fuel, 74(4): 599-603. https://doi.org/10.1016/0016-2361(95)98364-K
[28] Philp, R.P. (1985). Petroleum formation and occurrence. Eos, Transactions American Geophysical Union, 66(37): 643-644. https://doi.org/10.1029/EO066i037p00643
[29] Zhang, J.F., Wang, D.L., Qin, J.Z., Liu, B.Q. (2001). Study on the weathering correction of surface outcrop samples from the Qinghai-Tibet plateau. Petroleum Geology & Experiment, 23(3): 297-300. https://doi.org/10.11781/sysydz200103297