Lin Zhu | Heng Zhang | Heping Liao* | Ronghua Peng
© 2020 IIETA. This article is published by IIETA and is licensed under the CC BY 4.0 license (http://creativecommons.org/licenses/by/4.0/).
OPEN ACCESS
This paper aims to verify whether the natural resource system of Chongqing, China could support the current development mode of social economy, and measure the current and future sustainability. The 3D Ecological Footprint (EF) model and the ecological sustainability index (ESI) were adopted for the measurement and time series analysis of the per-capita ecological footprint, per-capita ecological capacity, per-capita ecological deficit and depth of ecological footprint (EFdepth) of Chongqing from 2000 to 2017, i.e. the 18 years since the implementation of Western Development Strategy. The authors also calculated the ESI and fitted its future trend. The results show that: From 2000 to 2017, the per-capita ecological footprint, per-capita ecological deficit and EFdepth increased continuously, the ecological capacity remained stable; From 2000 to 2016, the ESI exhibited a declining trend, indicating that the sustainability deteriorated from weakly sustainable to weakly unsustainable; After 2016, the ESI trend changed to gradual increase, and is expected to become weakly sustainable again in 2026, moderately sustainable in 2032, and strongly sustainable in 2037. If the strongly sustainable level is reached early, Chongqing also needs to speed up reforms to optimize the industrial structure, land use, lifestyle and ecologic policies.
3D ecological footprint (EF) model, ecological sustainability index (ESI), sustainability, ecological capacity, ecological footprint
Located in the upper reaches of the Yangtze River, Chongqing is the gateway to the western region of China. In recent years, the city has achieved rapid socioeconomic development. However, the rapid growth consumes a lot of resources and increases the pressure on the eco-environment. Therefore, sustainability has become critical to the development of Chongqing [1], and to the implementation of China’s Western Development Strategy. Within this context, it is highly necessary to evaluate the sustainability of Chongqing, i.e. judge whether the natural resources could support the current mode of socioeconomic development.
The Ecological Footprint (EF) model was proposed in the 1990s by William Rees and Mathis Wackernagel. The EF model is one of the most popular tools to measure the sustainability of a region. The tool was introduced to China in 1998. So far, scholars at home and abroad have conducted multi-dimensional research with the EF model. The EF model has been widely applied to measure the sustainability of eco-environment in cities [2-6], provinces [7] and countries [8-14], and also used to evaluate the current state of food consumption [15, 16], water resources [17] and tourism [18, 19].
Recent years has seen the emergence of improved versions of the EF model, such as Emergy EF model [20]. In 2009, Niccolucci et al. added size and depth to the EF model, turning the 2D tool into a 3D model. Compared with the traditional EF model, the 3D EF model can measure the ecological footprint of the study area comprehensively from both time and space, and evaluate the regional sustainability in an accurate manner.
Nevertheless, the 3D EF model has not been frequently applied to measure regional sustainability. Only a few scholars have examined the ecological sustainability of Chongqing based on the 3D EF model. But most of them only studied the Three Georges Reservoir region or a few districts/countries, failing to evaluate the overall situation of Chongqing. What is worse, these scholars only investigated the situation within a short time span, making it inaccurate to predict the future trend of the ecological footprint.
Therefore, this paper attempts to comprehensively evaluate the sustainability of Chongqing from 2000 (the year that the city started to implement the Western Development Strategy) to 2017, with the aid of the 3D EF model. Two hypotheses were adopted for our research: (1) The ecological sustainability of a country/region is measured by the per-capita resource consumption and world average land yield, i.e. the global ecological yield is 1; (2) Different types of land are mutually exclusive in space.
The remainder of this paper is organized as follows: Section 2 explains the research methods; Section 3 introduces the study area and data sources; Section 4 computes and analyzes the per-capita ecological footprint (ef), per-capita ecological capacity (ec), per-capita ecological deficit (ed), and the depth of ecological footprint (EFdepth), and then evaluates and predicts the sustainability of Chongqing by fitting the trend of ecological sustainability index (ESI); Section 5 puts forward the conclusions.
To fully evaluate the sustainability of Chongqing, the 3D EF model was adopted to analyze the changes of capital stock and capital flow, and the ESI was selected to illustrate the dynamic changes of sustainability of Chongqing.
2.1 3D EF model
2.1.1 Traditional EF model
In this paper, the EF model proposed by William Rees in 1992 is referred to as the traditional EF model. Ecological footprint means the area of biologically productive land required to maintain resource consumption and waste absorption, under given population and economic conditions [21]. The EF model evaluates the sustainability of a region by comparing the area of biologically productive land with the land area in the calculation of ecological capacity.
The biologically productive land refers to the area of ecological production capacity. There are six types of biologically productive land: farmland, forest land, pasture land, water body, fossil fuel land and construction land.
The ecological capacity means the ability of the environment to support and balance the survival of humans and that of other living beings [22]. If ecological footprint is greater than ecological capacity, the region has an ecological deficit, and its development mode is not sustainable; otherwise, the region has an ecological remainder, and its development mode is sustainability.
The ecological deficit (ED) and ecological remainder (ER) can be respectively calculated by:
$E D=|E F-E C|(E F>E C)$ (1)
$E R=|E F-E C|(E C \geq E F)$ (2)
Figure 1. Diagram of the traditional EF model
As shown in Figure 1, the traditional EF model can be illustrated with two concentric circles. If ecological footprint (outer circle) is greater than ecological capacity (inner circle), the ecological deficit can be described as the size of the ring; if ecological capacity (outer circle) is equal to greater than ecological footprint (inner circle), the ecological remainder can be described as the size of the ring.
For comparison, the ecological footprint and ecological capacity of each type of biologically productive land was multiplied by the equilibrium index (EI) and yield index (YI):
$E F=\sum_{i=1}^{5} S_{i} \times y_{i} \times e_{i}=\sum_{i=1}^{5} C_{i} \div y_{i} \times e_{i}$ (3)
$E C=\sum_{i=1}^{5} A_{i} \times y_{i} \times e_{i}$ (4)
where, EF is the total ecological footprint of a region (hm2); Si is the total area of biologically productive land (hm2); Ci is the total amount of resources; Yi is the average world yield of a type of resources; EC is the regional ecological capacity (hm2); A is the area of a type of biologically productive land (hm2).
Table 1 lists the EI and YI values of each type of biologically productive land [23].
Table 1. The EI and YI values of each type of biologically productive land
|
Biologically productive land |
Equilibrium index (EI) |
Yield index (YI) |
|
Farmland |
2.8 |
2 |
|
Forest land |
1.1 |
1.5 |
|
Pasture land |
0.5 |
6.97 |
|
Water body |
0.2 |
15 |
|
Fossil fuel land |
1.1 |
0 |
|
Construction land |
2.8 |
2.35 |
2.1.2 3D EF model
With the traditional EF model, it is difficult to measure the sustainability of a region from the angle of time span, for the model cannot clearly differentiate between capital stock and capital flow [24]. To distinguish between the two factors, Niccolucci et al. [25, 26] introduced two new concepts to the traditional EF model: the size of ecological footprint (EFsize) and the depth of ecological footprint (EFdepth). The EFsize has spatial attribute, while EFdepth has time attribute. In this way, Niccolucci et al. [25, 26] established the 3D EF model.
Figure 2. Diagram of 3D EF model
As shown in Figure 2, the 3D EF model can be understood as a cylinder [27], where the bottom is EFsize, the height is EFdepth, and the volume is the total ecological footprint (3DEF):
$E F_{\text {dept} h}=1+E D \div E C(E F>E C)$ (5)
$E F_{\text {depth}}=1(E C \geq E F)$ (6)
$3 D E F=E F_{\text {depth}} \times E F_{\text {size }}$ (7)
The EFsize represents the total area of biologically productive land. The EFsize value equals the smaller between ecological footprint and ecological capacity [27]. The EFsize does not cause any pressure on eco-environment, for capital flow has no impact on capital stock.
The EFdepth reflects how many years it takes for the existing biologically productive land to provide the resources needed for the development and make up for the excessive consumption of resources in the current year.
If there is an ecological remainder (EC≥EF), the resource consumption is smaller than the resource yield in the current year. In other words, the current area of biologically productive land provides enough resources for development, without exerting any pressure on eco-environment. This is in line with the spirit of sustainable development. In this case, the EFdepth equals 1.
If there is an ecological deficit (EF>EC), the resource consumption in the current year cannot be satisfied by the resource yield in the current year. In this case, the eco-environment suffers from an additional pressure, which is obviously unsustainable.
Therefore, the EFdepth value must be greater or equal to 1. The EFdepth value is positively correlated with the ecological deficit, and negatively with sustainability.
The total ecological footprint equals the product between EFsize and EFdepth [28].
2.2 The ESI
Both are relative numbers, ecological footprint and ecological capacity cannot demonstrate the exact degree of land use in a region. Therefore, this paper introduces the ESI to evaluate the sustainability of Chongqing. The ESI measures how much the sustainable ecological supply (ecological capacity) of a region can satisfy the ecological demand (ecological footprint) of locals [29]:
$E S I=\frac{e c}{e c+e f}$ (8)
where, ec and ef are per-capita ecological capacity and per-capita ecological footprint, respectively. The ESI value falls in the interval of [0, 1]. The closer the value is to 1, the greater the sustainability; the closer the value is to 0, the smaller the sustainability. If ESI=0.5, per-capita ecological capacity equals per-capita ecological footprint, i.e. the demand is offset by supply. Hence, ESI=0.5 is the threshold between sustainable and unsustainable development.
Based on the deviation of the ESI from 0.5, the sustainability can be divided into 6 levels (Table 2): strongly sustainable, moderately sustainable, weakly sustainable, weakly unsustainable, moderately unsustainable, and strongly unsustainable [30].
Table 2. The levels of sustainability
|
Symbols |
ESI |
Levels |
|
1 |
ESI≥0.8 |
Strongly sustainable |
|
2 |
0.65≤ESI<0.8 |
Moderately sustainable |
|
3 |
0.5≤ESI<0.65 |
Weakly sustainable |
|
4 |
0.35≤ESI<0.5 |
Weakly unsustainable |
|
5 |
0.2≤ESI<0.35 |
Moderately unsustainable |
|
6 |
ESI<0.2 |
Strongly unsustainable |
3.1 Study area
Chongqing (N: 28°10’-32°13’; E: 105°11’-110°11’) lies in the hinterland of southwestern China. Covering an area of 8.24×10⁴km2, the city has a monsoon-influenced humid subtropical climate, featuring warm winter, hot summer and a long frost-free period. The annual average temperature is 16-18℃. In general, the terrain is high in the southeast and northeast, and low in the middle and west. From the south to the north, the Yangtze River valley gradually drops in altitude. On average, Chongqing has an altitude of 400m and a relatively fragile eco-environment.
From 2000 to 2017, the population of Chongqing soared from 30.101 to 33.982million, the proportion of urban population rose from 35.6% to 64.1%, the proportions of primary, secondary and tertiary industries in the GDP increased from 15.9%, 42.4% and 41.7% to 6.9%, 44.1% and 49.0%, respectively, the total energy consumption grew from 24.108 to 84.893 million tons of standard coal, and the Engel coefficient dropped from 42.2% to 33.2%. The trends of these indices show that the livelihood of Chongqing residents has greatly improved over the 17 years.
Being the largest economic center in the middle and upper reaches of the Yangtze River, Chongqing has received strong supports from the Chinese government, in a bid to fully implement the Western Development Strategy. In recent years, Chongqing has maintained medium to high rate of economic growth. However, the economic boom comes at the cost of fast resource consumption, which exerts a tremendous pressure on the eco-environment. With the rising population and shrinking farmland, the limited resources can no longer satisfy the growing demand, posing a serious threat to sustainable development.
3.2 Data sources
The research data were collected from Chongqing Statistical Yearbooks, Chongqing Ecology and Environment Statements, www.forestry.gov.cn, and relevant literature.
The EI and YI values (Table 1) were calculated by Wackernagel et al., [31, 32] and used to compute the ecological footprint and ecological capacity.
Two types of resources are consumed by local residents: biological resources and energy resources. The former resources are produced by farmland, forest land, pasture land and water body; the latter resources are produced by fossil fuel land and construction land.
Table 3. List of resources being consumed
|
Resources |
Type of lands |
|
|
Biological resources |
Rice, beans, oil plants, fiber plants, sugarcane, tobacco leaf, vegetables |
Farmland |
|
Tea, fruits |
Forest land |
|
|
Meat products, Eggs |
Pasture land |
|
|
Aquatic products |
Water body |
|
|
Energy resources |
Raw coal, coke, diesel |
Fossil fuel land |
|
Electricity |
Construction land |
|
As shown in Table 3, biological resources include rice, beans, oil plants, tea, aquatic products, etc., while energy resources include raw coal, coke, diesel and electricity.
The area of biologically productive land for each type of resource was converted, using the world average yield provided by Wackernagel et al. [33] in 1999.
4.1 Analysis based on 3D EF model
(1) Trend of per-capita ecological footprint (ef)
As shown in Figure 3, the per-capita ecological footprint of Chongqing exhibited an upward trend in 2000-2017.
Figure 3. The per-capita ecological footprint and per-capita capacity of Chongqing
From 2000 to 2003, the per-capita ecological footprint remained at about 0.50hm2/cap. In this period, Chongqing just started to implement the Western Development Strategy and the 10th Five-Year Plan. The economic restructuring had not yet brought obvious changes in the consumption market.
From 2003 to 2010, the per-capita ecological footprint increased rapidly from 0.51hm2/cap in 2003 to 1.02hm2/cap in 2010. In the meantime, the per-capita ecological footprint of farmland rose from 0.26hm2/cap to 0.3hm2/cap, while that of fossil fuel climbed up from 0.26hm2/cap to 0.64hm2/cap. These trends are attributable to the following factors: With the development of social economy and industry, Chongqing residents lived a better life and pursued even higher quality of life. The demand was surging for nutrients (e.g. protein and vitamin) and other material products (e.g. houses, home appliances and entertainment facilities). In terms of biological resources, the residents were in need of more beans and aquatic products; in terms of energy resources, the residents wanted more electricity and fossil fuel.
From 2010 to 2017, the per-capita ecological deficit stabilized around 1.00hm2/cap, owing to two reasons: On the one hand, Chongqing had nearly completed the adjustment of industrial structure, creating an industrial system with a high proportion of the tertiary industry. In 2017, the financial industry achieved 9.3% of added value. The reasonable industrial structure slowed down the growing consumption of energy-intensive resources, such as raw coal and diesel. On the other hand, the residents had consumed a lot of biological resources (e.g. beans and aquatic products), and the area of biologically productive land like construction land and fossil fuel land became stable. This situation curbed the increase of per-capita ecological footprint, keeping it at a relatively stable level.
(2) Trend of per-capita ecological capacity (ec)
From 2000 to 2017 (Figure 3), the per-capita ecological capacity of Chongqing had a slight decline, and fluctuated between 0.7hm2/cap and 0.8hm2/cap. This means the productivity of the natural system and the situation of eco-environment were generally stable. The stability of per-capita ecological capacity is promoted by the limited dynamicity of land use.
From 2000 to 2008, the per-capita ecological capacity decreased from 0.75hm2/cap to 0.69hm2/cap. The decrease is the outcome of urbanization, industrial restructuring, population growth and drought. (1) Statistics show that, from 2000 to 2008, the construction land in Chongqing expanded by 81,804 hm2, and the urbanization rate jumped from less than 40% to 48.3%. The urbanization weakened the ecological capacity, because the construction land has a smaller ecological capacity than other types of land in the same size. (2) Being the key node of Western Development Strategy, Chongqing paid high attentions to infrastructure (e.g. highways and houses), and highlighted the dominance of industry in economy. From 2000 to 2008, the proportion of industrial output to the GDP rose from 32% to 40%. The changes in industrial structure also led to the decline in ecological capacity. (3) In the said period, the population of Chongqing swelled by 1.66 million, dragging down ecological capacity. (4) In 2006, Chongqing was struck by a severe drought, which brought an economic loss of 9 billion yuan and serious damages to eco-environment.
From 2008 to 2015, the per-capita ecological capacity increased to 0.79hm2/cap. Since 2008, Chongqing had made great efforts to improve the eco-environment. The efforts had basically paid off, as evidenced by the 11% growth in forest coverage. In 2013, Chongqing was recognized as a National Model City for Environmental Protection and a National Garden City. In addition, the city subsidized the energy-saving products purchased by its residents, which greatly promotes the per-capita ecological capacity.
From 2015 to 2017, the per-capita ecological capacity fell from 0.79hm2/cap to 0.73hm2/cap. In these two years, the construction land in Chongqing expanded by 20,345hm2. The progress of urbanization occupied many farmland and forest land. In 2016 alone, a total of 7,044hm2 of farmland was transferred or acquired for other uses. With a monsoon-influenced humid subtropical climate, Chongqing is prone to natural disasters like landslides and debris flows, because the mountains and hills are exposed to heavy rains in summer. In the end of 2016, the soil erosion area was as large as 30,100km2. The mountainous terrain, coupled with extreme weather and soil erosion, gnawed away the area of forest land and water body, reducing the ecological capacity.
(3) Trend of per-capita ecological deficit (ed)
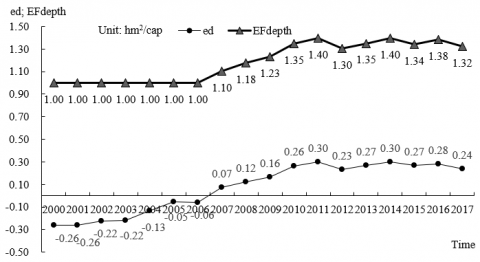
As shown in Figure 4, the per-capita ecological deficit in Chongqing showed an upward trend in 2000-2017.
Figure 4. The per-capita ecological deficit and EFdepth in Chongqing
From 2000 to 2006, the per-capita ecological capacity was greater than the per-capita ecological footprint, precluding the presence of per-capita ecological deficit. The reason is that the per-capita ecological footprint always stayed below the per-capita ecological capacity, i.e. the capital flow satisfied the total resource demand in each year.
From 2007 to 2017, the per-capita ecological deficit emerged and went up year by year. The emergence is the result of the fact that per-capita ecological capacity was overtaken by per-capita ecological footprint. Meanwhile, the continuous growth is the fruit of rapid economic development and the demand for better life.
(4) Trend of EFdepth
As shown in Figure 4, the EFdepth had a similar trend as per-capital ecological footprint (stabilization, growth and stabilization), because the ecological capacity stayed in a stable state. From 2000 to 2006, the EFdepth value remained at 1, living up to the requirements of sustainable development; From 2007 to 2011, the EFdepth value increased from 1 to 1.4, exerting greater pressure on the eco-environment; From 2012 to 2017, the EFdepth value lingered between 1.3 and 1.4. Overall, it takes 1.3-1.4 years to restore the resource consumed each year between 2007 and 2017. There is still a gap between the development mode of Chongqing and sustainable development.
4.2 Trend of the ESI
As shown in Table 4, the ESI of Chongqing continued to decrease from 2000 to 2017. According to the levels of sustainability, the sustainability of Chongqing weakened through the study period, falling from weakly sustainable to weakly unsustainable. From 2000 to 2006, the ESI fell between 0.52 and 0.60, i.e. the development mode is weakly sustainable. From 2007 to 2017, the ESI fell between 0.43 and 0.48, i.e. the development mode is weakly unsustainable. Despite the stable total ecological capacity, the total ecological footprint of Chongqing was on the rise, due to industrial development, the expansion of construction land, and the growth in energy-intensive industries. The latter two factors were induced by the growing demand for better life.
Table 4. The ESI of Chongqing
|
Number |
Year |
ESI |
|
1 |
2000 |
0.60 |
|
2 |
2001 |
0.61 |
|
3 |
2002 |
0.59 |
|
4 |
2003 |
0.59 |
|
5 |
2004 |
0.55 |
|
6 |
2005 |
0.52 |
|
7 |
2006 |
0.52 |
|
8 |
2007 |
0.48 |
|
9 |
2008 |
0.46 |
|
10 |
2009 |
0.45 |
|
11 |
2010 |
0.43 |
|
12 |
2011 |
0.42 |
|
13 |
2012 |
0.43 |
|
14 |
2013 |
0.43 |
|
15 |
2014 |
0.42 |
|
16 |
2015 |
0.43 |
|
17 |
2016 |
0.42 |
|
18 |
2017 |
0.43 |
In the long term, Chongqing will develop in an economical and intensive mode, which lives up to the requirements of sustainable development (Figure 5).
The variation in the ESI from 2000 to 2017 was fitted to obtain the trend of the ESI (Figure 5). The linear relationship between the independent variable (ESI) and the dependent variable (time series value) can be expressed as y = 0.0009x2 -0.03x + 0.6639, x=1, 2,…n, where 1, 2,…n are 2000, 2001, …, 2000+(n-1) years, respectively.
A: Entering the weakly sustainable development state in 2026; B: Entering a state of moderately sustainable development in 2032; C: Entering a state of strongly sustainable development in 2037.
Figure 5. ESI fitting and prediction
As shown in Figure 5, the analysis shows that the minimum ESI appeared in 2016. The sustainability decline in 2016 has two reasons: (1) The population peaked at 33.9211 million in 2016, reducing the per-capita ecological capacity. (2) In 2016, Chongqing stimulated domestic demand by promoting online promotions, coupling business and tourism and enhancing festival marketing. In that year, the total retail sales of consumer goods increased by 14%, and the total number of civilian vehicles grew to 5.6750 million, up by 11.2% from the end of the previous year. The rising vehicle ownership pushed up the consumption of fossil fuel, increasing the per-capita ecological footprint.
The sustainability growth after 2016 is attributable to the following factors: (1) In 2017, Chongqing vigorously promoted tourism and technical innovation. The number of technology enterprises increased by 3,465. (2) The municipal government adopted multiple measures to improve the ecology: implement the river chief system, carry out five major environmental protection actions, and set up the environmental supervision system. These measures enhanced the ecological capacity, and thus the sustainability have increased in 2017.
Table 5. Trend of sustainability
|
Period |
ESI |
Level |
|
2000-2005 |
0.5≤ESI<0.65 |
Weakly sustainable |
|
2006-2025 |
0.35≤ESI<0.5 |
Weakly unsustainable |
|
2026-2031 |
0.5≤ESI<0.65 |
Weakly sustainable |
|
2032-2036 |
0.65≤ESI<0.8 |
Moderately sustainable |
|
2037- |
ESI≥0.8 |
Strongly sustainable |
Since the implementation of Western Development Strategy, Chongqing has witnessed an increase in per-capita ecological footprint and a slight decline in per-capita ecological capacity. There are three reasons for the growth in per-capita ecological footprint: (1) The rising number and scale of industries has led to an irrational energy consumption structure. A great proportion of biologically productive land was used for energy-intensive purposes, e.g. fossil fuel land and construction land. (2) The residents are asking for better quality of life: more nutritious meals, better infrastructure, and diverse entertainment facilities. (3) The spillover effect of population growth causes the ecological footprint to increase year by year. Meanwhile, the slight decrease in per-capita ecological capacity can be attributed to three factors: (1) Land urbanization contributes to the decline to a certain extent. (2) The constant growth of population brings more pressure to eco-environment. (3) Natural disasters like landslides and debris flows occur frequently, due to the mountainous terrain and rainy climate.
From 2000 to 2017, the sustainability of Chongqing deteriorated from weakly sustainable to weakly unsustainable, that is, the development mode gradually deviated from sustainable development. In general, the per-capita ecological footprint was increasing year by year, while the per-capita ecological capacity remained stable. Therefore, more resources were consumed than those being yielded each year. It takes more than 1 year to restore the resources consumed in each year. There are two implications of the sustainability change in 2000-2017. For one thing, since the implementation of Western Development Strategy, Chongqing had vigorously developed its economy, and created an industrial structure dominated by energy-intense industries. However, eco-environment was faced with a growing pressure, due to the lack of protective measures, the boom of population, the demand for better life, and the expansion of construction land. The sustainability of Chongqing was put at risk, calling for measures to lower ecological footprint and enhance ecological capacity. For another, the Western Development Strategy, despite not promoting the ecological capacity, did not cause great damage to the eco-environment.
In future, the sustainability of Chongqing will increase gradually. It is expected that the sustainability will become weakly sustainable again in 2026, moderately sustainable in 2032, and strongly sustainable in 2037. Currently, the sustainability of Chongqing is weakly unsustainable, with an ecological footprint greater than one. Nevertheless, Chongqing has never entered the moderately or strongly unstainable state in the 18-year-long study period. In recent years, the EFdepth has become relatively stable, and the development mode gradually approached the requirements of sustainable development. To improve sustainability, Chongqing should further reduce ecological footprint and enhance ecological capacity. In fact, the per-capita ecological footprint is already falling, and the ecological capacity is likely to grow, under the strong policy support from the government. For example, Chongqing has revised its regulations on environmental protection, strictly supervised protective actions, and formulated environmental quality standards according to local conditions. Besides, the development goal of high-speed growth has been replaced by high-quality growth, highlighting the importance of ecology and green development.
If the strongly sustainable level is reached early, Chongqing also needs to speed up reforms to optimize the industrial structure, land use, lifestyle and ecologic policies. The future research will further explore the paths to ecological sustainability and come up with more countermeasures, laying a solid basis for the government to realize sustainable development.
This paper is based on the Postdoctoral Research “Comparative study on the transformation and development of resource-exhausted cities in eastern and western China”. Project supported by the Fundamental Research Funds for the Central Universities of Ministry of Education of China (No. SWU1509447), Chongqing social science planning project (No.2019YBGL076), and National Training Program of Innovation and Entrepreneurship for Undergraduates (No.201810635076).
[1] Wang, C., Li, H.Y., He, Y.Z., Ma, X.S., Zhou, M.M. (2019). Sustainable development ability and its spatiotemporal differentiations of rural human settlements in Chongqing Municipality from 1997 to 2015. Progress in Geography, 38(4): 556-566. https://doi.org/10.18306/dlkxjz.2019.04.008
[2] Muñiz, I., Garcia-López, M.À. (2019). Urban form and spatial structure as determinants of the ecological footprint of commuting. Transportation Research Part D: Transport and Environment, 67: 334-350. https://doi.org/10.1016/j.trd.2018.08.006
[3] McBain, B., Lenzen, M., Albrecht, G., Wackernagel, M. (2018). Reducing the ecological footprint of urban cars. International Journal of Sustainable Transportation, 12(2): 117-127. https://doi.org/10.1080/15568318.2017.1336264
[4] Isman, M., Archambault, M., Racette, P., Konga, C.N., Llaque, R.M., Lin, D., Iha, K., Ouellet-Plamondon, C.M. (2018). Ecological Footprint assessment for targeting climate change mitigation in cities: A case study of 15 Canadian cities according to census metropolitan areas. Journal of Cleaner Production, 174: 1032-1043. https://doi.org/10.1016/j.jclepro.2017.10.189
[5] Baabou, W., Grunewald, N., Ouellet-Plamondon, C., Gressot, M., Galli, A. (2017). The Ecological Footprint of Mediterranean cities: Awareness creation and policy implications. Environmental Science & Policy, 69: 94-104. https://doi.org/10.1016/j.envsci.2016.12.013
[6] Świąder, M., Szewrański, S., Kazak, J. K., Van Hoof, J., Lin, D., Wackernagel, M., Alves, A. (2018). Application of ecological footprint accounting as a part of an integrated assessment of environmental carrying capacity: A case study of the footprint of food of a large city. Resources, 7(3): 52-69. https://doi.org/10.3390/resources7030052
[7] Xun, F.F., Hu, Y.C. (2018). Evaluation of ecological sustainability based on a revised three-dimensional ecological footprint model in Shandong Province, China. Science of The Total Environment, 649: 582-591. https://doi.org/10.1016/j.scitotenv.2018.08.116
[8] Charfeddine, L., Mrabet, Z. (2017). The impact of economic development and social-political factors on ecological footprint: A panel data analysis for 15 MENA countries. Renewable and Sustainable Energy Reviews, 76: 138-154. https://doi.org/10.1016/j.rser.2017.03.031
[9] Ulucak, R., Bilgili, F. (2018). A reinvestigation of EKC model by ecological footprint measurement for high, middle and low income countries. Journal of Cleaner Production, 188: 144-157.https://doi.org/10.1016/j.jclepro.2018.03.191
[10] Uddin, G.A., Salahuddin, M., Alam, K., Gow, J. (2017). Ecological footprint and real income: Panel data evidence from the 27 highest emitting countries. Ecological Indicators, 77: 166-175. https://doi.org/10.1016/j.ecolind.2017.01.003
[11] Harun, S.N., Hanafiah, M.M. (2018). Estimating the country-level water consumption footprint of selected crop production. Applied Ecology and Environmental Research, 16(5): 5381-5403. https://doi.org/10.15666/aeer/1605_53815403
[12] Solarin, S.A., Bello, M.O. (2018). Persistence of policy shocks to an environmental degradation index: The case of ecological footprint in 128 developed and developing countries. Ecological Indicators, 89: 35-44. https://doi.org/10.1016/j.ecolind.2018.01.064
[13] Szigeti, C., Toth, G., Szabo, D.R. (2017). Decoupling-shifts in ecological footprint intensity of nations in the last decade. Ecological Indicators, 72: 111-117. https://doi.org/10.1016/j.ecolind.2016.07.034
[14] Schierhorn, F., Meyfroidt, P., Kastner, T., Kuemmerle, T., Prishchepov, A.V., Müller, D. (2016). The dynamics of beef trade between Brazil and Russia and their environmental implications. Global Food Security, 11: 84-92. https://doi.org/10.1016/j.gfs.2016.08.001
[15] Galli, A., Iha, K., Halle, M., El Bilali, H., Grunewald, N., Eaton, D., Bottalico, F. (2017). Mediterranean countries' food consumption and sourcing patterns: an ecological footprint viewpoint. Science of the Total Environment, 578: 383-391. https://doi.org/10.1016/j.scitotenv.2016.10.191
[16] Hadjikakou, M. (2017). Trimming the excess: environmental impacts of discretionary food consumption in Australia. Ecological Economics, 131: 119-128. https://doi.org/10.1016/j.ecolecon.2016.08.006
[17] Zhao, G., Gao, C., Xie, R., Lai, M., Yang, L. (2019). Provincial water footprint in China and its critical path. Ecological Indicators, 105: 634-644. https://doi.org/10.1016/j.ecolind.2018.06.058
[18] Qureshi, M.I., Elashkar, E.E., Shoukry, A.M., Aamir, A., Mahmood, N.H.N., Rasli, A.M., Zaman, K. (2019). Measuring the ecological footprint of inbound and outbound tourists: Evidence from a panel of 35 countries. Clean Technologies and Environmental Policy, 21(10): 1949-1967. https://doi.org/10.1007/s10098-019-01720-1
[19] Ozturk, I., Al-Mulali, U., Saboori, B. (2016). Investigating the environmental Kuznets curve hypothesis: the role of tourism and ecological footprint. Environmental Science and Pollution Research, 23(2): 1916-1928. https://doi.org/10.1007/s11356-015-5447-x
[20] Viglia, S., Civitillo, D.F., Cacciapuoti, G., Ulgiati, S. (2018). Indicators of environmental loading and sustainability of urban systems. An emergy-based environmental footprint. Ecological indicators, 94: 82-99. https://doi.org/10.1016/j.ecolind.2017.03.060
[21] Wackernagel, M., Onisto, L., Bello, P. (1997). Ecological footprints of nations. commissioned by the earth council for the rio+ 5 forum. International Council for Local Environmental Initiatives Toronto, 10-21.
[22] Van Wanda, D., Irianto, A., Munaf, E., Alhadi, Z. (2019, August). The influence of infrastructure development and ecological carrying capacity on the economic impact of independent integrated city of Lunang Silaut. In IOP Conference Series: Earth and Environmental Science, 314(1): 012062. https://doi.org/10.1088/1755-1315/314/1/012062
[23] Wackernagel, M., Onisto, L., Bello, P., Linares, A.C., Falfán, I.S.L., Garcı́a, J.M., Guerrero, A.I.S., Guerrero, M.G.S. (1999). National natural capital accounting with the ecological footprint concept. Ecological economics, 29(3): 375-390. https://doi.org/10.1016/S0921-8009(98)90063-5
[24] Zhou, T., Wang, Y.P., Gong, J.Z., Wang, F., Feng, Y. (2015). Ecological footprint model modification and method improvement. Acta Ecologica Sinica, 35(14): 4592-4603. https://doi.org/10.5846/stxb201311182756
[25] Niccolucci, V., Bastianoni, S., Tiezzi, E.B.P., Wackernagel, M., Marchettini, N. (2009). How deep is the footprint? A 3D representation. Ecological Modelling, 220(20): 2819-2823. https://doi.org/10.1016/j.ecolmodel.2009.07.018
[26] Niccolucci, V., Galli, A., Reed, A., Neri, E., Wackernagel, M., Bastianoni, S. (2011). Towards a 3D national ecological footprint geography. Ecological modelling, 222(16): 2939-2944. https://doi.org/10.1016/j.ecolmodel.2011.04.020
[27] Fang, K. (2013). Ecological footprint depth and size: new indicators for a 3D model. Shengtai Xuebao/Acta Ecologica Sinica, 33(1): 267-274. https://doi.org/10.5846/stxb201111051670
[28] Yang, Y., Hu, D. (2018). Natural capital utilization based on a three-dimensional ecological footprint model: A case study in northern Shaanxi, China. Ecological Indicators, 87: 178-188. https://doi.org/10.1016/j.ecolind.2017.12.010
[29] Liu, Q., Lin, Z., Feng, N. (2007). A modified ecological footprint model and its application to the evaluation of cropland use in Jiangsu Province. Chinese Journal of Ecology, 26(10): 1685-1689. https://doi.org/10.4028/www.scientific.net/AMR.356-360.2349
[30] Cucchiella, F., D'Adamo, I., Gastaldi, M., Koh, S.L., Rosa, P. (2017). A comparison of environmental and energetic performance of European countries: A sustainability index. Renewable and Sustainable Energy Reviews, 78: 401-413. https://doi.org/10.1016/j.rser.2017.04.077
[31] Wackernagel, M., Monfreda, C., Schulz, N. B., Erb, K. H., Haberl, H., Krausmann, F. (2004). Calculating national and global ecological footprint time series: resolving conceptual challenges. Land use policy, 21(3): 271-278. https://doi.org/10.1016/j.landusepol.2003.10.006Get rights and content
[32] Xu, Z., Zhang, Z.Q., Cheng, G.D., Chen, D. (2003).Ecological footprint calculation and developmentcapacity analysis of China in 1999. Ying Yong Sheng TaiXue Bao, 14(2): 280-285.https://doi.org/10.13287/j.1001-9332.2003.0064
[33] Wackernagel, M., Lewan, L., Hansson, C.B. (1999)Evaluating the use of natural capital with the ecologicalfootprint applications in Sweden and Subregions.AMBIO, 28(7): 604-612.