Temitayo Mufutau Azeez*![]() | Humbulani Simon Phuluwa
| Humbulani Simon Phuluwa![]()
© 2025 The authors. This article is published by IIETA and is licensed under the CC BY 4.0 license (http://creativecommons.org/licenses/by/4.0/).
OPEN ACCESS
Aluminium alloys are widely used in various industries due to their excellent strength-to-weight ratio, corrosion resistance, and formability. However, their wear resistance and ductility can be limiting factors in certain applications. This study investigates the effects of reduction ratio and extrusion temperature on the wear rate and ductility of Al 6063 extrudates. A systematic experimental approach was employed, involving the extrusion of aluminium samples at varying reduction ratios (20%, 40%, and 60%) and temperatures (400℃, 450℃, and 500℃). Quadratic models were developed to predict extruded wear rate and ductility, revealing reduction ratio and temperature as significant factors (p<0.05). The results showed that increased reduction percentage led to decreased wear rate, while enhanced grain sizes were achieved with increased reduction ratio and temperature. This research provides valuable insights for optimizing extrusion parameters to improve the wear resistance and ductility of formed Al 6063, which can be applied in various industries, such as aerospace, automotive, and construction, where high-performance aluminium alloys are critical.
extrusion, wear rate, ductility, reduction ratio, temperature
Aluminium alloys, most especially 6063 grades, have gained popularity in many industrial applications owing to their distinguishing features such as lightweight, corrosion resistance, high strength, thermal and electrical conductivity. These features enable them to be suitable for transportation, aerospace, and construction applications [1]. It resembles the British aluminium alloy HE9 due to its similar properties in terms of strength and weldability [2]. One of the major practical techniques of producing and enhancing aluminium alloy qualities is extrusion, a procedure that entails the material being forced through die to produce complex shapes.
Extrusion is a method of manufacturing shapes from plastic or metallic materials by forcing them through a prefabricated series of dies. The extruded product takes the die shape [3]. The extrusion process is unique relative to other forming processes, such as forging and casting, due to its ability to produce longer shapes, such as tubes and beams, which are not realistic in forging and casting processes [4]. Extrusion also enables more accurate shape and size control of the product profile. This process conserves more materials compared to machining, which is also one of the forming processes [5]. The extrusion process is well-suited for aluminium alloys due to its low melting points, high ductility, and corrosion resistance [6]. The process enables the development of complex shapes, and it is cost-effective with high efficiency.
Aluminium extrusions have gained production popularity in many ways, examples of these are found in window frames manufacturing, aircraft components, and taking advantage of their thermal conductivity in the production of heat sinks used in electronic devices. Extrusion responses, otherwise known as process parameters like reduction ratio and temperature, are substantially enhanced by the mechanical features, performance, and micro-structural value of the extruded product [7]. Flow stress, microstructural texture, and ductility of the material have been influenced by the temperature [8]. The reduction ratio also enhanced strain hardening and fine texture development [9]. A thorough understanding of these parameters’ impacts on the extrudes is very important in optimizing the extrusion process and ensuring high-quality products. However, past research concentrated on individual temperature or reduction ratio effects without any details on their interactive effects [10]. This knowledge gap restricted the prediction and control ability of the mechanical properties and microstructure of the extrudes.
The two crucial properties that are used as a measure of extruded aluminium components' performance and lifespan are ductility and wear resistance [11]. Wear resistance is crucial for friction and abrasion applications like moving parts and surfaces [12]. Ductility is important in an application that requires deformation to be prevented so as to prevent failure [13].
To obtain superior mechanical qualities, the interactions between extrusion process parameters, particularly reduction ratio and temperature, are critical [14]. According to Laptev et al. [15], the temperature development is a bit greater in initial billet height at a given percentage area reduction, and the greater the percentage reduction in area, the higher the temperature rises during the extrusion process. This is because, when the amount of energy required to distort the material advances, it so increases the deformation work in addition to frictional work, particularly at the die land zone, which transforms into heat in the main deformation and die land zone [16]. Beyond a 90% area decrease, the dead zone temperature often rises considerably more than the die region temperature. This is attributable to the direct and greater contact area of this zone with the major deformation region, along with the substantial degree of heat flowing into and released in this zone during the transformation of the deformation work into heat [16]. Increasing the coefficient of friction causes an increase in extrusion temperature at the die land zone but no substantial increase in extrusion temperature at the dead zone. However, exceeding an extrusion speed of 4.23mm/s results in a higher dead region temperature rise than a steadier die land temperature increase. In general, increasing speed causes a temperature rise [16].
The excessive or insufficient reduction ratio and temperature effects are posing a threat to the extrusion process. Work piece may be damaged under excessive temperature, like hot tears, blisters, and incipient melting, especially at the temperature exceeds 550℃ [17]. Excessive reduction ratio can subject materials to overworking conditions that consequently result in fractures and cracks. In the reverse way, too low a reduction ratio and temperature can lead to under-pressing, resulting in inadequate mechanical properties or surface roughness defects. Based on previous studies, extruding materials under excessive temperature can hike the cost of extrusion up to 16% because of wasted energy and die wear [3].
Despite the extrusion parameter’s role on aluminium 6063 properties, there is an urgent need for a thorough review on the combined extrusion parameters, such as temperature and reduction ratio effects on its ductility and the wear rate. This research aims to bridge the gap between using combined experimental and numerical techniques in investigating temperature and reduction ratio effects on ductility and wear rate of extruded aluminium 6063.
Through the extrusion process and materials properties comprehensive analysis, this study seeks to present a significant insight into the sophisticated interactions between extrusion parameters, micro-structure and its performance. The research outcomes will contribute immensely to developing the optimized extrusion processes and enhanced materials properties, leading to improved efficiency and sustainability of industrial applications.
2.1 Materials selection
Aluminium 6063 grade used in this study was obtained from Nigeria Aluminium Extrusion Limited (NIGALEX), Apapa, Lagos, Nigeria. The chemical composition and mechanical properties of this material were verified to conform with the international standards of ASTM B221 and ISO 6361. This aluminium alloy was further characterized to determine its specific mechanical properties and to confirm its conformance with the required standard. High carbon steel (AISI 1020) selected for the die and punch development was purchased at a local market (Owode Onirin) in Lagos. The die was machined to a suitable size using a lathe and milling machine. Kleen Mould (molten glass), used as lubricant was obtained from Beta glass company Agbara Ogun State, Nigeria.
2.2 Experimental designs
The design of the experiments was carried out employing the Central Composite Design (CCD) technique, which is embedded in the Response Surface Methodology (RSM) phase, using Design Expert software. CCD is a statistical tool that enables quadratic interactions between input and output variables. Using this technique, the reduction ratio and temperature responses to wear rate and ductility were effectively evaluated while reducing the number of experiments. This method (CCD) helped in developing a response surface predictive equation, leading to significant interaction insight between the input and output variables.
This software was employed for the design of a number of experimental runs at different input factor combinations. The input factors’ values are presented in Table 1, while the details of the experimental iteration suggested by the software are presented in Table 2. In this table, -1, +1, and 0 indicate low, high, and midpoint value of the input, respectively. Low, midpoint, and high values of temperature are 400, 450, and 500°C, respectively, while those of reduction ratios are 20, 40, and 60%. A quadratic polynomial model of the type presented in Eq. (1) below was generated. The model was validated statistically and by conducting confirmatory experiments. Statistical validation entails the determination of the significance level by Analysis of variance (ANOVA) and model fitting through the correlation coefficient. Optimization of the process variables was carried out using the desirable approach of the RSM to determine the best combination of the two input variables (reduction ratio and temperature) that will optimize the outputs (wear rate and ductility).
B=${{\varphi }_{o}}+\partial \underset{b=1}{\overset{a}{\mathop \sum }}\,{{\varphi }_{b}}{{x}_{b}}+~\underset{b-1}{\overset{a}{\mathop \sum }}\,{{\varphi }_{bn}}~{{x}_{b}}{{x}_{n}}+~\underset{b=1}{\overset{a}{\mathop \sum }}\,{{\varphi }_{bb}}~x_{b}^{2}$+$~\partial $ (1)
where, B=dependent factor$~{{\varphi }_{o}}$=gross average,$~{{\varphi }_{b~}}$=linear effect input factors ${{x}_{b}}$; ${{\alpha }_{bn}}$=linear by linear interaction effect; ${{\alpha }_{bb}}$=quadratic effect of the input factor ${{x}_{b}}$+$\partial $=random error term.
Table 1. Experimental design variables
|
|
|
Level |
|||
|
Factors |
Code |
-1 |
+1 |
-alpha |
+alpha |
|
Temperature (℃) |
T |
400 |
500 |
379.29 |
520.71 |
|
Reduction ratio (%) |
R |
20 |
60 |
11.72 |
68.28 |
Table 2. Experimental range design model
|
S/N |
Coded Value |
Original Value |
||
|
|
T |
R |
Temperature (℃) |
Reduction Ratio (%) |
|
1 |
-1 |
-1 |
400 |
20 |
|
2 |
+1 |
-1 |
500 |
20 |
|
3 |
-1 |
+1 |
400 |
60 |
|
4 |
+1 |
+1 |
500 |
60 |
|
5 |
-α |
0 |
379.29 |
40 |
|
6 |
+α |
0 |
520.71 |
40 |
|
7 |
0 |
-α |
450 |
11.72 |
|
8 |
0 |
+α |
450 |
68.28 |
|
9 |
0 |
0 |
450 |
40 |
|
10 |
0 |
0 |
450 |
40 |
|
11 |
0 |
0 |
450 |
40 |
|
12 |
0 |
0 |
450 |
40 |
2.3 Experimental process
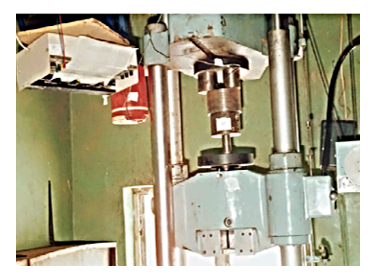
The effects of reduction ratio and billet temperature on the wear rate and ductility of the extruded Al 6063 were investigated experimentally. Three reduction ratios (20%, 40%, and 60%) and three billet temperatures (400℃, 450℃, and 500℃) were considered. Three dies with constant inlet diameter (60mm) and varying outlet diameters (48mm, 36mm, and 24mm) were designed and fabricated using a lathe machine (FERIV 0605) and milling machine (FERIV 0588). As-received Al 6063 samples (Figure 1 (a)) were characterized and machined to a billet diameter of 59mm (Figure 1 (b)) using a lathe machine (Figure 2). This billet size was selected to ensure proper fit into the die's inlet diameter. The billets were heated to the selected temperatures and lubricated with Kleen Mould, a graphite-based lubricant, to minimize friction and prevent overheating. The die walls were also lubricated with the same lubricant. The lubricated billets were then inserted into the dies, and the extrusion process was performed using a hydraulic press (Figure 3) with a set load of 7000 N and speed of 6mm/s.
(a)
(b)
Figure 1. Aluminium samples (a) as received (b) machining operation
Figure 2. Machined Al-6063 to billet sizes
Figure 3. Extrusion experimental set up
The wear rate of the extruded aluminium was measured using a pin-on-disk tribometer, with a normal load of 10 N and a sliding speed of 0.1m/s. The wear rate was calculated as the volume loss per unit sliding distance. The ductility of the formed product was measured using a universal testing machine, with a tensile load applied at a rate of 1mm/min. The ductility was calculated as the percentage elongation at break. The number of experimental runs was determined using Design Expert software, as presented in Table 2. After the extrusion process, the wear rate and ductility of the extruded samples were measured and analyzed to investigate the effects of reduction ratio and billet temperature on the mechanical properties of extruded Al 6063.
2.4 Wear testing
ASTM-G195, which makes provision for the materials' abrasion resistance procedure, was used in the determination of the extrude wear rate using a wear testing machine (model-kett H30/30S) presented in Figure 4 (a) [18]. The density of aluminium (ρ) used was 2.7×10³g/mm3, and the sliding distance (R) of the machine was set to 40mm. The extruded Aluminium was first weighed to determine the initial weight of the specimen (wi) as 60.24g using a beam balance, after which the specimen was fixed inside the wear testing machine’s socket. A load (L) of 2kg was applied. The machine was set to the speed (N) and time (t) of 1031 rpm and 5 minutes (300 seconds) respectively, as presented in Figure 4 (b), before the machine was switched on for wear to occur at the contact surface of the specimen. After 5minutes, the specimen was removed from the machine socket and weighed to determine the final weight (wf) of the sample at 60.08g. The wear rate was calculated using Eq. (2) to Eq. (4).
$Wear~rate=\frac{Wear~volume}{Wear~velocity~×~Load~×~Time}$ (2)
$Wear~volume=\frac{Change~in~weight\left( {{w}_{i}}-{{w}_{f}} \right)}{Density~of~material}$ (3)
$Wear~velocity=\frac{2\pi RN}{60}$ (4)
(a)
(b)
Figure 4. Wear testing machine (a) before parameter settings (b) after parameter setting
2.5 Ductility
Percentage elongation was used to determine the ductility of the extrudes through tensile testing. The tensile tests were conducted following ASTM-B447 procedure [19]. The samples were machined to conform with the configuration of the tensile testing machine presented in Figure 5 (a). The full details of machined specimen dimension and its photograph are presented in Figure 5 (b). The initial diameter (di) and gauge length (li) of the samples were measured before they were fixed with the grip of the tensile testing machine (Figure 5 (a)). A pulling force of 60 kN was applied until necking occurs and eventually ruptured. The final length (lf) and diameter (df) were taken after the process. The percentage elongation was calculated using Eq. (5) below.
$Ductility=Percentage~elongation=~\frac{Final~length-Original~length}{Original~length}=\frac{{{l}_{f}}-{{l}_{i}}}{{{l}_{i}}}$ (5)
(a)
(b)
Figure 5. Tensile testing (a) machine (b) dimensions detail with photo
2.6 Evaluation of specimen grains refinement and exit temperature through Qform simulation
The Qform simulation, which is the globally accepted metal forming simulation program dedicated to aluminium profile extrusion, was used for the determination of how grains sizes of the extrudates at different reduction ratio were broken down into different nodes and elements. This software helps to calculate sophisticated mathematical equations that analyze the behavior of the materials under different forming conditions. It considers input parameters like temperature, friction and die dimensions in the prediction of the response properties. Calculations like those used in the experiments were produced while a few conditions were imposed such as an assumption of sample’s homogeneity and isotropy with visco-plastic deformation. The general material flow formulation for extrusion in Qform platform consists of the dynamic Eq. (6), the compatibility condition Eq. (7), constitutive Eq. (8), incompressible Eq. (9), energy balance Eq. (10) and flow stress Eq. (11). The refined grain can be identified by the increase in the number of nodes and elements of the extruded aluminium. Also, the exit temperatures at which that occurred were quantified. This process is called finite element in the Qform software. Like the experiments which had earlier been conducted, load and ram speed of 7000N and 6mm/s were respectively employed to extrude at 40% and 60% reduction ratios.
${{\sigma }_{ij,j}}$= 0 (6)
${{\sigma }_{ij}}=\text{ }\!\!~\!\!\text{ }\frac{2}{3}\frac{{\bar{\sigma }}}{{\bar{\varepsilon }}}{{\varepsilon }_{i,j}}$ (7)
${{\varepsilon }_{ij}}=~\frac{1}{2}~\left( {{V}_{i,j}}+{{V}_{j,~i}} \right)$ (8)
${{V}_{i,~i}}$= 0 (9)
$\rho c T=\left(k T_i\right), i+\beta \bar{\sigma} \dot{\bar{\varepsilon}}$ (10)
$\bar{\sigma}=\bar{\sigma}(\bar{\varepsilon}, \dot{\bar{\varepsilon}}, T)$ (11)
Stress, strain rate, and velocity components, respectively, are represented by ${{\sigma }_{ij}}$,${{\varepsilon }_{ij}},~{{V}_{i,j}},$
Effective stress, effective strain, and effective strain rate are represented by $\bar{\sigma}, \bar{\varepsilon}, \dot{\bar{\varepsilon}}$,
Density, specific heat, and thermal conductivity are represented by $\rho ,c,~k,$
T=temperature,
$\beta $=heat generation efficiency usually assumed as 0.9-0.95 [5].
3.1 Al-6063 alloying element composition
The elemental make-up of the Al-6063 grade used for this research is presented in Table 3. The composition conforms with the standard of British aluminium Standard of having Magnesium (0.45-0.9%) and Silicon (0.2-0.6%) as the major alloying elements. Other alloying elements (0-0.1% Zn, 0.05% Sr, 0-0.1% Ti, 0-0.1% Mn, 0-0.1% Cr, 0-0.1% Cu, 0-0.35% Fe) also fall within the range of the same standard. The total percentage composition of all alloying elements in the sample is 1.5%. Therefore, aluminium, as the major element, has 98.5%.
Table 3. Percentage constituent element of aluminium 6063 grade
|
Constituent Element |
% Composition |
|
Zn |
0.02 |
|
Sr |
0.05 |
|
Ti |
0.03 |
|
Mn |
0.04 |
|
Mg |
0.64 |
|
Cr |
0.07 |
|
Si |
0.37 |
|
Cu |
0.09 |
|
Fe |
0.19 |
3.2 Wear rate and ductility results
The wear rate and ductility of the extruded samples were presented in Table 4 based on the 13 experimental runs recommended by the design expert program used. The wear rate values of the extrudes at different temperatures and reduction ratios vary from 2.12×10⁷g/Nm to 4.02×10⁷g/Nm, while the ductility varies from 3.11% to 31%. As observed in Table 4, it can be deduced that both variables significantly impact the responses. The trend from the table shows that material extruded at the highest temperature and reduction ratio has the lowest wear rate and ductility. Samples with the lowest wear rate imply the hardest and lowest ductility. This confirms the principle of inverse relationship between hardness and ductility. As hardness increases, the ductility of that material reduces [20, 21]. As a result, extruded Al-6063 with a high wear rate is an indication of poor standard, and every effort should be focused on hardness maximization.
Table 4. Wear rate and ductility responses
|
Exp. Runs |
Dependent Variables |
Independent Variables |
||
|
|
Temp. (℃) |
Reduction ratio (%) |
WR (g/Nm) x 107 |
% Elongation (Ductility) |
|
1 |
400 |
20 |
4.02 |
31 |
|
2 |
500 |
20 |
3.83 |
24 |
|
3 |
400 |
60 |
2.41 |
7.41 |
|
4 |
500 |
60 |
2.26 |
5.02 |
|
5 |
379.29 |
40 |
3.74 |
20 |
|
6 |
520.71 |
40 |
2.62 |
10.32 |
|
7 |
450 |
11.72 |
4.23 |
37 |
|
8 |
450 |
68.28 |
2.12 |
3.11 |
|
9 |
450 |
40 |
3.13 |
15 |
|
10 |
450 |
40 |
3.13 |
15 |
|
11 |
450 |
40 |
3.11 |
15 |
|
12 |
450 |
40 |
3.12 |
15 |
|
13 |
450 |
40 |
3.17 |
15 |
3.3 Results for the developed model with statistical validation
The quadratic polynomial model was developed to forecast the wear rate and ductility of the extrudates after it was processed with temperature and reduction ratio as input. Eqs. (12) and (13) below represent the wear rate and ductility predictive models. The two models were developed using the Response Surface Methodology (RSM) approach of the Design Expert application.
$WR=3.13-0.7705A-0.2405B+0.01AB-1.65{{A}^{2}}+7.40{{B}^{2}}$ (12)
$D=15.00-11.31A-2.88B+1.15AB-2.34{{A}^{2}}-0.1075{{B}^{2}}$ (13)
where WR is the wear rate response (g/Nm)
D is the ductility response (%)
A is the reduction ratio (%)
B is the extrusion temperature (℃)
Analysis of Variance (ANOVA) was used to determine the significance of the developed model. Model significance is determined by the p-value presented in Table 5. A p-value of $\le 0.05$ represents significant factors. Based on the results presented in Table 5, the overall p-value for the wear rate in the general model, reduction ratio, and temperature are <0.0001, <0.0001, and 0.05, respectively. This is an indication of significant factors because they are all $\le 0.05$ Therefore, the stated factors can impact the wear rate of aluminium 6063 grade. However, their interactions AB, A2, and B2 have p-values of 0.9102, 0.8745, and 0.8454, respectively. Therefore, they are not significant in the prediction of wear rate because those values are all greater than 0.05. Similarly, in the case of ductility, all the factors and their interaction are $\le 0.05$ apart from B2 that have the p-value greater than 0.05 (0.7853). This means that all the factors and their interactions are significant factors in ductility predictions. Meanwhile, the output parameters respond more to the reduction ratio than to temperature, and the details of this are presented in Figures 6 (a) and (b).
(a)
(b)
Figure 6. Reduction ratio and temperature as extrusion factor of (a) wear rate (b) ductility
Table 5. Outputs ANOVA significancy test result
|
Source |
Wear Rate |
Ductility |
||
|
|
F Value |
p- value |
F Value |
p-value |
|
Model |
35.62 |
<0.0001 |
226.21 |
<0.0001 |
|
A-Reduction ratio |
162. 23 |
<0.0001 |
1020.24 |
<0.0001 |
|
B-Temp |
15.80 |
0.0050 |
66.36 |
<0.0001 |
|
AB |
0.0137 |
0.9102 |
5.29 |
0.050 |
|
A² |
0.0268 |
0.8745 |
37.96 |
0.0005 |
|
B² |
0.0409 |
0.8454 |
0.0801 |
0.7853 |
In furtherance to validation of the experimental and ANOVA results, model fittings result presented in Table 6 was developed. This is to verify if the developed model is fit for wear rate and ductility prediction. For a model to be fit for response predictions, coefficient of correlation (R2) should be greater than 95%, the difference between predicted (R2) and adjusted (R2) should be less than 0.2 while an adequate precision should be greater than 4 [22, 23]. Considering Table 6, R2 for wear rate and ductility are 96.22% and 99.38% respectively while the difference between the adjusted R2 and predicted R2 in both cases are 0.0019 and 0.0032. Also, the adequate precision in both cases is 18.74 and 47.02. Therefore, the model is fit for accurate predictions of the responses. In order to ascertain the degree of closeness between the predicted and experimented ductility and wear rate, Figure 7 is presented. It was discovered that the deviations were very small and the maximum and minimum deviation for ductility are 6% and 0% respectively. The maximum and minimum deviation between predicted and experimented wear rates are 6.8% and 0% respectively. This occurs at experimental run 5 in both cases as indicated in Figures 7 (a) and (b).
(a)
(b)
Figure 7. Actual vs predicted response for (a) ductility (b) wear rate
Table 6. Outputs model fitting result
|
Model Summary Characteristics |
Wear Rate |
Ductility |
|
Standard Deviation |
0.17 |
1.00 |
|
R2 |
0.9622 |
0.9938 |
|
Adjusted R2 |
0.9352 |
0.9895 |
|
Predicted R2 |
0.9333 |
0.9563 |
|
Adeq Precision |
18.74 |
47.0162 |
It should be noted that while the statistical approach used in this study provides valuable insights into the relationship between extrusion parameters and material properties, there are several potential limitations to consider. For example, the statistical models used assume a linear relationship between the extrusion parameters and material properties. However, there is the possibility of non-linear relationships, which may not be captured by the models. Also, there may be other variables that affect the relationship between extrusion parameters and material properties that were not included in the study.
3.4 Optimization of the process parameters
The desirability approach of the RSM was used to determine the best combination of all the input parameters (Reduction ratio and temperature) that optimized the output parameters (wear rate and ductility). The predicted combinations are 21. 4155% reduction ratio and 415.590℃ extrusion temperature. These two parameters optimized the responses (output factors) to 4.03322×10⁷(g/Nm) wear rate and ductility of 30.2031% at a desirability 1. The results of this optimization are presented in Figure 8. The extrusion factors optimization is important because Companies that adopt optimized extrusion processes have a competitive advantage in the market by offering high-quality products with improved mechanical properties. Also, the optimized extrusion processes can lead to cost savings through reduced energy consumption, lower material waste, and improved product quality. The ability to produce extruded products with suitable mechanical properties can enable manufacturers to expand their product range and for diverse customer needs.
Figure 8. Ramp for optimization result
Confirmatory experiments (Table 7) were also conducted for validation of predicted optimum results. Three experimental runs were conducted to validate the wear rate and ductility result at optimum condition. The percentage variation between the experiments conducted and the model value predicted in both cases was assessed using Eq. (14) and Eq. (15). The maximum and minimum percentage variation are 1.69% and 0.63% respectively, for wear rate and 0.14% and 2.78% for ductility. Thus, the average percentage variations for wear rate and ductility are 1.10% and 1.22%.
$\begin{gathered}\% \text { Wear rate variation }= \frac{\text { /predicted wear rate-experimented wear rate/}}{\text { predicted wear rate }} \times 100\end{gathered}$ (14)
$\begin{gathered}\% \text { Ductility variation }= \frac{\text {/predicted ductility-experimented ductility}/}{\text { predicted ductility }} \times 100\end{gathered}$ (15)
Table 7. Predicted versus experimented percentage variation result for wear rate and ductility of Al-6063 alloy
|
Run No. |
Wear Rate×107 (g/Nm) |
Ductility (%) |
Variation (%) |
|||
|
|
Exp. value |
Model value |
Exp. value |
Model value |
Wear rate |
Ductility |
|
1 |
3.9946 |
4.0332 |
31.0432 |
30.2031 |
0.97 |
2.78 |
|
2 |
4.0587 |
4.0332 |
30.2451 |
30.2031 |
0.63 |
0.14 |
|
3 Avg |
4.1014 |
4.0332 |
29.9786 |
30.2031 |
1.69 1.10 |
0.74 1.22 |
3.5 Al-6063 grain refinement and exit temperature simulation results
In the Qform simulation, the refined grain can be found by the increase in the number of nodes and elements of the extrudates after pressing. Also, the exit temperatures at which that occurred were quantified. This process is called finite element in the Qform software. The higher exit temperature of the extruded Al-6063 is an indication of higher thermal stress, and therefore, materials that have been subjected to high thermal stresses are prone to fatigue failure because higher extrusion temperatures can lead to Increased grain growth due to thermal energy and reduced grain refinement due to decreased dislocation density [24]. Figure 9 presents the initial numbers of nodes and elements of an unextruded Al-6063. Figures 10 (a) and (b) represent the numbers of nodes, elements, and exit temperature range of Al-6063 forged at 40% and 20% reduction ratios, respectively. It can be deduced from the two figures that an increase in the reduction rate led to more refined structures. This is because a higher reduction ratio (i.e., more severe deformation) can lead to increased grain refinement due to the introduction of more dislocations and formation of smaller, more equiaxed grains [25]. The smaller grain sizes can lead to improved strength and hardness due to increased grain boundary area. It can also enhance ductility and strength due to reduced grain size and increased dislocation density.
In Figure 9, when the samples have not been subjected to the extrusion process, there are 644 nodes and 291elements. The extrusion process was performed at two different reduction ratios, 20% and 40%, to investigate the effect of reduction ratio on grain refinement and exit temperature. The results show that increasing the reduction ratio from 20% to 40% leads to a significant refinement of grain size, as shown by the increase in the number of nodes and elements from 704 and 321 to 787 and 354, respectively (Figures 10 (a) and (b)).
Figure 9. Grain refinement and exit temperature of unextruded Al-6063 grade
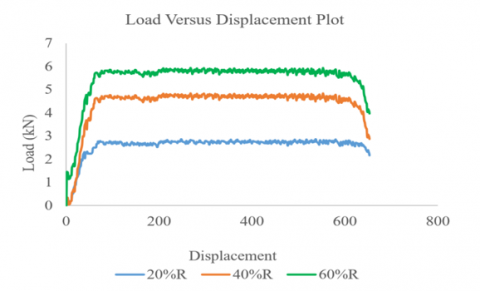
Furthermore, the exit temperature of the extruded material was found to increase with an increasing reduction ratio. Specifically, the maximum and minimum exit temperatures increased from 511.8℃ and 497.3℃ at a 20% reduction ratio to 531.9℃ and 504.8°C at a 40% reduction ratio (Figures 10 (a) and (b)). These findings suggest that higher reduction ratios can lead to improved grain refinement but may also result in increased exit temperatures. The latter can potentially lead to thermal stress development, which can compromise the durability of the extrudes. Therefore, it is essential to optimize the extrusion process to balance grain refinement and exit temperature to ensure the production of high-quality extrudates. This result justifies the optimization ramp in Figure 8, where the lower value of the reduction ratio (21.4155) was predicted as one of the optimum parameters of this process. The intensity of load applied at different reduction ratios is presented in Figure 11. It was discovered that higher reduction rates needed high extrusion loads. It required about 2.7kN, 4.8kN, and 5.9kN to extrude at 20%, 40% and 60% reduction rate, respectively. This is because, at a higher reduction ratio, the die exit area will be small compared to the entry diameter; hence, a larger force is required to force the billet through a small area [4].
(a)
(b)
Figure 10. Effect of reduction ratio on grain refinement and exit temperature of extruded Al-6063 alloy. (a) Grain structure and temperature distribution at 40% reduction ratio, showing refined grains and increased exit temperature (b) Grain structure and temperature distribution at 20% reduction ratio, illustrating less refined grains and lower exit temperature
Figure 11. Load/displacement response plot
3.6 Microstructures of Al-6063 formed under various reduction rates
Figures 12 (a)-(d) describe the grain sizes of the unextruded sample and extruded at different reduction ratios using an optical microscope. It is noticeable that a higher reduction rate enhances grain size reduction. Figure 12 (a) represents the grain structure of the unextruded. It has large coarse particles. Compared to this, with the grain structure of Al extruded at 20% reduction (Figure 12 (b)), the grain sizes have been broken down to smaller and finer ones. At a 40% reduction rate (Figure 12 (c)), a considerable decrease in grain size was also noticed compared to 20% reduction, and the finest particle was noticed at a 60% reduction rate. This is because of the possibility of grain growth occurrence at a lower reduction ratio, which can also affect the structural integrity, reduce strength, and lead to low efficiency in hot extrusion [21].
(a)
(b)
(c)
(d)
Figure 12. Grain structure of the (a) unextruded Al-6063 sample (b) extruded at 20% reduction rate (c) 40% reduction rate (d) 60% reduction rate
The study comprehensively investigated the relationships between processing parameters, microstructure, and mechanical properties of Al 6063 aluminium grade, and its application of statistical design of experiments (DOE) techniques for optimization, as a result, the following conclusions were drawn from the research.
[1] Mohan, R., Santhosh, M.I., Venkata, K.G. (2013). Improving mechanical properties of al 7075 alloy by equal channel angular extrusion process. International Journal of Modern Engineering Research, 3(5): 2713-2716. https://mail.ijmer.com/papers/Vol3_Issue5/AP3527132716.pdf.
[2] Magid, H.M., Sulaiman, S., Ariffin, M.K.A.M., Baharudin, B.T.H.T. (2014). Stress analysis of forward aluminum extrusion process using finite element method. Materials Research Innovations, 18(sup2): S2-611. https://doi.org/10.1179/1432891714Z.000000000626
[3] Adeosun, S.O., Balogun, S.A., Sekunowo, O.I., Usman, M.A. (2010). Effects of heat treatment on strength and ductility of rolled and forged aluminum 6063 alloy. Journal of Minerals and Materials Characterization and Engineering, 9(8): 763-773. http://doi.org/10.4236/jmmce.2010.98054
[4] Chaudhari, G.A., Andhale, S.R., Patil, N.G. (2012). Experimental evaluation of effect of die angle on hardness and surface finish of cold forward extrusion of aluminum. International Journal of Emerging Technology and Advanced Engineering, 2(7): 334-338.
[5] Azeez, T.M., Mudashiru, L.O., Asafa, T.B., Adeleke, A.A., Ikubanni, P.P. (2021). Mechanical properties of Al 6063 processed with equal channel angular extrusion under varying process parameters. International Journal of Engineering Research in Africa, 54: 23-32. https://doi.org/10.4028/www.scientific.net/JERA.54.23
[6] Talebanpour, B., Ebrahimi, R. (2009). Upper-bound analysis of dual equal channel lateral extrusion. Materials & Design, 30(5): 1484-1489. http://doi.org/10.1016/j.matdes.2008.08.006
[7] Chung, S.W., Kim, W.J., Kohzu, M., Higashi, K. (2003). The effect of ram speed on mechanical and thermal properties in ECAE process simulation. Materials Transactions, 44(5): 973-980. https://doi.org/10.2320/matertrans.44.973
[8] Olejnik, L., Presz, W., Rosochowski, A. (2009). Backward extrusion using micro-blanked aluminium sheet. International Journal of Material Forming, 2: 617-620. http://doi.org/10.1007/s12289-009-0533-6
[9] Parshikov, R.A., Rudskoy, A.I., Zolotov, A.M., Tolochko, O.V. (2013). Technological problems of equal channel angular pressing. Reviews on Advanced Materials Science, 34: 26-36.
[10] Bakhtiari, H., Karimi, M. Rezazadeh, S. (2014). Modeling, analysis and multi-objective optimization of twist extrusion process using predictive models and meta-heuristic approaches, based on finite element results. Journal of Intelligent Manufacturing, 27: 463-473. https://doi.org/10.1007/s10845-014-0879-6
[11] Thiyagarajan, R., Gopinath, A. (2014). Enhancement of mechanical properties of AA 6351 using equal channel angular extrusion (ECAE). Materials Science and Metallurgy Engineering, 2(2): 26-30. https://doi.org/10.12691/msme-2-2-3
[12] Azeez, T.M., Mudashiru, L.O., Asafa, T.B., Adeleke, A.A., Yusuff, A.S., Ikubanni, P.P. (2023). Mechanical properties and stress distribution in aluminium 6063 extrudates processed by equal channel angular extrusion technique. Australian Journal of Mechanical Engineering, 21(4): 1326-1334. https://doi.org/10.1080/14484846.2021.2003003
[13] Rusz, S., Malanik, K. (2007). Using severe plastic deformation to prepare of ultra fine-grained materials by ECAP method. Archives of Materials Science and Engineering, 28(11): 683-686.
[14] Segal, V.M. (2018). Review: Modes and processes of severe plastic deformation (SPD). Materials, 11(7): 1175. http://doi.org/10.3390/ma11071175
[15] Laptev, A.M., Perig, A.V., Vyal, O.Y. (2014). Analysis of equal channel angular extrusion by upper bound method and rigid blocks model. Materials Research, 17(2): 359-366. https://doi.org/10.1590/S1516-14392013005000187
[16] Zhang, H., Liu, J., Sui, D., Cui, Z., Fu, M.W. (2018). Study of microstructural grain and geometric size effects on plastic heterogeneities at grain-level by using crystal plasticity modeling with high-fidelity representative microstructures. International Journal of Plasticity, 100: 69-89. https://doi.org/10.1016/j.ijplas.2017.09.011
[17] Zhu, Q., Wang, C., Qin, H., Chen, G., Zhang, P. (2019). Effect of the grain size on the microtensile deformation and fracture behaviors of a nickel-based superalloy via EBSD and in-situ synchrotron radiation X-ray tomography. Materials Characterization, 156: 109875. http://doi.org/10.1016/j.matchar.2019.109875
[18] All Standards and Publication. (2021). ASTM. https://standards.iteh.ai/catalog/standards/astm/1ae96a8c-52ae-437e-975a-19df22380a04/astm-b221m-21.
[19] Azeez, T.M., Mudashiru, L.O., Ojetoye, A.A. (2022). Assessment of microstructure and mechanical properties of as-cast magnesium alloys reinforced with organically extracted zinc and calcium. Advances in Manufacturing Technologies and Production Engineering, 6(5): 45-55. https://doi.org/10.2174/9789815039771122010009
[20] Banerjee, B., Pradhan, S., Das, S., Dhupal, D. (2024). Surface topography characterization of USMM during machining of zirconia ceramic using silicon carbide abrasives: An experimental and simulation approach. CIRP Journal of Manufacturing Science and Technology, 51: 1-19. https://doi.org/10.1016/j.cirpj.2024.03.009
[21] Banerjee, B., Pradhan, S., Dhupal, D. (2024). Machining and surface characterization of Si3N4-Based ceramic during recently developed USMM using sic abrasives: An experimental investigation and simulation approach. Arabian Journal for Science and Engineering, 49(11): 15367-15395. https://doi.org/10.1007/s13369-024-08989-5
[22] Azeez, T.M., Mudashiru, L.O., Adeleke, A.A., Ikubanni, P.P., Agboola, O.O., Adesina, O.S. (2021). Effect of heat treatment on micro hardness and microstructural properties of Al 6063 alloy reinforced with silver nanoparticles (AgNps). In IOP Conference Series: Materials Science and Engineering. IOP Publishing, 1107(1): 012013. https://doi.org/10.1088/1757-899X/1107/1/012013
[23] Furushima, T., Tsunezaki, H., Manabe, K.I., Alexsandrov, S. (2014). Ductile fracture and free surface roughening behaviors of pure copper foils for micro/meso-scale forming. International Journal of Machine Tools and Manufacture, 76: 34-48. https://doi.org/10.1016/j.ijmachtools.2013.10.001
[24] Li, C.C., Qiao, X.G., Sun, W., Golovin, I.S., Kim, H.S., Sakai, T., Zheng, M.Y. (2025). Effect of grain size on mechanical characteristics and work-hardening behavior of fine-grained Mg-0.8 Mn alloy via adjusting extrusion temperature. Journal of Alloys and Compounds, 1010: 177322. https://doi.org/10.1016/j.jallcom.2024.177322
[25] Yang, W., Jiang, H., Zhou, P., Shao, B., Zong, Y. (2025). Continuous and discontinuous dynamic recrystallization in the superplastic deformation of moderately cold-deformed Cr4Mo4Ni4V martensitic steel. Journal of Materials Processing Technology, 335: 118647. https://doi.org/10.1016/j.jmatprotec.2024.118647