Afyaa Saad Neamaha![]() | Ali Fadhil Naser*
| Ali Fadhil Naser*![]()
© 2025 The authors. This article is published by IIETA and is licensed under the CC BY 4.0 license (http://creativecommons.org/licenses/by/4.0/).
OPEN ACCESS
A bridge is a construction that enables traffic to cross a barrier while keeping in touch with roads or railroads. Throughout history, bridges have played a crucial role in human civilisation and remain an essential component of any transportation network. The main purpose of this study is to evaluate the seismic resistance of bridge structure under effect of earthquake action by adopting force-displacement yielding points and performance points methods. The results of force-displacement yielding point and performance points revealed that the transversal yielding points were greater than the longitudinal yielding points and performance points, this indicates that the seismic action on the transversal bents has little effect and that no damage will be done to the bents if they are subjected to this action alone but in longitudinal direction the force-displacement yielding point and performance points were lower, indicating that the seismic resistance performance of bridge bents is small with low elasticity and stiffness and high plasticity. Meaning that bridge bents capacity cannot resist the demand. Therefore, Therefore, this study suggested to improve the structural performance and seismic resistance of bridge bents by increasing the diameter of bridge piers by 1.6m, 1.8m, and 2m. After thickening the piers structure, the results of yielding points and performance points values were increased with increasing the piers diameter. And the seismic displacement decreased with increasing the piers diameter. Indicating that the elastic limit of bridge bents will increase and the bridge piers will resist the earthquake action according to increase in the stiffness and bearing capacity of bridge bents.
bridge, I-girder, pushover, force-displacement, performance point, piers, bents, earthquake
Bridges serve as crucial connections between roadways and are crucial to the transportation sector. Relevant data indicates that concrete bridges make up over 90% of all bridges in China. A bridge is a construction that enables traffic to cross a barrier while keeping in touch with roads or railroads. Throughout history, bridges have played a crucial role in human civilisation and remain an essential component of any transportation network. They serve as essential links for both pedestrian and vehicle traffic and are an integral part of the transport system. The regulations and standards of various areas determine how bridges are classified. Bridge type selection is based on site characteristics, vendor preferences, site hydraulics, profile location, and construction cost. The density and volume of traffic loads, as well as the region that the bridge connects, determine the size of the bridge construction [1-8].
There are two sections to these bridge structural components. The first components are the drainage system, pavement layers, joints, deck, girders or beams, bearings, and security barrier. Superstructure was the name given to them. The foundations, piers, and pier caps made up the second section, which was referred to as the substructure. It is possible to build bridges across obstacles like rivers, roads, and railroads. Bridge constructions may be categorised based on the kinds of supports and materials used. Concrete, pre-stressed concrete, wood, and steel bridges are among the several kinds of bridges based on the materials used in their construction. Simply supported bridges and continuous bridges are two examples of the sorts of supports used in bridge constructions [9-12].
Over the last 20 years, several transportation agencies have made extensive use of precast/prestressed concrete I-girders. These girders offer various benefits, including the capacity to support multiple prestressing strands, a lower girder weight, increased construction stability, and a suitable platform for workers. Despite these benefits, the thin and broad top flange may be a drawback for deck removal since it is more prone to damage. The effect of deck removal on supporting girder performance is examined in this research [13, 14].
Presently, earthquakes are natural disasters that compromise the integrity and functionality of structures. The extent of damage an earthquake inflicts on structures depends on the type of building, the nature of the soil, the technology employed for seismic protection, and, importantly, the building's location. The effects of an earthquake on a specific region predominantly depend on the kind of soil in which the building's foundation is constructed, as earthquakes alter ground motion, leading to foundation failure. Earthquakes produce varying shaking intensities across different places, resulting in differential levels of structural damage in structures at these sites. An earthquake is the shaking of the Earth, or alternatively, the release of energy due to the movement of tectonic plates. This natural calamity has several detrimental impacts on the Earth, including ground shaking, landslides, rockfalls from cliffs, state changes, fires, and tidal waves [15-17].
Decisions for post-earthquake emergency work may be made based on a quick and precise evaluation of the damage to bridge structures after an earthquake. Nevertheless, the conventional methods for assessing structural damage are ineffective, subjective, and time-consuming. Every bridge should be inspected in order to get data on its structural sufficiency and condition. Every kind of bridge should have its damage inspected for the sake of user safety and, often, the local economy. Every component of the bridge is examined throughout the inspection process to determine if it is in excellent condition or requires strengthening or repair. Review reports, site conditions, required tools and equipment, traffic control (if required), and site survey are all included in the inspection plan, as well as structural inspection, which covers deck, superstructure, and substructure examination. Bridges are often regarded as a roadway network's most important component. Any post-earthquake bridge inspection program's main goal should be safety, but maintaining mobility is also crucial because the highway network is required to deliver emergency services, maintain security, provide access for relief and reconstruction, and help the economy recover from a catastrophic event. Seismic damage indices and advanced inelastic analysis programs may improve the assessment process's objectivity and accuracy, but only if they can be proven to be highly dependable. At the moment, these tools are not used enough for engineers to fully trust them [18-26].
Bridge structures must be assessed, strengthened, or repaired after an earthquake. Bridge structural members may be strengthened by adding more load-bearing materials, redistributing loading activities via induced deformation on the structure system, and replacing subpar or faulty elements with better ones. Numerous considerations determine which approach is best for fortifying and repairing the bridge's structural components. The elements include the kind and age of the building, its significance, the amount of strength that must be increased, the kind and extent of damage, the materials that are available, the cost and viability, and aesthetics [27, 28].
Knowledge of structural dynamics, earthquake engineering, and bridge engineering concepts are necessary for the seismic design and analysis of bridges. To make it easier to study, analyse, and build bridges that are vulnerable to seismic stresses, engineers use specialised software tools like CSi Bridge. The superstructure and substructure are often examined independently in bridge study. A grid composed of main girders, transverse diaphragms, and a deck slab usually makes up the superstructure. A grid of line segments makes up the deck slab. The word "girder" is often used in place of "beam" when designing bridges. Because girder bridges work well for building small to medium span bridges, they are often used in the transportation sector. Depending on its design and material, girder bridges are typically less than 50 meters long and cannot span more than 150 meters. Girder bridges are often used for small and medium span bridges; however, they are not the best option for lengthy spans. Steel or concrete may be used to build girders, with concrete girders being prestressed or strengthened [29-31].
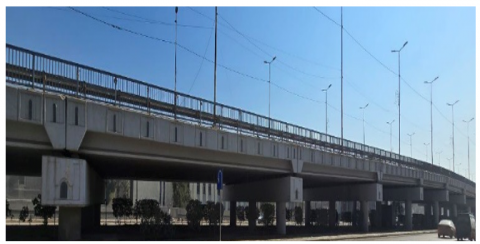
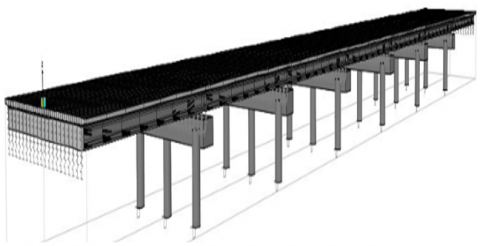
The selected bridge structure is a type of precast I-girder prestressed concrete bridge which is located in important area within Hilla city in the middle of Iraq. This bridge serves the movement of traffic from Baghdad province (capital of Iraq) to southern provinces of Iraq and vice versa. Since all of the spans in a bridge structure have the same size and characteristics, seven of the 19 spans are chosen for this study. Each span is 20 meters long and 17.5 meters wide. The chosen spans are 140 meters long overall. There are twenty I-girders made of precast prestressed concrete. These 7 spans have two abutments and 6 bents. There are three 1.2-meter-diameter piers on each bent. The pier's height of 5 meters is chosen as the highest pier in the bridge structure. Concrete's girder and bending compression strengths are 42 MPa and 33 MPa, respectively. Prestressed tendons are made of ASTM A416-grade 270 steel, which has seven wires per strand. Thirteen tendons are distributed throughout the tension zone of each girder. Each tendon has a prestressed force of 181 kN. The bridge construction is depicted in Figure 1, and the numerical model of a few chosen spans of a precast I-girder prestressed concrete bridge is shown in Figure 2. In this study, CSI-bridge version 24 is utilized.
(a) View of longitudinal spans
(b) Cross-section view
Figure 1. The bridge construction is depicted
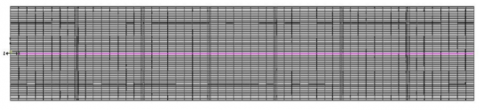
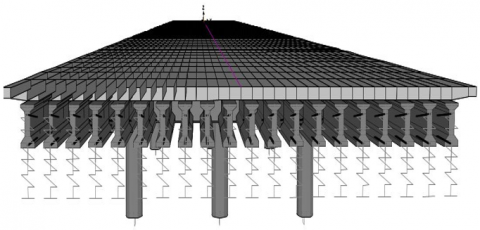
(a) 3-D view
(b) Side view
(c) Front view
Figure 2. Precast I-girder prestressed concrete bridge model for 7 spans
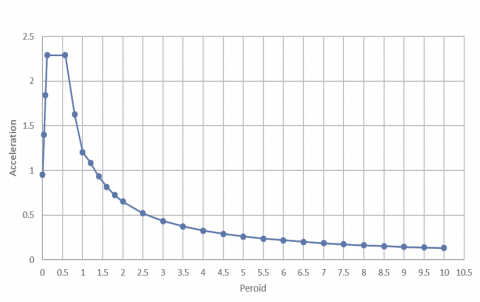
The ground wave threat by implementing the displacement and time period. To take into account the impact of potential seismic activity on the bridge model, which represents the lateral horizontal stress of an earthquake on the bridge structure in both transverse and longitudinal directions, the ground wave hazard must be established. Response Spectrum is chosen as the function type, while ASSHTO 2012 is chosen as the standard. D is chosen as the site class. The damping ratio is 0.05, and the response spectrum function is called EQ. The ground wave hazard curve, often known as the seismic design curve, is seen in Figure 3.
Figure 3. Ground motion wave hazard curve of earthquake
Non-linear static analysis can be used to establish the pushover analysis approach. The non-linear behavior of bridge structures under seismic loads can be computed easily using this method. The pushover analysis approach can be used to identify the mode of final failure and demonstrate the actual failure of structures. By tracking the classification of damages to each component of the structure, the approach typically also determines likely weak areas. The basic premise of the pushover analysis approach is that the first modes of vibration and the shape of those modes govern the structure's response. In order to ascertain the seismic capability of bridge structures under earthquake lateral stresses, the yielding point based on force and displacement is crucial. This method is highly effective for assessing the seismic safety of both new and existing structural elements. Numerous approaches exist for the use and implementation of the non-linear static analysis method (pushover analysis). These approaches encompass various load patterns, the incorporation of higher modes, adaptive load patterns, and force versus displacement management [32-35].
4.1 Seismic displacement capacity analysis (force-displacement yielding point)
The displacement-force curve's yield point is calculated for each bridge structure support in both longitudinal and transverse directions. By adopting the point (displacement, horizontal force) on the displacement capacity curve that comes immediately after the higher point on the curve, one may determine the yield point, which represents the displacement capacity of bridge supports [36].
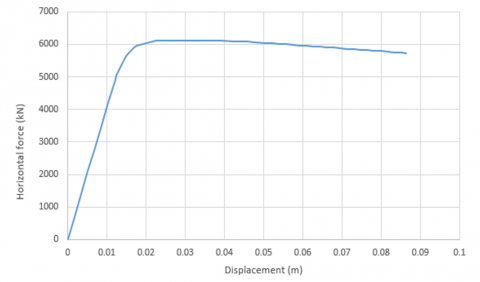
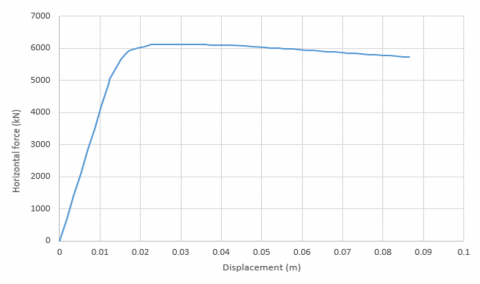
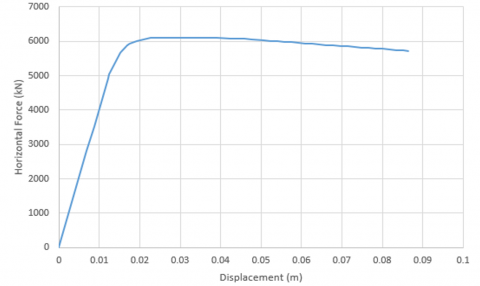
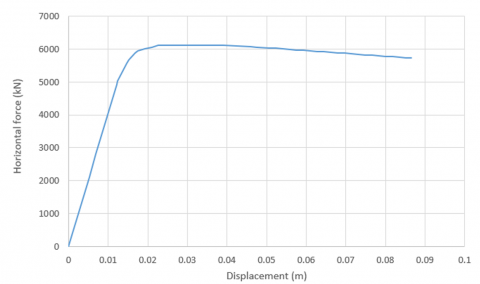
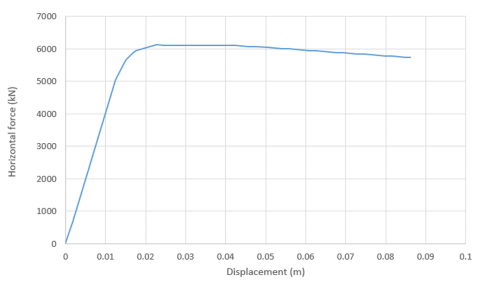
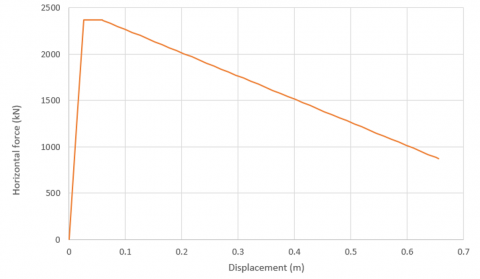
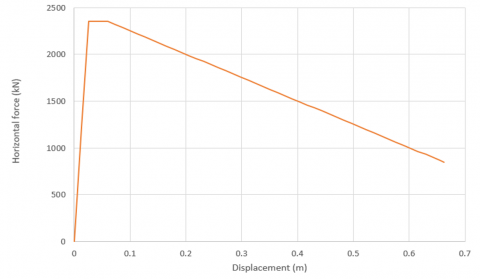
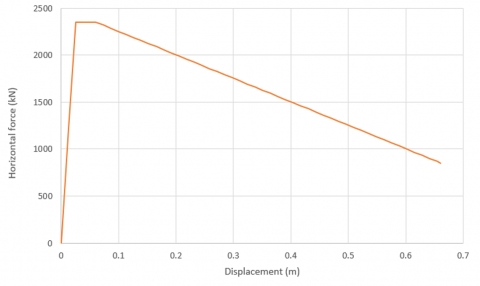
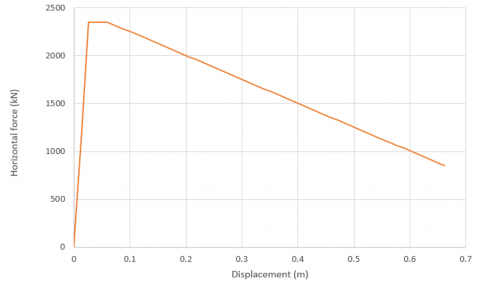
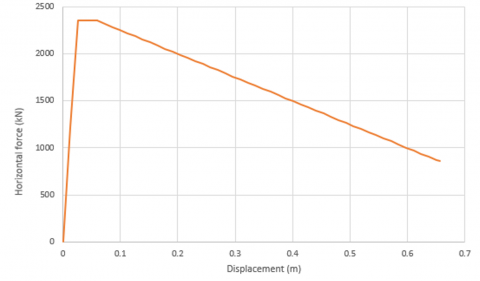
Table 1, Figure 4, and Figure 5 show the yielding point of force-displacement for each bent in transvers and longitudinal direction. It can be seen that the yielding points in transvers direction are more than the yielding points in longitudinal direction which are maximum value of yielding displacement is 0.02437m and yielding force is 6121.893kN, indicating that the seismic action on the bents in transvers direction has not important effect and there are not any damages will occur if the bents subjected just for this action. Whereas, the bents will subject to serious damages due to action of seismic in longitudinal direction and the bents will have plasticity more than elasticity because of yielding displacement is high and it is equal to 0.059911m and yielding force is 2352.46kN.
Table 1. Force - displacement for bridge bents in transvers and longitudinal direction
|
Bent No. |
Transverse Direction (Y) |
Longitudinal Direction (X) |
||
|
|
Force |
Displacement |
Force |
Displacement |
|
1 |
6121.893 |
0.02436 |
2363.98 |
0.059832 |
|
2 |
6108.527 |
0.024359 |
2352.464 |
0.059911 |
|
3 |
6108.527 |
0.024358 |
2352.465 |
0.059911 |
|
4 |
6108.527 |
0.024358 |
2352.465 |
0.059911 |
|
5 |
6110.015 |
0.022629 |
2352.467 |
0.059911 |
|
6 |
6121.628 |
0.02437 |
2349.110 |
0.059856 |
(a) Force-displacement curve for bent No. 1 in transverse direction (Y)
(b) Force-displacement curve for bent No. 2 in transverse direction (Y)
(c) Force-displacement curve for bent No. 3 in transverse direction (Y)
(d) Force-displacement curve for bent No. 4 in transverse direction (Y)
(e) Force-displacement curve for bent No. 5 in transverse direction (Y)
(f) Force-displacement curve for bent No. 6 in transverse direction (Y)
Figure 4. Force - displacement for bridge bents in transvers direction (Y)
(a) Force-displacement curve for bent No. 1 in longitudinal direction (X)
(b) Force-displacement curve for bent No. 2 in longitudinal direction (X)
(c) Force-displacement curve for bent No. 3 in longitudinal direction (X)
(d) Force-displacement curve for bent No. 4 in longitudinal direction (X)
(e) Force-displacement curve for bent No. 5 in longitudinal direction (X)
(f) Force-displacement curve for bent No. 6 in longitudinal direction (X)
Figure 5. Force - displacement for bridge bents in longitudinal direction (X)
4.2 Seismic performance points analysis of bridge spans
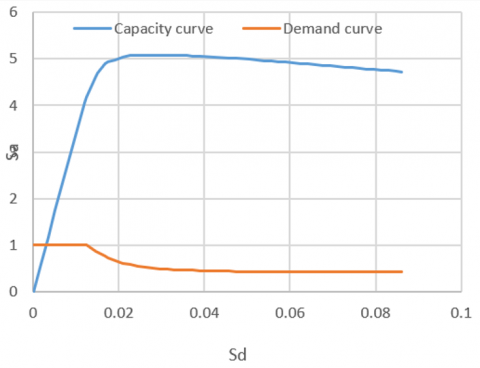
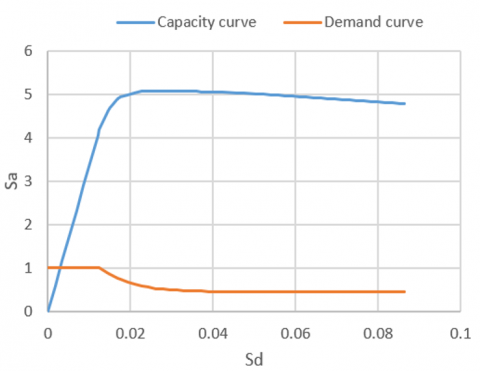
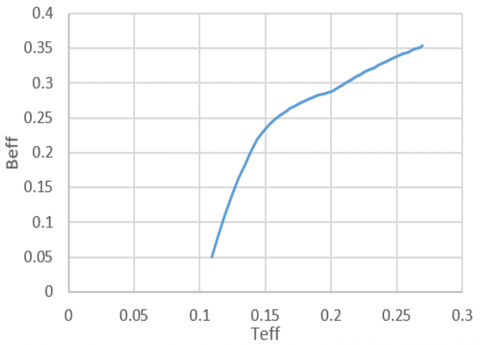
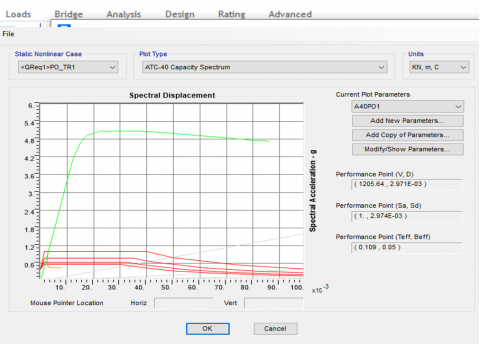
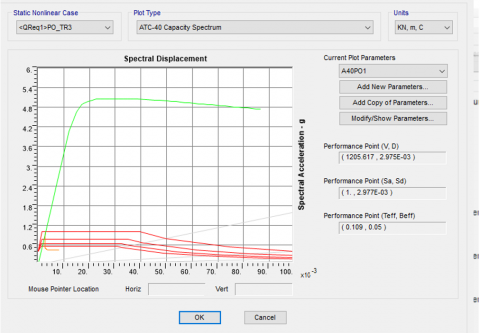
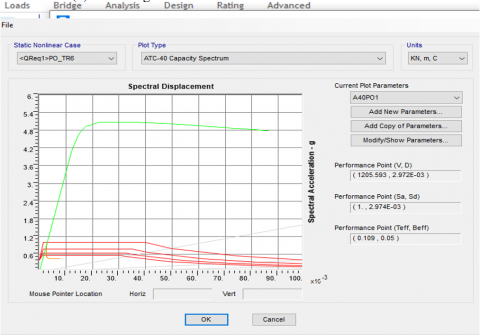
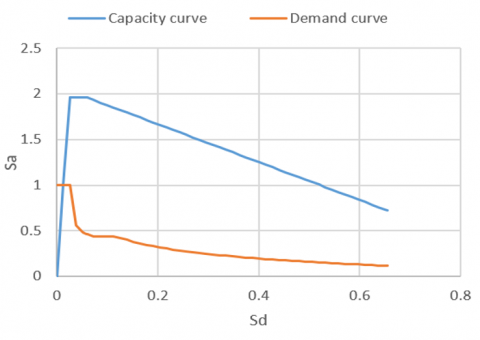
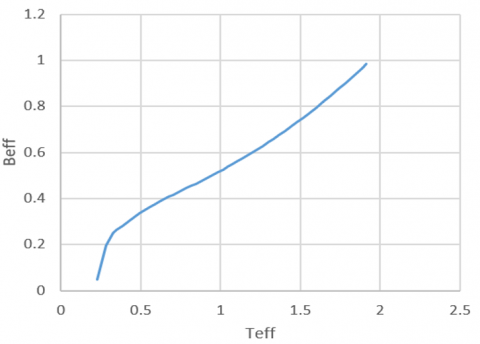
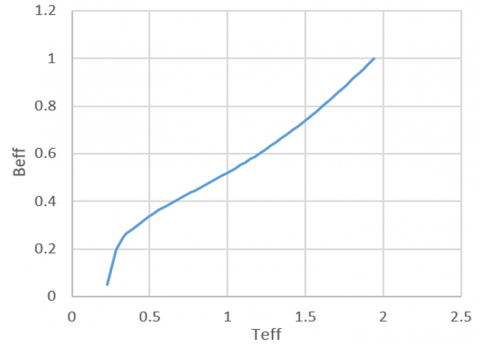
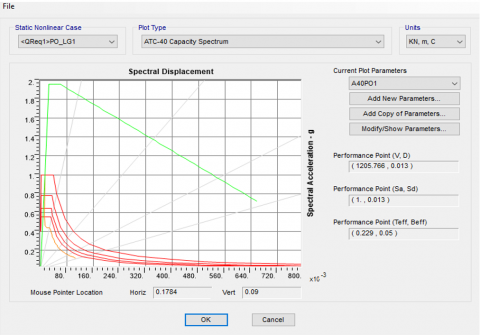
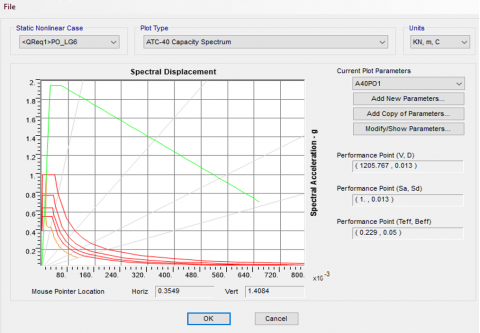
In this investigation, three seismic performance points are employed. Seismic performance spots may be found using pushover analysis curves, which are the intersection of the demand and capacity spectrum curves. When actual displacement and anticipated goal displacement are equal, the capacity curve's performance point is reached. The (V, D) point represents the shear force (V) and displacement (D); the (Sa, Sd) point indicates the spectral acceleration (Sa) and spectral displacement (Sd); and the (Teff, Beff) point indicates the effective period (Teff) and effective damping (Beff) [36-38].
Table 2, Table 3, Figures 6 to Figure 11 contain on the results of seismic performance points under the effect of earthquake action resulting from non-linear pushover analysis of static responses. Because of the results of performance points are same for most bents, it will show just the capacity-demand curve, Teff-Beff curve, and CSI-bridge curve for bent No. 1, bent No. 3 and bent No. 6. It can be seen that the performance points in transverse direction for all bents are equal and the performance point of shear force and displacement is (v=1205.6kN, D=0.00297m), the performance point of spectral acceleration and spectral displacement is (Sa=1, Sd=0.00297m), and the performance point of effective period and effective damping is (Teff=0.109, Beff=0.05), indicating that the seismic resistance performance of bridge bents in transverse direction is high. Whereas, in longitudinal direction the performance points are more and the performance point of shear force and displacement is (v=1205.77kN, D=0.0130m), the performance point of spectral acceleration and spectral displacement is (Sa=1, Sd=0.0310m), and the performance point of effective period and effective damping is (Teff=0.230, Beff=0.05), showing that the seismic resistance performance of bridge bents is small with low elasticity and stiffness and high plasticity. Therefore, bridge bents capacity cannot resist the demand.
Table 2. Bents performance points under effect of earthquake action in transverse direction
|
Bent No. |
1 |
2 |
3 |
4 |
5 |
6 |
|
Shear Force (V) |
1205.60 |
1205.60 |
1205.60 |
1205.60 |
1205.60 |
1205.60 |
|
Displacement (D) |
0.00297 |
0.00297 |
0.00297 |
0.00297 |
0.00297 |
0.00297 |
|
Spectral acceleration (Sa) |
1 |
1 |
1 |
1 |
1 |
1 |
|
Spectral displacement (Sd) |
0.00297 |
0.00297 |
0.00297 |
0.00297 |
0.00297 |
0.00297 |
|
Effective period (Teff) |
0.109 |
0.109 |
0.109 |
0.109 |
0.109 |
0.109 |
|
Effective damping (Beff) |
0.05 |
0.05 |
0.05 |
0.05 |
0.05 |
0.05 |
Table 3. Bents performance points under effect of earthquake action in longitudinal direction
|
Bent No. |
1 |
2 |
3 |
4 |
5 |
6 |
|
Shear Force (V) |
1205.77 |
1205.77 |
1205.77 |
1205.77 |
1205.77 |
1205.77 |
|
Displacement (D) |
0.0130 |
0.0130 |
0.0130 |
0.0130 |
0.0130 |
0.0130 |
|
Spectral acceleration (Sa) |
1 |
1 |
1 |
1 |
1 |
1 |
|
Spectral displacement (Sd) |
0.0130 |
0.0130 |
0.0130 |
0.0130 |
0.0130 |
0.0130 |
|
Effective period (Teff) |
0.229 |
0.230 |
0.230 |
0.230 |
0.230 |
0.229 |
|
Effective damping (Beff) |
0.05 |
0.05 |
0.05 |
0.05 |
0.05 |
0.05 |
(a) (sa, sd) point for bent No. 1
(b) (sa, sd) point for bent No. 3
(c) (sa, sd) point for bent No. 6
Figure 6. Performance point of spectral acceleration (Sa) and spectral displacement (Sd) for bridge bents No. 1, No. 3 and No. 6 in transverse direction
(a) Teff-Beff curve for bent No. 1 in transvers direction
(b) Teff-Beff curve for bent No. 3 in transvers direction
(c) Teff-Beff curve for bent No. 6 in transvers direction
Figure 7. Effective period (Teff) and effective damping (Beff) relationship for bridge bents No. 1, No 3 and No. 6 in transvers direction
(a) CSI-bridge curve for bents No. 1 in transvers direction
(b) CSI-bridge curve for bents No. 3 in transvers direction
(c) CSI-bridge curve for bents No. 6 in transvers direction
Figure 8. CSI-bridge curve for performance points of bridge bents No. 1, No. 3 and No. 6 in transverse direction
(a) (sa, sd) point for bent No. 1
(b) (sa, sd) point for bent No. 3
(c) (sa, sd) point for bent No. 6
Figure 9. Performance point of spectral acceleration (Sa) and spectral displacement (Sd) for bridge bents No. 1 and No. 6 in longitudinal direction
(a) Teff-Beff curve for bent No. 1 in longitudinal direction
(b) Teff-Beff curve for bent No. 3 in longitudinal direction
(c) Teff-Beff curve for bent No. 6 in longitudinal direction
Figure 10. Effective period (Teff) and effective damping (Beff) relationship for bridge bents No. 1, No. 3 and No. 6 in longitudinal direction
(a) CSI-bridge curve for bents No. 1 in longitudinal direction
(b) CSI-bridge curve for bents No. 3 in longitudinal direction
(c) CSI-bridge curve for bents No. 6 in longitudinal direction
Figure 11. CSI-bridge curve for performance points of bridge bents No. 1, No. 3 and No. 6 in longitudinal direction
4.3 Maximum seismic displacement of bents
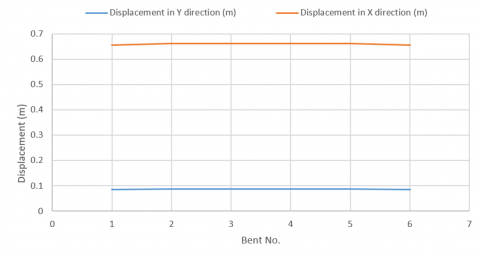
According to Table 4, Figure 12, the maximum seismic displacement of bridge bents in transverse direction is approximated same and it is 0.087m. Whereas, in longitudinal direction, bridge bents appear higher values of seismic displacement which is equal to 0.662m comparing with transvers direction. Therefore, the dangerous case will appear in the long of bridge structure.
Table 4. Maximum seismic displacement of bridge bents in transvers and longitudinal direction
|
Bent No. |
Displacement in Y Direction (m) |
Displacement in X Direction (m) |
|
1 |
0.086 |
0.656 |
|
2 |
0.087 |
0.662 |
|
3 |
0.087 |
0.661 |
|
4 |
0.087 |
0.661 |
|
5 |
0.087 |
0.662 |
|
6 |
0.086 |
0.656 |
Figure 12. Seismic displacement of bridge bents in transverse and longitudinal direction
Seismic analysis of a precast prestressed I-girder bridge structure revealed that the bents' seismic resistance was insufficient to withstand the lateral horizontal action of an earthquake. The bents' stiffness and elasticity also needed to be improved because they had reached the plastic area, which is where damage would manifest on the bents' structure when an earthquake occurred. Thus, by enlarging bridge piers and adding more steel reinforcement, this study proposes to enhance the structural performance and seismic resistance of bridge bents. High performance concrete (c > 65MPa) can be cast after a steel reinforcement plant with an ancient pier structure is adopted. This study will examine the bridge structure caused by earthquake action utilizing three pier diameters—1.6, 1.8, and 2 meters—in order to compare the outcomes of seismic analysis methodologies for bridge bents with new diameters with the original diameter of piers (D=1.2 meters). After comparing the outcomes of the pushover method, modal method, and D/C ratio, the ideal diameter for piers to withstand seismic activity will be suggested.
5.1 Pushover analysis results of force-displacement yielding points
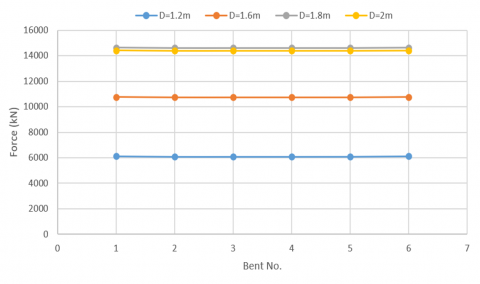
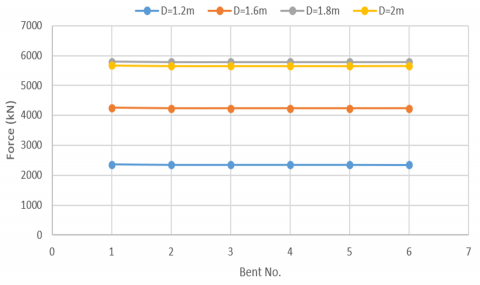
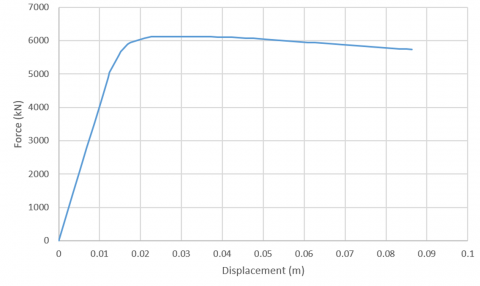
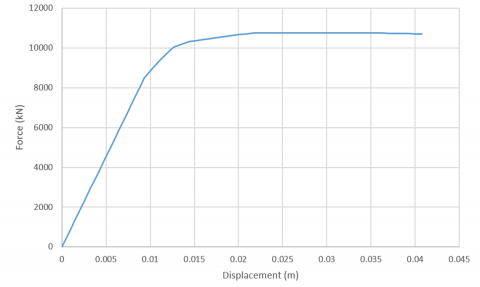
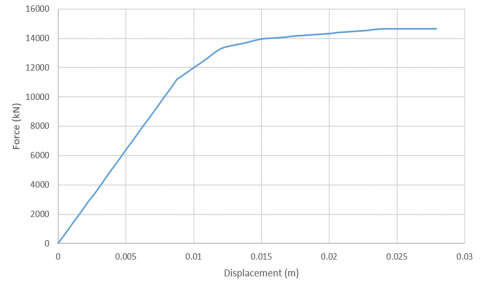
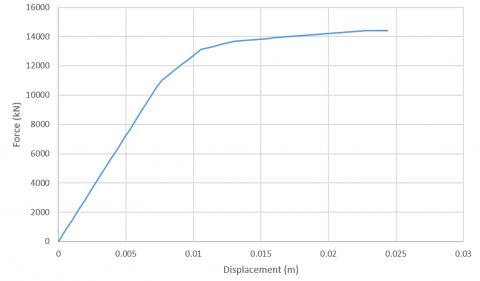
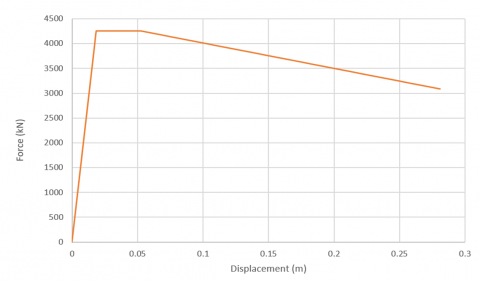
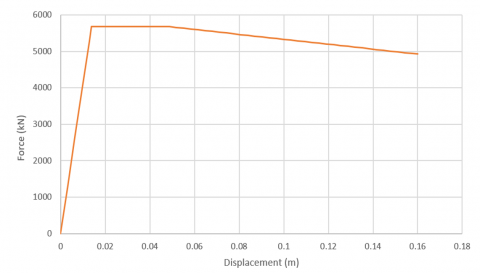
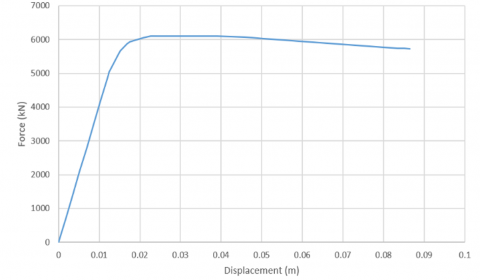
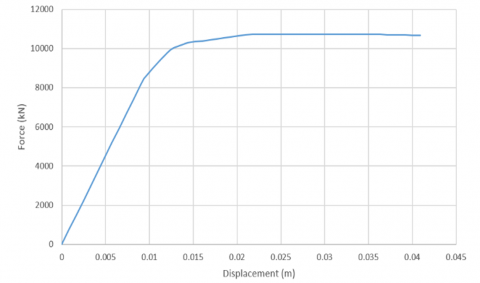
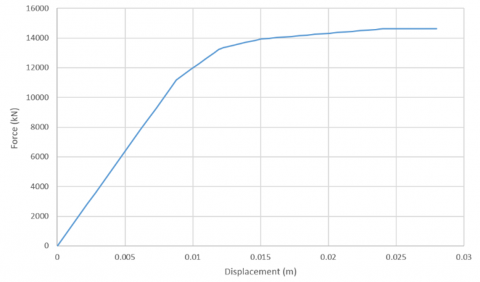
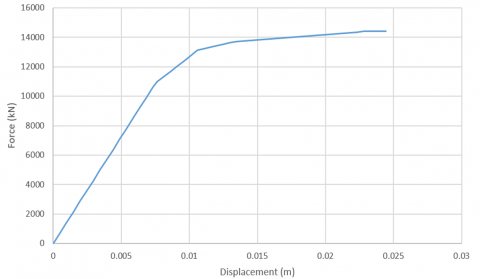
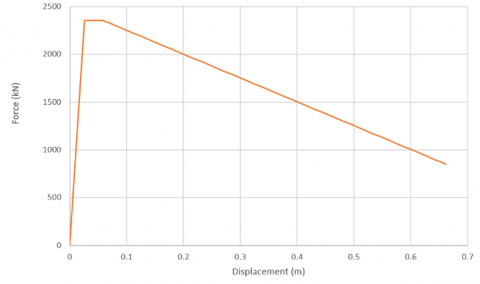
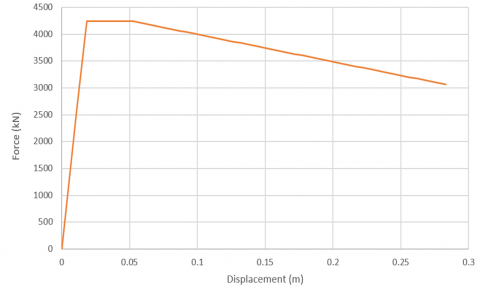
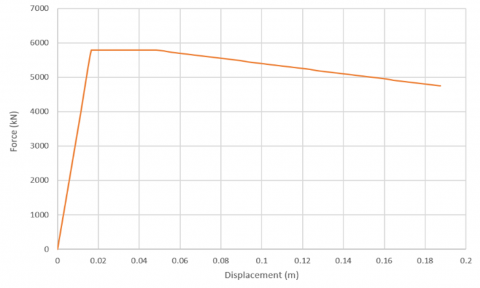
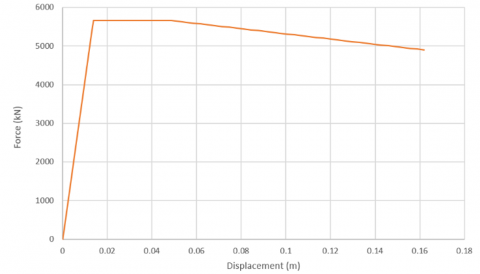
The comparison results of force-displacement yielding points in transverse direction (Y) are listed and showed in Table 5, Figure 13, and Figure 14. It can be seen that the values of yielding points are increased with increasing the piers diameter. Indicating that the elastic limit of bridge bents will increase and the bridge piers will resist the earthquake action. In general, the earthquake in transverse direction has not important effects, but for longitudinal direction which is represent the length of bridge structure, has significant influences on the bridge structure performance. The comparison results of yielding points can be shown them in Table 6, Figure 15 and Figure 16. The magnitude of shear force are increased with increasing of piers diameter and it will be 2363.98kN within piers diameter 1.2m to 5664.803kN for pier diameter 2m. Whereas, the displacements are decreased with increasing of piers diameter which are 0.059832m for piers diameter 1.2m to 0.048765m within piers diameter 2m, meaning that the capacity of bridge bents is increased with thickening the piers structure and it will be more than demand. Therefore, the bridge piers will have more elasticity and bearing capacity to resists the effect of earthquake. Figure 17 shows force-displacement yielding points in Y direction of bridge bent No. 1 with piers diameters 1.2m, 1.6m, 1.8m, and 2m. Figure 18 illustrates the force-displacement yielding points in X direction of bridge bent No. 1 with piers diameters 1.2m, 1.6m, 1.8m, and 2m. Figure 19 shows force-displacement yielding points in Y direction of bridge bent No. 1 with piers diameters 1.2m, 1.6m, 1.8m, and 2m. Figure 20 illustrates the force-displacement yielding points in X direction of bridge bent No. 1 with piers diameters 1.2m, 1.6m, 1.8m, and 2m.
Table 5. Force-displacement yielding points in Y direction of bridge bents with piers diameters 1.2m, 1.6m, 1.8m, and 2m
|
Model of Bridge Piers |
Bent No. 1 |
Bent No. 2 |
||
|
Force |
Displacement |
Force |
Displacement |
|
|
D=1.2m |
6121.8 |
0.024 |
6108.5 |
0.024 |
|
D=1.6m |
10765.2 |
0.022 |
10746.8 |
0.022 |
|
D= 1.8m |
14639.4 |
0.027 |
14619.7 |
0.027 |
|
D=2m |
14422.7 |
0.024 |
14399.8 |
0.024 |
|
Model of Bridge Piers |
Bent No. 3 |
Bent No. 4 |
||
|
Force |
Displacement |
Force |
Displacement |
|
|
D=1.2m |
6108.5 |
0.024 |
6108.5 |
0.024 |
|
D=1.6m |
10746.5 |
0.022 |
10746.5 |
0.022 |
|
D= 1.8m |
14619.5 |
0.027 |
14619.5 |
0.027 |
|
D=2m |
14400.5 |
0.024 |
14400.6 |
0.024 |
|
Model of Bridge Piers |
Bent No. 5 |
Bent No. 6 |
||
|
Force |
Displacement |
Force |
Displacement |
|
|
D=1.2m |
6110.0 |
0.022 |
6121.6 |
0.024 |
|
D=1.6m |
10747.0 |
0.022 |
10763.0 |
0.022 |
|
D= 1.8m |
14619.9 |
0.027 |
14634.7 |
0.027 |
|
D=2m |
14401.3 |
0.024 |
14410.3 |
0.024303 |
Figure 13. Displacement yielding points in Y direction of bridge bents with piers diameters 1.2m, 1.6m, 1.8m, and 2m
Figure 14. Force yielding points in Y direction of bridge bents with piers diameters 1.2m, 1.6m, 1.8m, and 2m
Table 6. Force-displacement yielding points in X direction of bridge bents with piers diameters 1.2m, 1.6m, 1.8m, and 2m
|
Model of Bridge Piers |
Bent No. 1 |
Bent No. 2 |
||
|
Force |
Displacement |
Force |
Displacement |
|
|
D=1.2m |
2363.9 |
0.059 |
2352.4 |
0.059 |
|
D=1.6m |
4253.8 |
0.052 |
4239.4 |
0.052 |
|
D=1.8m |
5803.6 |
0.048 |
5788.1 |
0.048 |
|
D=2m |
5677.5 |
0.048 |
5661.3 |
0.048 |
|
Model of Bridge Piers |
Bent No. 3 |
Bent No. 4 |
||
|
Force |
Displacement |
Force |
Displacement |
|
|
D=1.2m |
2352.4 |
0.059 |
2352.4 |
0.059 |
|
D=1.6m |
4239.4 |
0.052 |
4239.4 |
0.052 |
|
D=1.8m |
5788.1 |
0.048 |
5788.1 |
0.048 |
|
D=2m |
5661.3 |
0.048 |
5661.3 |
0.048 |
|
Model of Bridge Piers |
Bent No. 5 |
Bent No. 6 |
||
|
Force |
Displacement |
Force |
Displacement |
|
|
D=1.2m |
2352.4 |
0.059 |
2349.1 |
0.059 |
|
D=1.6m |
4239.4 |
0.052 |
4239.6 |
0.052 |
|
D=1.8m |
5788.1 |
0.048 |
5789.5 |
0.048 |
|
D=2m |
5661.3 |
0.048 |
5664.8 |
0.048 |
Figure 15. Displacement yielding points in X direction of bridge bents with piers diameters 1.2m, 1.6m, 1.8m, and 2m
Figure 16. Force yielding points in X direction of bridge bents with piers diameters 1.2m, 1.6m, 1.8m, and 2m
(a) Force-displacement yielding point of bridge bent No. 1 with piers diameter 1.2m
(b) Force-displacement yielding point of bridge bent No. 1 with piers diameter 1.6m
(c) Force-displacement yielding point of bridge bent No. 1 with piers diameter 1.8m
(d) Force-displacement yielding point of bridge bent No. 1 with piers diameter 2m
Figure 17. Force-displacement yielding points in Y direction of bridge bent No. 1 with piers diameters 1.2m, 1.6m, 1.8m, and 2m
(a) Force-displacement yielding point of bridge bent No. 1 with piers diameter 1.2m
(b) Force-displacement yielding point of bridge bent No. 1 with piers diameter 1.6m
(c) Force-displacement yielding point of bridge bent No. 1 with piers diameter 1.8m
(d) Force-displacement yielding point of bridge bent No. 1 with piers diameter 2m
Figure 18. Force-displacement yielding points in X direction of bridge bent No. 1 with piers diameters 1.2m, 1.6m, 1.8m, and 2m
(a) Force-displacement yielding point of bridge bent No. 3 with piers diameter 1.2m
(b) Force-displacement yielding point of bridge bent No. 3 with piers diameter 1.6m
(c) Force-displacement yielding point of bridge bent No. 3 with piers diameter 1.8m
(d) Force-displacement yielding point of bridge bent No. 3 with piers diameter 2m
Figure 19. Force-displacement yielding points in Y direction of bridge bent No. 3 with piers diameters 1.2m, 1.6m, 1.8m, and 2m
(a) Force-displacement yielding point of bridge bent No. 3 with piers diameter 1.2m
(b) Force-displacement yielding point of bridge bent No. 3 with piers diameter 1.6m
(c) Force-displacement yielding point of bridge bent No. 3 with piers diameter 1.8m
(d) Force-displacement yielding point of bridge bent No. 3 with piers diameter 2m
Figure 20. Force-displacement yielding points in X direction of bridge bent No. 3 with piers diameters 1.2m, 1.6m, 1.8m, and 2m
5.2 Pushover analysis results of performance points
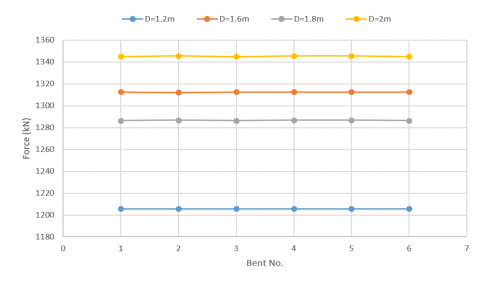
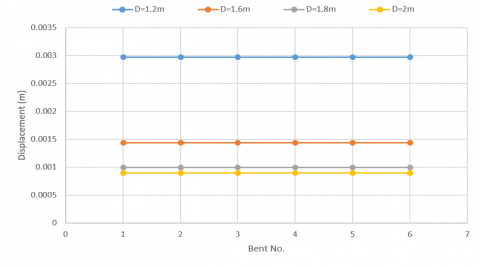
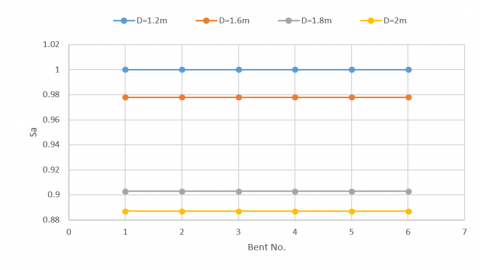
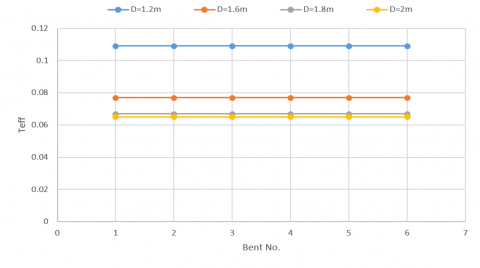
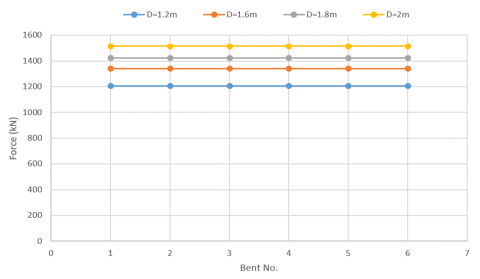
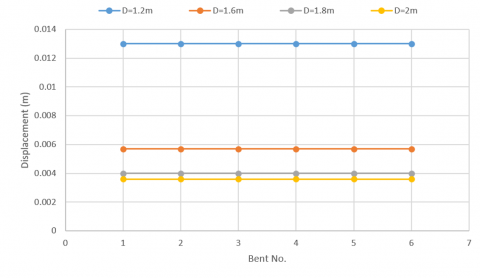
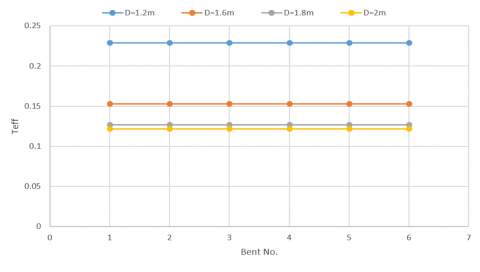
According to Table 7, Figure 21 to Figure 24, the performance points appear important results and the forces are increased and displacements are reduced with increasing of piers diameters in transverse direction. The force is increased from 1205.6kN to 1345.6kN for piers diameter model of 1.2m and 2m respectively. For displacement, the value is decreased from 0.00297m in piers diameter model of 1.2m to 0.0009m for piers diameter model of 2m. the Sa value is decreased from 1 in piers diameter model of 1.2m to 0.887 for piers diameter 2m. Teff values are reduced from 0.109 to 0.065 in piers diameter models of 1.2m and 2m respectively. For longitudinal direction of bridge structure, the force is increased from 1205.7kN to 1516.6kN, and displacement is reduced from 0.013m to 0.0036m, and Teff is reduced from 0.229 to 0.122 within piers diameter model of 1.2m and 2m respectively. It can be concluded that the preventing or reducing of earthquake action effect on the bridge structure by adopting thickening the piers size which will help to increase the bearing capacity and reducing the seismic displacement of bridge piers in transverse and longitudinal direction. Table 8, Figure 25, Figure 26, and Figure 27 show the performance point in X direction of bridge bent No. 3 with piers diameters 1.2m, 1.6m, 1.8m, and 2m.
Table 7. Bents performance points in transverse direction of bridge bents with piers diameters 1.2m, 1.6m, 1.8m, and 2m
|
Model of Bridge Piers |
Bent No. 1 |
Bent No. 2 |
||||
|
(V, D) |
(Sa, Sd) |
(Teff, Beff) |
(V, D) |
(Sa, Sd) |
(Teff, Beff) |
|
|
D=1.2m |
1205.6, 0.002 |
1, 0.002 |
0.109, 0.05 |
1205.6, 0.002 |
1, 0.002 |
0.109, 0.05 |
|
D=1.6m |
1312.6, 0.001 |
0.978, 0.001 |
0.077, 0.05 |
1312.3, 0.001 |
0. 97, 0.001 |
0.077, 0.05 |
|
D=1.8m |
1286.3, 0.001 |
0.903, 0.001 |
0.067, 0.05 |
1286.8, 0.001 |
0.90, 0.001 |
0.067, 0.05 |
|
D=2m |
1345, 0.0009 |
0.887, 0.0009 |
0.065, 0.05 |
1345.6, 0.0009 |
0.887, 0.0009 |
0.065, 0.05 |
|
Model of Bridge Piers |
Bent No. 3 |
Bent No. 4 |
||||
|
(V, D) |
(Sa, Sd) |
(Teff, Beff) |
(V, D) |
(Sa, Sd) |
(Teff, Beff) |
|
|
D=1.2m |
1205.6, 0.002 |
1, 0.002 |
0.109, 0.05 |
1205.60, 0.002 |
1, 0.002 |
0.109, 0.05 |
|
D=1.6m |
1312.6, 0.001 |
0.978, 0.001 |
0.077, 0.05 |
1312.6, 0.001 |
0.978, 0.001 |
0.077, 0.05 |
|
D=1.8m |
1286.3, 0.001 |
0.903, 0.001 |
0.067, 0.05 |
1286.3, 0.001 |
0.903, 0.001 |
0.067, 0.05 |
|
D=2m |
1345, 0.0009 |
0.887, 0.0009 |
0.065, 0.05 |
1345, 0.0009 |
0.887, 0.0009 |
0.065, 0.05 |
|
Model of Bridge Piers |
Bent No. 5 |
Bent No. 6 |
||||
|
(V, D) |
(Sa, Sd) |
(Teff, Beff) |
(V, D) |
(Sa, Sd) |
(Teff, Beff) |
|
|
D=1.2m |
1205.6, 0.002 |
1, 0.002 |
0.109, 0.05 |
1205.6, 0.002 |
1, 0.002 |
0.109, 0.05 |
|
D=1.6m |
1312.6, 0.001 |
0.978, 0.001 |
0.077, 0.05 |
1312.6, 0.001 |
0.978, 0.001 |
0.077, 0.05 |
|
D=1.8m |
1286.3, 0.001 |
0.903, 0.001 |
0.067, 0.05 |
1286.8, 0.001 |
0.903, 0.001 |
0.067, 0.05 |
|
D=2m |
1345, 0.0009 |
0.887, 0.0009 |
0.065, 0.05 |
1345.6, 0.00092 |
0.887, 0.0009 |
0.065, 0.05 |
Figure 21. Force-performance point in transverse direction of bridge bents with piers diameters 1.2m, 1.6m, 1.8m, and 2m
Figure 22. Displacement-performance point in transverse direction of bridge bents with piers diameters 1.2m, 1.6m, 1.8m, and 2m
Figure 23. Sa-performance point in transverse direction of bridge bents with piers diameters 1.2m, 1.6m, 1.8m, and 2m
Figure 24. Teff-performance point in transverse direction of bridge bents with piers diameters 1.2m, 1.6m, 1.8m, and 2m
Table 8. Bents performance points in longitudinal direction of bridge bent No. 3 with piers diameters 1.2m, 1.6m, 1.8m, and 2m
|
Model of Bridge Piers |
Bent No. 1 |
Bent No. 2 |
||||
|
(V, D) |
(Sa, Sd) |
(Teff, Beff) |
(V, D) |
(Sa, Sd) |
(Teff, Beff) |
|
|
D=1.2m |
1205.7, 0.013 |
1, 0.013 |
0.229, 0.05 |
1205.7, 0.013 |
1, 0.013 |
0.230, 0.05 |
|
D=1.6m |
1341.7, 0.005 |
1, 0.005 |
0.153, 0.05 |
1341.7, 0.005 |
1, 0.005 |
0.153, 0.05 |
|
D=1.8m |
1424.3, 0.004 |
1, 0.004 |
0.127, 0.005 |
1424.3, 0.004 |
1, 0.004 |
0.128, 0.005 |
|
D=2m |
1516.6, 0.003 |
1, 0.003 |
0.122, 0.05 |
1516.6, 0.003 |
1, 0.003 |
0.122, 0.05 |
|
Model of Bridge Piers |
Bent No. 3 |
Bent No. 4 |
||||
|
(V, D) |
(Sa, Sd) |
(Teff, Beff) |
(V, D) |
(Sa, Sd) |
(Teff, Beff) |
|
|
D=1.2m |
1205.7, 0.013 |
1, 0.0130 |
0.229, 0.05 |
1205.77, 0.0130 |
1, 0.013 |
0.229, 0.05 |
|
D=1.6m |
1341.7, 0.005 |
1, 0.0057 |
0.153, 0.05 |
1341.7, 0.005 |
1, 0.005 |
0.153, 0.05 |
|
D=1.8m |
1424.3, 0.004 |
1, 0.004 |
0.127, 0.005 |
1424.3, 0.004 |
1, 0.004 |
0.127, 0.005 |
|
D=2m |
1516.6, 0.003 |
1, 0.003 |
0.122, 0.05 |
1516.6, 0.003 |
1, 0.003 |
0.122, 0.05 |
|
Model of Bridge Piers |
Bent No. 5 |
Bent No. 6 |
||||
|
(V, D) |
(Sa, Sd) |
(Teff, Beff) |
(V, D) |
(Sa, Sd) |
(Teff, Beff) |
|
|
D=1.2m |
1205.7, 0.013 |
1, 0.013 |
0.229, 0.05 |
1205.7, 0.013 |
1, 0.01 |
0.230, 0.05 |
|
D=1.6m |
1341.7, 0.005 |
1, 0.005 |
0.153, 0.05 |
1341.7, 0.005 |
1, 0.005 |
0.153, 0.05 |
|
D=1.8m |
1424.3, 0.004 |
1, 0.004 |
0.127, 0.005 |
1424.3, 0.004 |
1, 0.004 |
0.128, 0.005 |
|
D=2m |
1516.6, 0.003 |
1, 0.003 |
0.122, 0.05 |
1516.6, 0.003 |
1, 0.003 |
0.122, 0.05 |
Figure 25. Force-performance point in longitudinal direction of bridge bents with piers diameters 1.2m, 1.6m, 1.8m, and 2m
Figure 26. Displacement-performance point in longitudinal direction of bridge bents with piers diameters 1.2m, 1.6m, 1.8m, and 2m
Figure 27. Teff-performance point in longitudinal direction of bridge bents with piers diameters 1.2m, 1.6m, 1.8m, and 2m
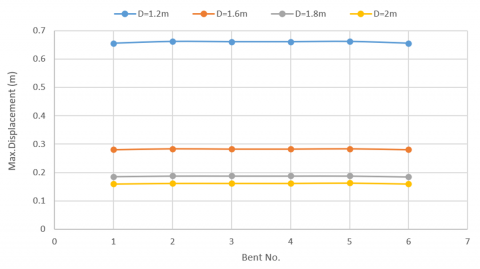
5.3 Maximum seismic displacement of bents piers D 1.2m, 1.6m, 1.8m, and 2m
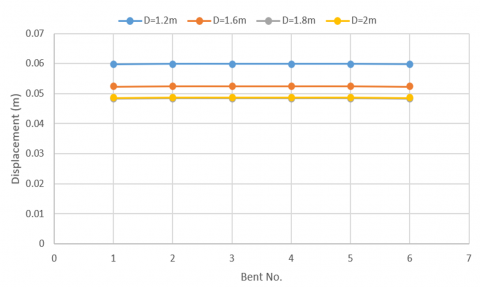
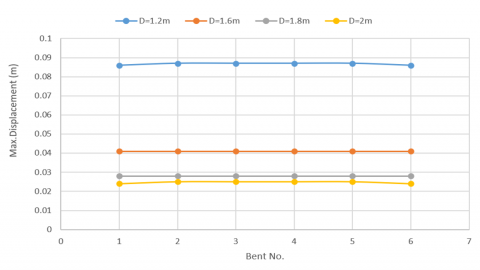
The results of maximum seismic displacement in the transverse and longitudinal direction show that the values of seismic displacement are reduced with increasing the diameter of bridge piers. Figure 28 and Figure 29 illustrates the magnitudes of maximum seismic displacement of bridge piers under effect of earthquake action in the transverse and longitudinal direction of bridge structure. It can be reported that the seismic displacement in transverse direction is decreased from 0.087m to 0.025m in model of piers diameter 1,2m and 2m respectively. But for longitudinal direction the magnitudes are lowered from 0.662m to 0.160m, indication that the thickening of bridge piers has significant effect on the increasing the resistance of earthquake action for bridge bents in transverse and longitudinal direction.
Figure 28. Maximum seismic displacement of bridge bents in transvers direction
Figure 29. Maximum seismic displacement of bridge bents in longitudinal direction
Conclusions of this study are:
The results of yielding points and performance points values of yielding points were increased with increasing the piers diameter. And the seismic displacement decreased with increasing the piers diameter. Indicating that the elastic limit of bridge bents will increase and the bridge piers will resist the earthquake action according to increase in the stiffness and bearing capacity of bridge bents.
[1] Tu, K., Ye, Y., Wu, D., Zhou, Y., Deng, W. (2023). Technical analysis of highway bridge static load test. Journal of Architectural Research and Development, 7(3): 58-63.
[2] Ajaya, S., Binaya, A., Ashish, P., Binod, K., Samrat, P., Sanjog, C. (2024). Influence of cross‑girder spacing on RC T‑beam bridges: A comparative theoretical and finite element approach. Discover Civil Engineering, 1(126): 1-26. https://doi.org/10.1007/s44290-024-00126-3
[3] Ali, F.N., Wang, Z. (2013). Finite element and experimental analysis and evaluation of static and dynamic responses of oblique pre-stressed concrete box girder bridge. Research Journal of Applied Sciences, Engineering and Technology, 19: 3642-3657. https://doi.org/10.19026/rjaset.6.3572
[4] Hemalatha, K., James, C., Natrayan, L., Swamynadh, V. (2020). Analysis of RCC T-beam and prestressed concrete box girder bridges super structure under different span conditions. Materials Today Proceedings, 37: 1507-1516. https://doi.org/10.1016/j.matpr.2020.07.119
[5] Hussam, A., Ali, F. (2020). Mathematical assessment of vehicle types and loads influences on the structural performance parameters of concrete and steel bridges. Journal of Engineering Science and Technology (JESTEC), 15(2): 1254-1266.
[6] Yadav, R., Sah, B.K., Yadav, I.N., Gupta, D.K. (2019). Comparative study of T beam bridge with conventional method and finite element analysis. Journal of the Institute of Engineering, 15(1): 62-70. https://doi.org/10.3126/jie.v15i1.27706
[7] Ali, F. (2021). Analysis the effect of super-elevation on static and dynamic properties of horizontal curved concrete bridge by finite element. Journal of Engineering Science and Technology, 16(5): 3669-3686.
[8] Barker, R.M., Puckett, J.A. (2013). Design of highway bridges: An LRFD approach. Third Edition. John Wiley and Sons. https://doi.org/10.1002/9780470121443
[9] Naser, A.F. (2018). Optimum design of vertical steel tendons profile layout of post-tensioning concrete bridges: Fem static analysis. ARPN Journal of Engineering and Applied Sciences, 13(23): 9244-9256.
[10] Ali, F.N., Wang, Z. (2011). Damage investigation, strengthening, and repair of Jilin highway double-curved arch concrete bridge in China. Procedia Engineering, 14: 2294-2300. https://doi.org/10.1016/j.proeng.2011.07.289.
[11] Khudair, A.W., Naser, A.F., Aldhalemi, A.A., Mahmood, H.F. (2025). Damages inspection and finite element model analysis of static and dynamic factors of steel girder-concrete composite span due to vehicles live load and loads combination. International Journal of Transport Development and Integration, 9(1): 151-162. https://doi.org/10.18280/ijtdi.090114
[12] Naser, A.F., Mohammed, H.A., Mohammed, A.A. (2022). Flexure and shear load rating evaluation of composite bridge superstructure under effect of different trucks load types. Materials Today: Proceedings, 57: 398-407. https://doi.org/10.1016/j.matpr.2021.12.268
[13] Assad, S.A., Morcous, G. (2015). Evaluating the impact of bridge-deck removal on the performance of precast/prestressed concrete I-girders. Journal of Performance of Constructed Facilities, 30(3): 04015032. https://doi.org/10.1061/(ASCE)CF.1943-5509.0000769
[14] Lu, T., Zheng, X., Chen, J., Yang, Y., Li, Y. (2024). Experimental study on the bending performance of a precast, pretensioned high-strength concrete I girder with pretensioned double broken strands. Research Square. https://doi.org/10.21203/rs.3.rs-4230961/v1
[15] Shobhit, G., Sandeep, G. (2021). Seismic effects on different structural members. International Journal for Research in Applied Science & Engineering Technology, 9(VII): 1481- 1485. http://dx.doi.org/10.22214/ijraset.2021.36589
[16] Siqueira, G.H., Tavares, D.H., Paultre, P., Padgett, J.E. (2014). Performance evaluation of natural rubber seismic isolators as a retrofit measure for typical multi-span concrete bridges in eastern Canada. Engineering Structures, 74: 300-310. https://doi.org/10.1016/j.engstruct.2014.03.009
[17] Caltrans. (1999). Guidelines for generation of response-spectrum-compatible rock motion time history for application to Caltrans toll bridge Seismic retrofit projects. Caltrans Seismic Advisory Board, California Department of Transportation, Sacramento, CA.
[18] Manaf, A. (2000). Defining standard of periodic bridge maintenance activities in Iraq by adopting expert system technology. A Thesis of Master of Sciences, Civil Engineering department, University of Technology. Iraq.
[19] Ali, F.N., Wang, Z. (2011). Damage monitoring and field analysis of dynamic responses of Ha Shuang Prestressed concrete box girder oblique bridge before strengthening. Advanced Materials Research, 255-260: 1102-1106. https://doi.org/10.4028/www.scientific.net/AMR.255-260.1102
[20] Bianchi, E.L., Sakib, N., Woolsey, C., Hebdon, M. (2023). Bridge inspection component registration for damage evolution. Structural Health Monitoring, 22(1): 472-495. https://doi.org/10.1177/14759217221083647
[21] Ali, F.N., Wang, Z. (2011). Field investigation of damages and performance evaluation of Longtan truss-arch concrete bridge in China, Procedia Engineering, 14: 2323-2332. https://doi.org/10.1016/j.proeng.2011.07.293
[22] Anđelko, V., Mladen, S., Dominik, S., Ana, M. (2022). Post-earthquake rapid damage assessment of road bridges in Glina county. Buildings, 12(1): 42. https://doi.org/10.3390/buildings12010042
[23] Ali, F., Wang, Z. (2011). Damage inspection and performance evaluation of Jilin highway double-curved arch concrete bridge in China. Structural Engineering and Mechanics, 39(4): 521-539.
[24] O'Connor, J.S., Alampalli, S. (2024). A plan for assessing the damage to highway bridges after an earthquake. In Bridge Maintenance, Safety, Management, Digitalization and Sustainability, pp. 3329-3336. https://doi.org/10.1201/9781003483755-394
[25] Naser, A.F., Wang, Z.L. (2011). Field damage inspection and static load test analysis of Jiamusi highway prestressed concrete bridge in China. Advanced Materials Research, 163: 1147-1156. https://doi.org/10.4028/www.scientific.net/AMR.163-167.1147
[26] Williams, M.S., Sexsmith, R.G. (1997). Seismic assessment of concrete bridges using inelastic damage analysis, Engineering Structures, 19(3): 208-216. https://doi.org/10.1016/S0141-0296(96)00104-6
[27] Naser, A.F., Wang, Z.L. (2010). Strengthening of Jiamusi prestressed concrete highway bridge by using external posttensioning technology in China. ARPN Journal of Engineering and Applied Sciences, 5(11): 60-69.
[28] Hai, L., Wei, L., Daved, J., Ai, H. (2009). Strengthening an in-service concrete with CFRP bars. Journal of Zhejiang University SCIENCE A, 10(5): 635-644.
[29] Naser, A.F., Wang, Z. (2012). Experimental monitoring of the strengthening construction of a segmental box girder bridge and field testing of external prestressing tendons anchorage. Frontiers of Structural and Civil Engineering, 6: 308-320. https://doi.org/10.1007/s11709-012-0140-3
[30] Das, S.S., Das, J.C., Rahman, M.S. (2024). Dynamic analysis of pre-stressed concrete girder bridge using csibridge software. Research Square. https://doi.org/10.21203/rs.3.rs-4213823/v1
[31] Ramdani, M.A., Widiya, N.P., Susanto, A., Astor, Y. (2020). Design of the prestressed concrete bridge structure on the Leuwigajah bridge. In International Seminar of Science and Applied Technology (ISSAT 2020), pp. 149-156. https://doi.org/10.2991/aer.k.201221.026
[32] Aghagholizadeh, M., Catbas, N. (2019). Comparative analysis and evaluation of two prestressed girder bridges. Current Trends in Civil & Structural Engineering, 3(5): 1-9. https://doi.org/10.33552/CTCSE.2019.03.000572
[33] Leslie, R. (2013). The pushover analysis, explained in its simplicity. Proceedings of 2nd National Conference – RACE’13 at SAINTGITS College of Engineering, Kottayam, pp. 1-15.
[34] CSI Bridge. (2024). Bridge Analysis, Design and Rating, Computers and Structures Inc., Berkeley, CA, USA. https://www.csiamerica.com/products/csibridge.
[35] Themelis, S. (2008). Pushover analysis for seismic assessment and design of structures. Doctoral dissertation, Heriot-Watt University.
[36] Jaaz, H.A.G., Naser, A.F., Mohammed, H.A., Mohammed, A.A. (2021). Earthquake resistance optimization and evaluation of bridge piers structural form and dimensions based on demand to capacity ratio and yielding points of force-displacement. Mathematical Modelling of Engineering Problems, 8(6): 945-954. https://doi.org/10.18280/mmep.080614
[37] Naser, A., Mohammed, H.A., Mohammed, A.A. (2021). Seismic design assessment of bridge piers location effect on the structural capacity of supports under earthquake action. International Journal of Safety and Security Engineering, 11(2): 143-153. https://doi.org/10.18280/ijsse.110203
[38] Swathi, S., Venkataramana, K., Rajasekaran, C. (2018). Evaluation of performance point of structure using capacity spectrum method. Applied Mechanics and Materials, 877: 299-304. https://doi.org/10.4028/www.scientific.net/AMM.877.299