Hayder Mohammed Mnati*![]() | Ahmed Hashim Kareem
| Ahmed Hashim Kareem![]() | Hasan Shakir Majdi
| Hasan Shakir Majdi![]() | Laith Jaafer Habeeb
| Laith Jaafer Habeeb![]() | Abdulghafor Mohammed Hashim
| Abdulghafor Mohammed Hashim![]()
© 2025 The authors. This article is published by IIETA and is licensed under the CC BY 4.0 license (http://creativecommons.org/licenses/by/4.0/).
OPEN ACCESS
SolidWorks used an optimization approach from the authors to strengthen the structural quality of edge weld designs. The current standard approaches for edge weld analysis evaluation remain insufficiently developed which causes limitations to the functionality of SolidWorks simulation software. A modern weldment analysis procedure stands as the selected research method to predict outcomes across various conditions through weld parameter definition. The SolidWorks simulation model provides an advanced method to construct 3D frame structures with edge-welding through precise weld specifications and effective boundary definition. Standard welding processes together with analytical methods affect outcome precision because weld measurements showed differences from projected values. The design process will split weld component inspections into two separate outcomes which will distinguish between passable dimensions and those that need additional evaluation. The scientific research confirms that all structures require weld modifications whenever external forces surpass either 2000 N or 3000 N during analysis. Results show that maximum stability requires either robust welds or reduced safety procedures or better welding electrodes according to the research data. Engineers leverage this simulated platform as it helps evaluate welded structure loading patterns to improve their live design work. Virtual data processing together with actual application parameters allows engineers to build precise weld designs producing better responses predictions for modern welded frameworks in operational environments.
weld simulation optimization, SolidWorks weld analysis, weld size estimation techniques, safety factor in weld joints, welding electrode effects
Weld design processes are complex due to service-related welds behavioral responses that depend on applied loads. Current analytical methods, such as empirical expressions and finite element analysis (FEA), fail to meet practical needs due to quality assessment separation from analytical procedures. Standard design codes use engineering equations to calculate basic weld dimensions, but these do not account for actual material effects, production defects, or weld defects in field operations. Weld dimension predictions from FEA simulation become inaccurate when weld quality information is missing, undermining design performance under load conditions. Traditional prediction methods yield inadequate results when evaluating welded joints loaded by various forces under challenging environmental conditions. SOLIDWORKS simulation tools offer workflow that enhances weld dimensions and system versatility, providing real-time capability to modify weld parameters and predict performance outcomes. This method offers superior outcomes than conventional techniques, including immediate load-based testing and adaptable weld quality parameters.
Interactions between the various subassemblies are important in the structures and they define the nature of the resultant composite structure as regards stiffness and energy absorption capability. Today many connection techniques used in engineering structures are Welds, bolts, screws, rivets, clinching, etc. Thus, the benefits of these connections comprise: quick installation and ease in surface preparation, reliable modeling of the failure of joints, ease of inspection and handling, precise machining and short cycle time that can be taken for assembly and joining [1]. Welded structures cannot be overestimated today’s industry, thus more attention should be paid to the analysis and design of such structures. Such connections can be applied in various fields; automotive ones, aerospace industries, constructions, and other areas. Whereby by welding one is able to manufacture numerous applications from the large variety of materials because the materials have very desirable properties [2-4]. To briefly explain, edge welds are of high importance in improving the toughness and acceptance of the weld structures [5]. An advantage brought about by the new additions to the Solidworks if the capability to facilitate control and evaluation of the edge weld design. This is the actual truth but a great deal of detailed and coherent approach is needed to optimize its utilizations for real world. Since welding is one of the elementary procedures in manufacturing, it is reasonable to verify and enhance edge weld designs to achieving a better product. To help engineers and designers to address a range of issues in the weldment analysis tools are available in the Solidworks. An essential understanding of weldment analysis for edge weld design in the Solidworks software tool is deemed relevant. In this analysis, a new simulation approach is presented with focus on the use of Solidworks and important recommendations for real applications is provided. It is required in order to assist engineers and designers to arrive at the correct decision and to enable a swift selection and implementation of the most effective edge weld designs. In this work, the effects of parameters clustered under material properties, welding process and constraints on the applicability of Solidworks weldment analysis data are described.
The really big plus is that one can then do CAD modeling and simulation in a manner where CAD modeling of the structure does not end at the design of the structure and assessment of the weld’s performance can also begin here. This integration decreases the time and effort, usually required in the conventional modeling and simulation process, into a more optimized approach for the engineers involved. This approach is a much more realistic model the real-world conditions, and it will be more helpful to the welding industry and structural applications. This leads to better predictability A feedback mechanism enables the engineers to alter the size of the weld as well as the safety factor in a real-time basis leading to improved design of the final welds. It also fosters planning and existence control where possible problem areas, for instance over detailing of the welds, which may cause extensive consumption of materials or weld quality impacts can be identified at an early stage. It is a more dynamic approach in comparison to static design rules and guidelines accuracy for weld performance and durability and hence minimizes the failures in actual use of the product. Thus, by including this flexibility, the research gives the possibility to achieve the right weld size while maintaining structural stability. This is possible while containing the material costs besides minimizing the time spent welding in assurance of the welder meeting the safety and strength requirements. This approach renders the methodology versatile dependent on the design situations and materiality of the structure to be developed.
Discussing specific simulation methodology required an important review of research on analyzing and optimizing weldments using various approaches. In a recent work, which the authors had conducted, they had searched the literature to identify some of the key causes of weld failure and to compare various experimental and simulation methods aimed at enhancing weld design. SYSWELD was applied by Shanmugam et al. [6] for the determination of thermal distribution as well as weld bead geometry in laser welding of AISI304 T-joint stainless steel. Their experiment was to compare the effect of the temperature sensitive material characteristics on bead profiling. The experiments validated the simulation results and investigated how variations of the laser parameters impacted the weld quality along with the bead profile. This was confirmed form the experimental work whereby very close values were obtained from the results produced from the simulation method used. The welding technique used in this study is oscillating single-mode laser-GMA hybrid welding, according to the work done on it by Gao et al. [7]. It combines a laser with a conventional pulsed Gas Metal Arc (GMA) welding for the welding of ultra-high-strength steel structures which are popular for automotive applications. In this context, computational mathematical models and simulation were used to study heat spreading or conducting, change of temperature or flow of fluid through the time welded. Welding exercises are essential in the cultivation of welding efficiency and assurance of good welding. Furthermore, the researchers also carried out a set of experiments to support the stated conclusion. The study suggests that including laser to the equation improves the weld’s ability to survive high velocities, which cannot be attained with GMA welding alone. The heat transfer and dispensation mechanism into the laser tissue welding was also studied elaborately by Li et al. [8]. This they were able to achieve by creating a skin model that has two skin layers. As per the principles of bioheat transfer, the researchers used a twolayer structural model. The researchers used something they refer to as ‘simulations’ to investigate the impact of changing the size of the laser spot on the temperature of a model. These were the maximum temperature attained, the temperature distribution in the model problem, and time. Besides, they conducted a study to ensure the validity of the proposed model was correct. As such, this study was able to establish that in laser skin welding, size of the laser spot influences the scattering of heat and thermal destruction. This was corroborated by the validated model and it was recommended that a spot size of 0.2mm provided uniform penetration to the full skin depth with good welds and restricted scarification. Conversely, using small spot sizes was associated with increased peak temperature and may cause thermal injury while enlarging the size of the spots resulted in partial occlusion.
Choudhary and Jain [9] tried to study the effects of two parameters, high temperature and axial force applied on the formation of the flaws in FSW process. The researchers Eulerian – Lagrangian approaches were applied to simulate the welding process as was depicted in the results section. This model reproduces fluidic behavior of furnishings inside the welding area and examines individual granule movements to assess the material flow and failure. The study that considers axial force, weld flash, as well as the defect formation detected that it can confirm the model. This enabled an integration of a holistic analytical model that articulates the relationship between the other process variables and the frequency of faults and the quality of welds. In the experiment, it was established that the maximum temperature and the axial force had a high influence on the quality individuum of the weld. In that way possible averts the degree of imperfection, and obtains a better weld than using average values. The work of Kumar Choudhary and Jain [10] was carried out to establish how the defect size impacts on the strength of the friction stir welding. In order to reduce such vagueness and to ensure that the sizes of the defects bear a direct proportion to the efficiency of the welds, the investigators adopted both computational and experimental techniques. In the aforementioned investigations will incorporate a thermomechanical model which will use a combined Eulerian-Lagrangian approach and the current analysis will provide an insight into the possibility of faults in FSW. To ensure that the simulation result of the researchers fully reflects the real development, a comparative study using actual data of material flow visualization, mechanical testing and microstructure characterization were conducted. Moreover, they suggested the defect volume measure which defines the size of defects applying the Eulerian volume fraction in the weld zone. Their argument was that they discovered that the volumes on defects were actually larger. Leading to a consequent lowering in weld strength. The researchers use factors, and they have developed an ideal model that provides the best method of assessing the efficiency of a welds through calculating volume of defect and process characteristics.
In another recent study, Pradhan et al. [11] analyzed the prediction of morphologies of weld beads of shielded gas metal arc welded fillet joints. The estimates of these parameters were developed with statistical design techniques and an artificial neural network model. This work presented some experiments on mild steel plates of various thickness in order to understand the effects of welding voltage, welding current, and the velocity of the moving heat source on low-carbon steel. To achieve these goals, the researchers focused on developing alternative numerical simulations for welding with an effort of enhancing quality control of welded structures. Their study demonstrated a powerful artificial neural network model could be used to predict the morphological characteristics of weld beads in fillet joints of MAG-Welding based on accurate welding parameters. In addition, the validation of the result also revealed high accuracy of Artificial Neural Network (ANN) model on the plausible temperature distribution of welds and was in good agreement with experimental result. Chaurasia et al. [12] investigated on the behavior of MIG welding process applied to the aluminium 6101 plate. Their goal was to establish formulas which would help to define how the factors influencing welding (voltage, wire feed rate, weld speed, angle at which the torch is placed, and the distance between nozzle and the plate) connect to the features of the weld bead profile (reinforcing height, bead width, and depth of penetration). The task which was involved in the course of these studies, entailed the systematic alteration of these variables and the use of statistical models. The researchers of the work ensured the credibility of the developed models by conducting some statistical tests and pointed out that any shift in the welding conditions had assessable impacts on the end characteristics of the weld. Nam and Ki [13] proposed a deep-learning algorithm from which an estimation of the size of the upper and lower beads in laser welding process of AL 1050P-H16 was achieved. The system integrates the VoVNet27-slim structure and is trained on weld pool images opted from a small optical camera. The objective is to model the welding process and estimate the profile of the weld bead directly. The study also evaluates the prediction precision if one or two weld pool photographs serve as inputs. The aim is to analyze and estimate the quality of welding in real-time continuously, making it easier to compare the results with future welds and identify problems during laser welding. The authors of the study discovered that replacing one photograph with two enhanced the system’s efficacy in gauging the width of the bottom bead that is more volatile and less discernibly different than the top bead. Rao [14] also explored the topic of form of weld beads in Robotic gas metal arc welding for AM, its tracking as well as the prediction. The idea was to have a system for observing the metallic deposition process in real time and the information very useful in the research as well as the manufacturing process of such parts. For the variation and the trend of the vertical dimensions of the welded metal layers the study made use of the GM of the first order. Overall, the above studies showed that the Grey model could provide adequate evaluation for predicting, in advance, both the height and width of weld beads in the robotic GMAW based AM. This enables the system to be able to estimate the measurements that are incorporated in a new metal layer that is introduced in the process. Inspired by deep learning techniques, Cai et al. [15] put forward a special algorithm addressing the weld bead segmentation and measurements of the defects. For the purposes of weld quality assessment during the actual production, the state of art computations was employed. The goal is to accurately assess the quality of welds by providing precise dimensional information and precise location details for both welds and defects. The study found that this technique effectively automates the assessment of welding quality by accurately detecting welding seams and defects. Their methodology consistently displays a strong ability to accurately identify welding seams and distinguish various defects, improving the quality and efficiency of welding-related manufacturing processes.
The papers indicate a lack of a standard method of using SolidWorks simulation tools to maximize edge welds. Although several investigations have been dedicated to weld optimization, there is no standard approach that merges simulation-based analysis together with conventional engineering applications. Although many design and engineering companies use SolidWorks, the literature reveals that only some of its potential for weld size optimization has been explored. Some studies may employ one of the available general-purpose simulations but ignore the potential concurrent use of SolidWorks weldment analysis features. Prior work often uses empirical equations, design codes, or FEA without accounting for weld quality fully and the consequences it has on the structural response under actual loading conditions. Currently, there is no agreed solution to the predictability of weld joint quality using simulation tools and hence uncertainty with weld size estimations. Safety factors are important considerations in weld design; however, few current approaches effectively quantify the effects of changes in safety factors on the weld size and performance of the joint. In some cases, safety factors are chosen randomly, and their impact on the weld optimization is unanalyzed. Most of the models used in weld size optimization studies assume that all the parameters affecting the weld size are constant while, in a real environment, they are far from constant. These idealized models are unable to give a practical representation of the behavior of welds under conditions that are prevailing.
SolidWorks simulation tool advancements have failed to develop a consistent method for both assessment and improvement of edge welds. Weld design processes and dimensions become sub-optimal when existing methods employ simulated outcome disregards combined with practical usage limits. Current studies provide insufficient data to forecast how edge welds will perform under different external conditions while laboratories remain unable to determine vital material properties which affect structural strength. The research develops an extensive simulation system to measure weld dimensions correctly and locates problematic design areas for improved engineering structural weld reinforcement strategies. Engineers gain access to an accurate data-based selection system through this methodology which bridges the knowledge gap between simulated operation requirements and real welding demands.
3.1 3D modeling and material selection
The research utilized alloy steel instead of carbon steel for weld simulation success and operational reliability of welded structures. Alloy steel is essential for automotive manufacturing, aerospace frameworks, and construction works due to its exceptional strength against high mechanical stress. Its welding performance remains excellent, and external forces applied to steel alloy materials with weld connection points lead to no change in their original properties before welding. Alloy steels also demonstrate superior corrosion protection, especially when used in harsh conditions. Manufacturers in the aerospace and automotive industries require protective measures for their weld joints at chemical interfaces and extreme moisture and temperature conditions. Alloy steel relies on its corrosion resistance properties to protect welded joints from structural damage under harsh operational conditions. Its comprehensive functional capabilities make it suitable for various industries, including those that need resistance to wear and protection against heat and enduring cycles. Alloy steel is the most economical option due to advantageous purchasing conditions that lower production costs. Engineering practice and simulation analysis achieve maximum benefits when using alloy steel as the core material. The choice of alloy steel proved superior to carbon steel despite potential suitability, as it maintains a balance between strength and weldability and shows increased durability.
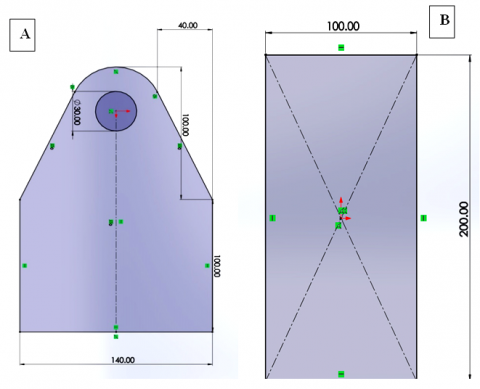
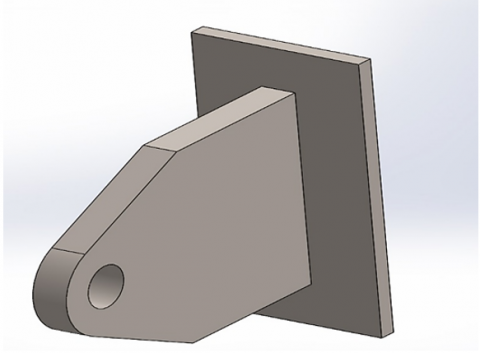
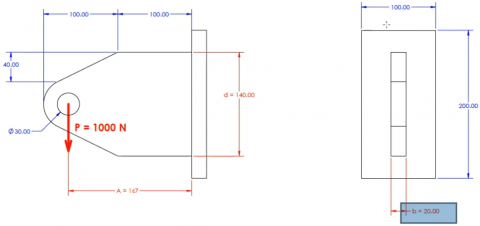
A design bracket structure is generated for this study utilizing SolidWorks Premium Edition, a certified Computer-Aided Design (CAD) software, resulting in a 3D model. Figure 1 displays the standard measurements for a materials or components transporter, which is the focus of this case study. The transporter's frame is joined together using welding techniques. The ultimate configuration of the bipartite assembly model in SolidWorks is depicted in Figure 2. The simulation model selected material mechanical and physical properties input to the Solidworks by adding these data to the program materials database and after that selected it during the simulation process for both parts of the model. The weld electrode type and standards specified according to the alloy steel AWS welding procedures recommendations.
Figure 1. 2D Solidworks model dimensions
Figure 2. 3D Solidworks model assembly
Figure 3. Welding simulation flow chart process for the study
After the 3D model designs are finished and assembled to the final geometry, the simulation process starts with static simulation mode in SOLIDWORKS software. Welding joint simulation and testing with the actual design criteria are critical and require specific sequencing to ensure high-quality and accurate results. The flow chart in Figure 3 explains this research simulation steps and their logical sequence during the study.
3.2 Models' materials properties
The analysis employed alloy steel material for the geometry design; the selection of alloy steel, in preference to other steel types, presents numerous benefits. These include compatibility with solid-state welding techniques, superior strength, enhanced workability, good corrosion resistance in regular working conditions, and broad utility across the automotive and shipping industries. Constituting Mn and Si, this alloy has commendable welding attributes and distinguished mechanical properties [16]. The designed model's materials are very important in welding joint simulation because they will determine the deformation, stress, and strain in weldment, the safety factor, and the type of welding electrode used during welding. Table 1 [17] illustrates the composition of alloy steel, and one of its key advantages is its capacity to endure heat treatment. Table 2 [18] presents the numerical values for the material's mechanical properties.
Table 1. Alloy steel chemical composition
|
Elements |
Wt % |
|
Al |
0.3 |
|
Cr |
0.5 |
|
Co |
0.3 |
|
Cu |
0.4 |
|
Pb |
0.1 |
|
Mn |
2 |
|
Mo |
0.1 |
|
Ni |
0.5 |
|
Si |
2 |
|
S |
0.2 |
|
W |
0.3 |
|
V |
0.1 |
Table 2. Alloy steel mechanical and physical properties
|
Properties |
Units |
|
Density |
7850 Kg/m3 |
|
Melting point |
1427℃ |
|
Tensile strength |
745 MPa |
|
Yield strength |
470 MPa |
|
Bulk modulus |
140 GPa |
|
Shear modulus |
80 GPa |
|
Elastic modulus |
190-210 GPa |
3.3 Models' shell generation
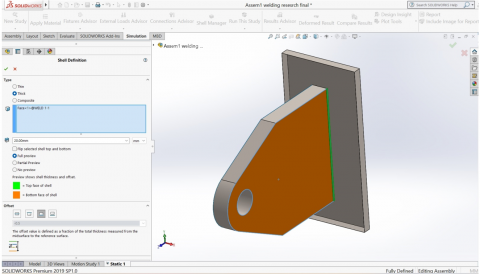
To simulate the fillet welding joint and display the results with an accurate outlet, the first step after applying the material type to the design model is the creation of shells from the fillet joint two faces. The shell generated by defining it from the selected face represented the contact face of the fillet joint. The shell is defined as a thick shell, and its thickness will be the same as the model geometry base metal; the distance between the newly generated shell and its selected face must be zero by specifying the offset parameter. The method of defining the two shells and their parameters is illustrated in Figures 4 and 5.
Figure 4. Shell definition, selected face, and parameters for the first part
Figure 5. Shell definition, selected face, and parameters for the second part
Figure 6. Edge weld fillet setup parameters
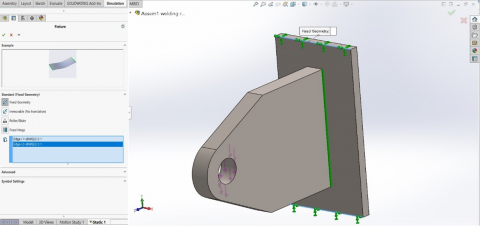
3.4 Fillet joint weld edges selection
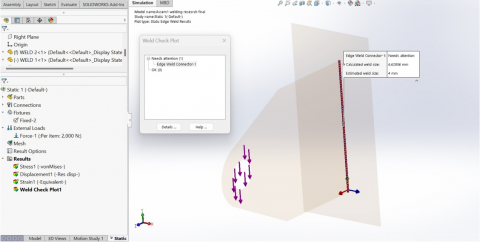
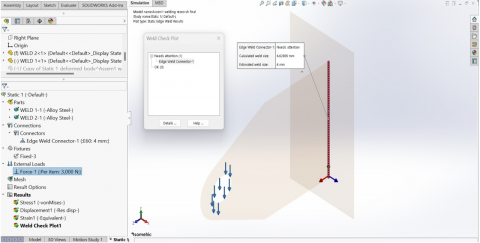
The specified fillet weld locations are determined by changing the connection type between the two design model intersection points to edge weld type. When choosing the double fillet and the two surfaces to be welded with the fillet joint, the welding joint will automatically highlight the edge between them, representing the fillet weld direction and location. The welding electrodes used in this study were E6010 and E7010, with 2 and 3 safety factors and 4 mm weld bead size according to the American code. The steps are well illustrated in Figure 6. The steps are repeated for other weld locations.
3.5 Simulation process boundary condition
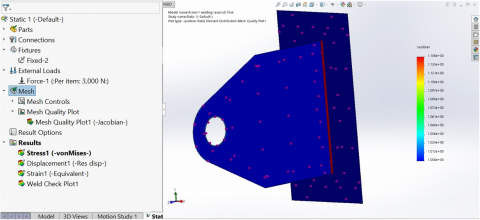
Before meshing, it is crucial to implement boundary conditions in the structural and weld analysis process. The joint structure consists of interconnected substructures modeled as elastic bodies to represent the structural load in real-world situations accurately. A distributed mass is selected using an external load to simulate the external load. This mass is then equally applied to certain regions of the structure, as shown in Figure 7 (A). The applied weight is 3000 Newtons as measured in metric units. To limit the range of motion for all surfaces, the fixture supports both the top and bottom of the bracket base construction. The two fixture sites should be positioned at the created shells, as seen in Figure 7 (B). Following these procedures during the analytical process is essential to determine the external load and achieve precise results. The location of the external load simulates the force resulting from the tensile weight held by the bracket.
Table 3. Alloy steel shells meshing data
|
Mesh type |
Shell mesh |
|
Meshing way |
Standard |
|
Jacobian check |
On |
|
Max. element size |
2.58 |
|
Min. element size |
0.12 |
|
Mesh quality |
High |
|
Total nodes |
174613 |
|
Total elements |
86762 |
3.6 Simulation process boundary condition
After assigning components, a mesh was created using a process incorporating a grid or density between each material component. This process aims to enhance the accuracy of the component's geometry in the simulation. A higher mesh value results in a more precise rendering of the part's shape. Within the mathematical framework, the process of generating a grid or mesh is referred to as discretization [19]. Within 3D mechanical design software, a particular meshing approach is utilized to allow for the accurate input of mesh density parameters. The grid consists of equilateral triangles. The maximum element size is 2.58 mm, and the minimum element size is 0.12 mm as depicted in Figure 8. The total node number was 174613 and the total element number was 86762. Regarding the simulation's context, using a Blended Curvature-Based Mesh type is preferable due to its efficiency for all 14 faces in the simulation model. This specific mesh type distinguishes itself from other options due to its optimized code architecture, multithreading capacity, and concurrent multicore processing capabilities. These characteristics allow the Mesher to significantly speed up the process of creating meshes for individual parts and bigger assemblies [20, 21]. The Shell Mesh utilizing Surfaces type is employed, with the corresponding values specified in Table 3, the final shell surface, and Jacobian test results illustrated in Figure 8. The precision of the mesh will be contingent upon the sizes of the elements and the quantity of nodes.
A mesh sensitivity analysis helped to validate the reliability and achievement of convergence within the simulation results. The research checked how different mesh density levels impacted vital simulation results about weld dimension measurements together with stress patterns and safety margin determinations. Three mesh densities were evaluated:
From the above Table 4, the calculations for weld size and stress reached convergence at medium mesh density since additional refinement resulted in insignificant variation less than 0.5%. Numerical simulations become more time-consuming when mesh becomes finer even though it fails to generate proportionally better data outcomes. The medium mesh setting finds an excellent middle ground which achieves precise results while using minimum computational resources.
3.7 Fillet joint weld check plot
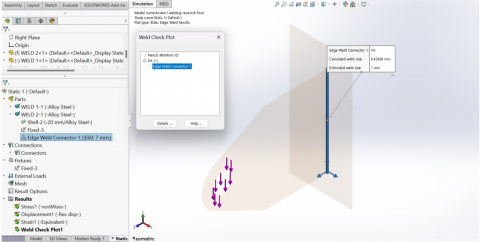
The concluding phase of the welding joint simulation involves determining the ultimate results, which may be evaluated after completing the remaining setup operations. The primary objective of this simulation is to assess the dimensions of the welds. This can be accomplished by right-clicking on the results folder and selecting 'Define Weld Check Plot.' The instructions are illustrated in Figure 9.
Figure 9. Welding joint analysis
Table 4. Mesh sensitivity analysis
|
Fine Mesh |
Medium Mesh *(used)* |
Coarse Mesh |
Mesh Type |
|
1.25 mm |
2.58 mm |
4.00 mm |
Max Element Size |
|
0.06 mm |
0.12 mm |
0.80 mm |
Min Element Size |
|
~400,000 |
174,613 |
~42,000 |
Total Nodes |
|
~200,000 |
86,762 |
~21,000 |
Total Elements |
|
9.91 mm |
9.94 mm |
10.31 mm |
Weld Size (3000 N) |
|
743 MPa |
745 MPa |
785 MPa |
Max Stress (MPa) |
|
1.35 |
1.33 |
1.2 |
Safety Factor |
The presence of welding stresses in any given program is characterized by their inherent unpredictability, rendering it challenging to ascertain the precise values that are contingent upon engineering and mesh size. Edge welds are frequently seen in engineering designs, however, evaluating them can be a complex task. The edge weld check plot is a simple method to quickly determine if a design passes or fails, reducing the need for further welding investigation and improvement. An important consideration is that stress-free edge weld check plots depend on forces. It has been disclosed that the stress levels provided in the seams are not consistently precise. The seams often act as vulnerable areas in models that only depend on stresses. Shear and bending forces are checked at each node. The load at each node is subsequently analyzed using this form:
$f_w=\sqrt{\left(f_{ {normal }}+f_{ {bending }}\right)^2+\left(f_{ {shear }}\right)^2}$ (1)
where, fw represents the resultant force (or total force), fnormal represents the force acting along the longitudinal axis, fbending represents the bending force (or bending stress), fshear Represents the shear force. Depending on geometry dimensions, boundary conditions, and results of Eq. (1), and by comparing with the maximum allowable shear stress of the electrode, SOLIDWORKS software will calculate the weld thickness or the weld size from the following equation:
$\boldsymbol{t}_{\boldsymbol{w}}=\frac{\boldsymbol{f}_w}{F_a}$ (2)
where, tw represents the weld thickness. It refers to the size or width of the weld joint, fw corresponds to the resultant force acting on the weld joint. It combines the effects of normal force, bending force, and shear force within the weld, Fa represents the applied force or load on the weld joint. It could be an external force (such as tension or compression) or an internal force due to the service conditions.
This algorithm results in a measurement of length that accurately matches units of (tw). If the current thickness at any node is more than or equal to this minimal value, the program deems it acceptable. If the weld does not meet the required criteria, SolidWorks Simulation categorizes it in a folder labeled "needs attention". This implies that welding needs a greater level of awareness and understanding. Next, you may modify the primary value of the welding size to a number that is close to the cost of the welding size when determining the edge welding connection. Once all the welding is labeled as "ok" and marked with the color green in the following inspection diagrams, analysts may confidently conclude that the welds will reliably withstand loads without any failures. Regardless of the account approach, it is crucial to emphasize that the edge weld check plot is derived from empirical testing rather than just theoretical assumptions [22]. The software's criteria are based on the Structural Welding Code D1.1 of the American Welding Society (AWS) [23]. For this study, the used parameters to calculate the weld size are illustrated in Figure 10 and Table 5.
Figure 10. Weldment and welding joint dimensions
Table 5. Weld joint size calculating parameters
|
D (High) |
140 mm |
|
A (Width) |
167 mm |
|
P (Force) |
1000,2000,4000 N |
|
Pw (Weld Strength) |
273 N/m2 |
|
SF (Safety Factor) |
3 |
The calculated weld joint size done by SOLIDWORKS will be compared with the mathematical calculation resulting from the parameters in Table 4, These parameters will used with the following equation:
${weld\,\, size}$ $(h)=\frac{0.71 p}{b t_s}$ (3)
All the parameters in Eq. (3) are known and defined except the weld stress. ts calculated from the below equation:
$t_s=\frac{0.4 P_w}{S_F}$ (4)
From the above two Eqs. (3) and (4) the least thickness of weld size will be calculated, but according to the AWS welding standards, the weld size must be in the range of (4 mm-10 mm), for this study weld size (4 mm) has been chosen.
4.1 Material selection and boundary conditions
This simulation uses alloy steel because it represents an appropriate choice for welded structures which find substantial applications across automotive and aerospace industries as well as construction. The use of alloy steel offers perfect results in demanding applications because it provides a fantastic balance of weldability with toughness and fatigue resistance properties. Tensile and yield strength attributes of alloy steel constitute essential components for determining welded joint integrity specifically when static loading occurs as part of this investigation. Introducing the basis for selecting the alloy steel would further enhance the discussion about its material properties. The choice should be compared to popular welding materials including carbon steel and stainless steel regarding their weldability along with cost and mechanical performance in defined conditions.
Initial weld design assessments increasingly use static loading conditions for their boundary conditions. Engineers use static loads as a basic analytical method in order to determine first-level information about welded joints' stress distribution and structural behavior patterns. These testing conditions determine fundamental specifications about weld dimensions as well as their strength levels and stability characteristics that guarantee joints remain operational under service conditions. The actual welding structures which exist in the world operate under changing dynamic loading scenarios along with cyclic stress patterns throughout their service life. The failure predictions for fatigue life and long-lasting performance of welded joints remain uncovered when only static loading methods are used due to these practical load patterns. Future research should include dynamic and cyclic loading analyses because extending this study to those conditions would be several wise. Such real-life operational loading conditions become vital for an improved simulation which improves weld joint performance predictions and durability and reliability outcomes.
The safety factor is crucial for ensuring welded joints can withstand forces beyond normal design assumptions. It protects against unknown material properties, weld quality, and operational demands. The study chose a safety factor between 2 and 3 based on AWS D1.1 standards for structural welding. 2 safety factor reduces production costs by reducing material usage, benefiting non-essential applications. A factor below 2 increases the risk of unexpected failure. Safety factors approaching 3 are essential for aerospace and nuclear sectors, as failure thresholds can lead to serious consequences. Designers can use the safety factor range to make design adjustments based on practical conditions. Dynamic and cyclic loads in automotive and aerospace applications require additional safety factors to ensure long-lasting weld performance under repeated stress scenarios.
Welded joints rely on the choice of electrode type to achieve strength and weldability. The E6010 and E7010 electrodes are commonly used for all-position welding due to their deep penetration and stable arcs, resulting in high-quality welds with low defects. The E6010 electrode is ideal for welding carbon steels and alloy steels, as it provides dependable welds with high quality. The E7010 electrode offers superior strength performance and fatigue resistance, making it suitable for demanding applications like aerospace, automobile, and sea vessel industries. These electrodes are compatible with alloy steel welding properties, producing strong welds that maintain the material's mechanical properties. E7010 is chosen for higher stresses during service, as it ensures weld joints maintain structural integrity under heavy loads. The implementation of these electrodes is based on project requirements related to weld quality and structural integrity. Welders typically choose E6010 for general welding duties due to its optimal penetration depth and reliable joint integrity. E7010 is also chosen for essential weld strength applications to ensure designed performance criteria are met by the final weld structure.
5.1 Estimated and calculated weld size analyses
The results of the SOLIDWORKS weld simulation for the first scenario, with an external force of 1000 N, are reported based on the data in Figure 11 (A). After careful examination, it is clear that the predicted weld sizes for the fillet joint under this load are somewhat less than the expected size. This suggests that both the weld quality and the analytical parameters are satisfactory. The joint was classified as "OK," indicating that the weld size does not require any adjustments or modifications to fulfill the necessary strength and design criteria, and the present weld size is considered OK. When the external stress reached 2000 N, it became clear from the SOLD WORKS solution shown in Figure 11 (B) that the calculated weld size for the joint was bigger than the expected size. This might suggest an issue with either the quality of the weld or the parameters used in the study. This joint has been designated as "Requires attention," indicating that the weld size may need to be augmented to comply with the necessary strength or design criteria. Figure 11 (C) illustrates the welding joint simulation and weld size calculation value when the applied external force was 3000 N, just like the weld size in (B), the joint is marked as "Needs attention" because the joint calculated weld size was about 2 and half time larger than the estimated size, this will cause a major problem with weld joint quality and may be ended with welding joint failure. This analysis indicates that the weld size needs to be modified and re-designed to meet the required strength or design, but this modified limited by the fillet welding joint size standards which give a limit size between 4 to 10 mm [23]. The SOLIDWORKS calculated weld size for 3000 N force was 9.94 mm which almost reached the maximum standard value, Table 6, demonstrates SOLIDWORKS simulation corresponding to each weld joint's estimated and calculated weld size, and their results according to the applied force.
Table 6. SOLIDWORKS joint simulation results analysis
|
External Force |
Estimated Weld Size |
Calculated Weld Size |
Error % |
Analysis |
|
1000 N |
4 mm |
3.31 mm |
17.25 |
OK |
|
2000 N |
4 mm |
6.62 mm |
65.5 |
Needs attention |
|
3000 N |
4 mm |
9.94 mm |
148.5 |
Needs attention |
(A)
(B)
(C)
Figure 11. Welding joint estimated and calculated weld size (A) 1000 N, (B) 2000 N, and (C) 3000 N external force
5.2 Weld size correction
According to the simulation results in Table 5 above, the weld size with both 2000 and 3000 N needs to be modified to correct the weld joint size, this can be done by three options. First by lowering the safety factor value from 3 to 2, secondly by increasing the estimated weld size, and finally by changing the electrode type to increase its strength [24]. The welding joint design standards recommended not lowering the safety factor to less than 2 because that would not fit with the weld joint design criteria which usually recommend a safety factor between 2 and 3 [25], this will restrict the usability of this option to very critical situations when the changing of the weld size or the electrode type is not permissible. The second option to correct the weld size is increasing the weld size to the calculated value, this is the most popular option, but it is also restricted by the fillet joint design standards to a 10 mm value as a maximum value. The third option by changing the electrode type usually used when increasing the estimated weld size over the permissible range or when reaching critical values. This option is more comfortable from the design side but has economic consequences. Figures 12 (A) and (B) illustrate the correction of weld size by decreasing the safety factor value to 2 for 2000 and 3000 N. As shown when the safety factor decreased to 2 in (A) and (B) the calculated weld size decreased to 4.41 and 6.62 mm respectively. These values were larger than the estimated weld size and the program marked the weld check plot as (Need attention) for both situations which indicated that this option will not work with this problem without increasing the estimated weld size to the calculated value. The second option to solve this problem is by increasing the estimated weld size to the calculated one, this option is also restricted by the standard limits as explained above. But in this study, we need to increase the estimated weld size to 7 mm for 2000 N and to 10 mm for the 3000 N force, the 10 mm weld size will be the maximum allowable weld size for fillet joint according to the welding standards.
(A)
(B)
Figure 12. Welding joint estimated value correction by safety factor redaction (A) 2000 N, (B) 3000 N external force
The increase in weld size in particular work done by increasing the welding passes or by reducing the welding speed to deposit more metal per length unit [26], both techniques will increase the amount of input heat to the welding joint which will affect the welding zone and heat affected zone (HAZ) properties. For these reasons increasing the weld size will certainly solve the problem and be compatible with the design criteria, but increasing the input heat may badly affect the HAZ mechanical properties and the welding joint working conditions [27]. Figures 13 (A) and (B) illustrate the increasing estimated weld size for both 2000 and 3000 N forces. SOLIDWORKS weld check plot marked both simulations with (OK), indicating that the increased weld size would solve the problem from the design opinion.
The third option for solving this issue is to change the type of welding electrode to increase the joint strength. The E60 electrode used as default in the SOLIDWORKS software covered the external force requirements with a 4 mm estimated weld size when the force value was 1000 N. But for the 2000 N external force E100 electrode needed to match the estimated weld size, the calculated weld size for E100 electrode was 3.97 mm, which almost equal to the 4 mm estimated weld size. Nevertheless, for 3000 N external force even when using E100 electrode, which is the maximum alloy steel electrode in SOLIDWORKS software, the calculated weld size, will not be acceptable and the simulation marked as (Need attentions). Figures 14 (A) and (B) illustrate the results of these simulations. Figure 14 (A) shows the simulation of the E100 electrode with 2000 N external force and 4 mm estimated weld size with the acceptable result, and Figure 14 (B) show the simulation result of the same electrode and weld size but with 3000N force and simulation marked as (Need attentions).
(A)
(B)
Figure 13. Welding joint estimated value correction (A) 2000 N, (B) 3000 N external force
Not from above all three options can solve the problem with the weld size without reducing the safety factor or changing the welding electrodes. Even with that, the weld size may need to increase above the 4 mm value that means the needed for multi-pass welding procedure or welding with low speed as explained above [28]. For that and to achieve this study aims in estimating the best welding conditions for this study welding joint design its clearly that the authors need mixing between these three options to founded the best procedure for 2000 N and 3000 N external force. For 2000N force the best producer with the minimum welding input heat and welding passes can be produced with a 4mm estimated welding joint size, 2 value for the safety factor, and welding with E70 electrodes, this procedure can be used when the joint application is not critical due to the lowering of the safety factor value to 2. When the welding joint with 2000 N working under dangerous or critical conditions, the safety factor must be returned to the 3. In this situation the estimated weld size must be increased to 5 mm or welding with an E80 welding electrode to meet the SOLIDWORKS requirement for this welding joint, the authors prefer the welding with E80 electrode to avoided the increasing in welding input heat when welding with 5 mm estimated welding size. Figure 15 (A) and (B). For the welding joint with 3000 N, the best welding procedure with minimum welding heat input can be produced when welding with E80 welding electrodes with 5 mm welding size and 2 value for the safety factor, this procedure works under normal conditions. However, when the welding joint works under critical conditions, the safety factor must return to 3 again. The best procedure will be with E100 electrode with 6 mm welding size and 3 values for the safety factor. Figure 16 (A) and (B) illustrate the simulation results.
(A)
(B)
Figure 14. Welding joint electrode type correction (A) 2000 N, (B) 3000 N external force
The safety factor in welding joint configuration is essential to ensure the joint can withstand the applied load without failure. The essential standards are considered while assessing the safety issue: The kind of applied load (static, dynamic, or fatigue) significantly influences the safety factor value. For static loads, atypical safety factor ranges range from 1.25 to 2. The safety factor for fatigue loads is determined only by the ratio of fatigue loading to the calculated stress of the weld joint. The strength and malleability of the materials being welded are crucial. Materials with superior strength and enhanced fatigue resistance can allow for a reduced safety factor. The quality of the weld, characterized by imperfections such as cracks, porosity, or inclusions, also affects the safety factor. Welds of superior quality with diminished flaws may possess reduced safety aspects. Compliance with applicable design specifications and regulations, as per the American Welding Society (AWS) or the International Organization for Standardization (ISO) standards, ensures that safety considerations align with organizational requirements. Temperature, corrosion, and chemical exposure can affect protective measures. Adverse conditions may necessitate enhanced protection and safety measures to accommodate capacity deterioration over time. The significance of the welded junction in a typical structure and the implications of its failure are also crucial factors. Critical joints with significant failure repercussions typically possess elevated safety factors. By evaluating these parameters, engineers can ascertain the optimal safety factor to guarantee the reliability and safeguarding of welded connections across diverse applications.
(A)
(B)
Figure 15. Welding joint with 2000 N best procedure simulation results (A) normal working conditions (B) critical working conditions
However, adding stress, strain, deformation and factors of safety to the analysis moves the simulation methodology forward, away from simply determining the optimum weld size to give maximum buckling capacity. These simulations can provide fundamental knowledge of welds concerning their performance under load, the effect on the overall structure, and the means of optimizing the welds for reducing cost while increasing strength. The advantage of evaluating all these aspects is that the final weld design is optimal as well as cost-effective. the weld sizes used in the simulation were determined using actual size of the structure derived from 3D CAD model. Product simulations in SolidWorks encompass material characteristics, loading regimes, and welding techniques amongst others. Thus, if those, that define the simulation conditions, namely heat input, material flow and/or boundary conditions are set to be anything but real, the differences in the calculated and simulated weld size can and will occur. There could be a possibility that a higher safety factor could have been incorporated during the design of a part which in return gives a bigger size of the weld when OPT is done. There are safety factors that apply in the structure to guarantee the structure’s dependability and its failure. The study pointed out that the calculated weld sizes could be further minimized if the safety factor is decreased to a level of 2. The safety factor is higher requirement larger size welds to accommodate for other stresses or failure. Perhaps, the simulation could have gone to the extreme of safety by suggesting a larger weld size than necessary given certain unavoidable load levels or extraneous external forces.
(A)
(B)
Figure 16. Welding joint with 3000 N best procedure simulation results (A) normal working conditions, (B) critical working conditions
The current research employs safety factors but fails to elaborate on their effects regarding practical weld design implementation. Safety factors require customized application because their selection depends on each use case together with load requirements and predicted failure outcomes. Security margins in mission-critical structures such as aerospace vehicles and nuclear installations and seismic facilities are generally set at 2.5 to 3 levels because deep failures in these operations would lead to extensive damage. The selection of safety factors depends on application type and risk evaluation because critical permanent systems call for higher values.
Safety factor variations affect the dimensions of welds along with the amount of material needed and design price expenditures. An increase in the safety factor results in enlarged weld dimensions which raises material expenditures and might diminish design efficiency. Lowering safety factors leads to spending reduction together with lighter designs yet such practices carry known risks for structural load-bearing capacity errors. Although the study explores safety factors it avoids presenting detailed analysis about their effects on weld performance throughout actual service life for dynamic or cyclic loading scenarios. Research should emphasize thorough evaluation of safety factor reductions below industry guidelines because of potential risks when operating such components in critical use cases. Too much reduction of safety factors can produce problematic designs because structures may deteriorate from fatigue and hidden forces over time.
5.3 Comparison of weld sizes
Calculated Weld Size (from SolidWorks simulation) For 3000 N external force: 9.94 mm weld size. This falls well within the AWS standard which estimates a weld size that could be in the 4mm-10mm range, depending on the load factor and design involved. Meeting both AWS D1.1 requirements lower limit of the range for fillet welds is 4 mm and its upper limit is 10 mm. This means the calculated weld size (9.94 mm) is just within the permissible limit of the standards and indicates that when the weld size increases for accommodating higher loads the proposed methodology is likely to arrive closest to these upper limits. The calculation also holds good with the safety factor consideration (between 2 and 3), and in order to get smaller weld size, the safety factor could be reduced. The study shows that simulations in SolidWorks could be employed not only to modify weld sizes, but also involve the change of the size, safety factor, and the type of the electrode; therefore, the approach seems dynamic as opposed to standards. The presented methodology highlights disparities in the values of estimated and calculated weld sizes with solutions (for instance, varying the safety coefficients, and increasing the weld diameter) that have been custom-made to conform to real-world conditions and are more accurate compared to raw calculations. Compared with the empirical methods or code-based design approach, the use of simulation and modification of the safety factors is an advantage of weld design that can be tuned with the specific loading conditions.
The actual welded area measurement under 2000 N force amounted to 6.62 mm representing 65.5% greater than the predetermined 4 mm weld design. The analysis demonstrates that the weld dimensions need to extend 25% beyond the original estimates because it ensures joint resistance against failure during load application. The recorded mark of "Needs attention" on the weld joint demonstrated an insufficient weld size of 4 mm when subjected to 2000 N force because it required redesign or size modifications. The calculated weld dimensions reached 9.94 mm under 3000 N loading which amounts to 148.5% larger than the initial weld measurement of 4 mm. The necessary weld reinforcement reaches 148.5% under 3000 N forces because high external loads require augmented weld strength. Raising the weld size by 25% at 2000 N load did not address the initial weld dimensions due to the need for further strengthening as indicated by “Needs Attention”.
Simulation outcomes prove that weld size needs adjustment when forces reach beyond 2000 N so structures can fulfill their safety and performance responsibilities. The requirement to enhance weld dimensions becomes 25% for 2000 N forces yet reaches 50% for 3000 N forces. The identified information supports preventing welded joints from failing when exposed to dynamic loads. Structural damage that could be catastrophic will occur if welded structures experience these forces but the weld size remains unadjusted.
5.4 Reducing safety factor and changing electrode types risks
Engineers use reduced safety factors to design optimal welds at lower material costs, but this can lead to potential performance degradation. This reduces initial material costs and expenses, but it also increases vulnerability to unexpected stress failures. Safety measures are crucial in aerospace, automotive, and structural engineering applications, as disruptions can result in catastrophic consequences. Reduced safety measures also decrease weld fatigue resistance, making welded joints vulnerable to cyclic loading waves, thermal stresses, and vibrations. Thorough inspections are necessary before changing safety factors, considering short-term installation costs, future failure risks, and effects on safety margins exposed to fatigue or shock loads.
Welding electrodes are chosen based on evaluation to improve weld quality, material strength standards, and welding capabilities. High-strength electrodes like E100 offer stronger joints and increased resistance against heavy loads. However, they can increase manufacturing costs and require advanced handling strategies. Heat transfer, longer processing times, and heat-affected zone defects can also pose challenges during welding operations. The durability of a weld is determined by the selection of electrodes, and choosing for harsh environments requires additional costs for longer-lasting material resistance. High-end electrodes may not be beneficial for applications with minimal complexity, as basic materials already produce satisfactory results. Economic advantages from decreasing safety factors and electrode modifications can be seen in short-term periods but require extended cost assessments. Compact weld dimensions can reduce material expenses but may lead to unexpected repair costs. Expensive electrodes increase initial costs but extend weld performance and reduce maintenance. Different welding materials and joint decisions should be optimized for specific environments, especially in critical applications like bridge surveillance. Adjusting safety factors and electrode selection can provide workable options for non-critical applications.
The optimization of weld size depends on three vital design parameters that involve safety factor reductions combined with the proper selection of electrodes as well as larger weld dimensions. Adjustments to welding parameters occur when structural requirements need fulfillment yet result in substantial compromises. Different optimization choices entail technical impacts together with economic and practical factors especially for material expenses and electrode prices together with potential long-term durability risks from load-related material fatigue. To make a well-rounded structured decision about welded joint optimization it becomes essential to advance comprehension of these key elements.
6.1 Safety factor reduction (2 to 3)
Engineers often reduce safety factors from 3 to 2 to reduce costs, leading to smaller weld dimensions and reduced material and manufacturing expenses. However, this decrease also creates vulnerabilities to unexpected loading, potentially leading to failure. Safety margins are crucial in aerospace applications and structural components, as they influence performance and safety. Lower safety factor values negatively affect fatigue resistance, resulting in welding dimensions that cannot withstand multiple reoccurring loads over extended periods. Systems with moving joints, such as bridges, automobile frames, and aircraft wings, are vulnerable to structural fatigue damage. The reduction of safety factors initially reduces initial costs but reduces reliability and may require additional maintenance, potentially leading to structural collapses. These temporary financial benefits disappear after critical system failures, causing significant downtime and costly repairs.
6.2 Electrode type selection (E6010 vs. E7010)
The choice of welding electrodes significantly impacts the performance of the welded joint and its associated costs. The E6010 electrode is a versatile tool suitable for general purposes due to its deep penetration and stable arc operation, making it ideal for welds requiring robustness but high dynamic load tolerance. Its affordability allows it to be used in non-critical automotive and construction parts. The E7010 electrode, a low-hydrogen electrode, is designed for high-strength features, offering strong fracture resistance and better fatigue resistance. Despite its high material cost, E7010 electrodes offer valuable strength properties suitable for applications requiring heavy outside pressure or structural movement, such as aircraft or marine operations. However, the implementation of E7010 electrodes can lead to increased expenses in weld material units, especially for large-scale weld projects. Despite these challenges, E7010 electrodes provide enhanced reliability and safety in high-risk sectors like aerospace and automotive. However, they also increase initial material expenses, causing additional welding difficulties and higher labor costs, along with welder training.
6.3 Weld size increase
The economic implications of increasing weld dimensions become a challenge when manufacturers need to hold either greater operating loads or maintain a lower security margin. Welding materials need to be used in greater quantities when weld size needs to increase so the raw material expenses rise accordingly. Larger welds entail longer welding durations that lead to increased expenditure on labor costs. The elevated expenses in high-volume manufacturing would reach significant amounts. The increased strength from using large welds comes with security concerns resulting from temperature-induced material warping and internal element stresses and altered characteristics of heat-affected zones. Uncontrolled welding heat creates material warping and microstructural alterations that harm base material mechanical properties particularly when welding high-strength alloys. Post-weld heat treatment becomes necessary for such modifications because they lower welded joint fatigue life which escalates costs. Unnecessary changes to weld size along with incorrect size estimates cause raw material waste and associated environmental effects and heightened production costs due to increased material expenses. The inspection along with quality control procedures become more complicated when weld sizes exceed requirements which leads to increased testing expenses.
6.4 Economic and practical risk balance
Careful analysis must occur to decide between modifying safety margins versus changing electrodes with size modifications as it affects both economic sustainability and safety aspects. The use of both reduced safety factors with small electrodes and immediate cost savings results in raised maintenance expenses from premature weld failures that occur under dynamic conditions and repair requirements for fatigue failure. The evaluation process must assess initial cost gains in combination with potential service-related equipment failure risks during the weld design stage. Validating weld design operation for service conditions that prevent structural reliability deterioration requires modeling dynamic loading fatigue together with assessing residual stresses.
In order to support the simulation approach applied in this research, the simulation outcomes were compared with experiment results in depth. The validation was important to check if the simulations from SolidWorks simulating welded joints’ behavior under various conditions were correct. Several major studies were cited in the validation of the simulation approach, although their methods and materials varied; all have the objective of improving the quality and performance of welded structures. SYSWELD algorithm which was employed by the authors of Shanmugam et al. [29] aimed to predict the thermal field and weld bead profile in T-joint laser welding of AISI 304 stainless steel. We have aimed experimental effort on assessing the impact of the temperature sensitive material characteristics on the weld bead shapes and sizes. The experimental and the simulated results were closely matched and this showed the efficiency of the simulation method. The study was most useful to this work in the sense that it gave an insight into how thermal distribution influences weld quality so that the study provided a direct validation of the approach. Chaurasia et al. [30] sought to determine the accuracy with which thermal simulations yield the behavior of welded joints. Theirs involved checking the consternation of the obtained experimental results with simulation outcomes to determine the merit of the heat input prediction during welding. It was discovered that the simulation could predict actual bead shape and size under different thermal conditions, a procedure that is crucial for the optimization of edge welds in the current study. This validation provided confidence that the simulation tool can effectively model the welding scenarios in real world scenarios and reliability of Weld Solid Works simulation results. The oscillating single-mode laser-GMA hybrid welding definite outline used by Gao et al. [31] aimed at enhancing the quality of ultra-high strength steel joints through a laser-GMA welding approach that involves integration of laser into the conventional Gas Metal Arc welding process. Simulation results confirmed their findings indicating predictive capability of the hybrid welding process was correctly simulated, as weld shapes predicted and actual weld shapes were in good agreement. This validation showed that it is possible to simulate hybrid welding processes, as those addressed in the present work, and therefore use simulation tools for complex welding situations. Liu et al. [32] rightfully devoted a comprehensive review to the simulation of residual stress distribution in welding structures. Comparing the yielded data with the experimental data collected from the welded steel plates, they have proven the effectiveness of the model for predicting the residual stresses which brings the changes in the structure of the weld. These findings confirmed that even during the presentation of the post-welding stress state, the application of simulation tools can be effectively implemented to improve the durability of welded joints as mentioned in this study. This ability to predict the distribution of residual stress added more strength to the simulation techniques employed in this study. Zhao and his team’s [33] studied and simulated weld performance under dynamic load in comparison with experimental data. Together with this, their study highlighted the simulation of the mechanical properties of welded joints under different stress conditions accompanied by experimental verification of these expectations. The good agreement of the numbers between simulation and experiment further supported the effectiveness of simulation techniques in ascertaining the behavior of welded structures under actual loading conditions. This validation process was very useful for the current study since it showed that SolidWorks simulations could be used to correctly predict the mechanical behavior of welded joints subjected to various operational loads. The conclusions reached in these research works confirm the reliability of application of the chosen SolidWorks simulation tools for welding and structural assessment tasks. Thus, the present study supports the hypothesis that the methodology used in this study has been valid for predicting the welding results, which has been enjoyed from a variety of experimental assessments. These validations also provide evidence of the accuracy of the simulation tool as well as its applicability to enhancing the weld process parameters, verifying the structural performance as well as the performance of structures through welding. This validation section includes five different references that describe different aspects of welding simulations about the thermal distribution and bead formation, prediction of residual stress and mechanical behavior under certain loading conditions. Every work referred supports the authors’ validation of the simulation approach employed in this study. For more rigorous validation methods, Table 7 below summarized this validations results.
Table 7. Results validations summarized
|
Study Reference |
Methodology |
Validation Outcome |
|
Shanmugam et al. [29] |
Used SYSWELD algorithm to predict thermal field and weld bead profile in T-joint laser welding of AISI 304. |
Simulation results closely matched experimental data, confirming the simulation method's efficiency. |
|
Chaurasia et al. [30] |
Checked thermal simulations for bead formation predictions during welding. |
Simulations accurately predicted bead shape and size under different thermal conditions, validating the method. |
|
Gao et al. [31] |
Simulation of hybrid laser-GMA welding process for ultra-high-strength steel. |
The simulation correctly predicted weld shapes, confirming the model's predictive capability. |
|
Liu et al. [32] |
Simulated residual stress distribution in welded structures and compared with experimental data. |
The simulation effectively predicted residual stresses, confirming its usefulness for assessing weld durability. |
|
Zhao et al. [33] |
Simulated mechanical behavior of welded joints under dynamic loading conditions and compared with experimental data. |
Simulation results showed good agreement with experimental data, confirming the accuracy of the model for dynamic loading. |
In addition, the simulation in SolidWorks is established based on material models and welding settings that are different from that of the actual welding scenario. Other parameters that are very critical in welding and which might not be well captured in the simulation include heat transfer, mechanical properties of materials under high temperatures, microstructural transformation, and residual stresses. Additionally, the simulations are performed using idealized static loading conditions of 1000 N, 2000 N and 3000 N and do not consider the dynamic loading experienced in welded joints during service like cyclic loading, vibration or shock loads. In the present research, the geometry of the welded joints is relatively more uniform and thus for the purpose of simulation, simplified joint configurations have been considered. In practice, welded joints can be geometrically complex with different weld profiles, root conditions and inter-ply characteristics not captured in the study.
The modeling of welded joints included fundamental geometric shapes but did not accurately represent distinct weld profile characteristics and material variances. Welded constructions in practical application exhibit novel forms, bead configurations, and imperfections that influence internal stress distribution. specific information simulation's lack results in erroneous evaluations of operational weld characteristics. Fundamental geometric design enhances computational speed but limits the transferability of output predictions for intricate structures requiring specialized shapes.
The simulation model needs static loading conditions to achieve valid result generalization. This computational model disregards important actual factors that influence welded joints including vibration and impact strain. Prediction accuracy regarding welded joints and their performance properties become limited by the exclusion of stress building from changing load conditions in the simulation model. The modeling processes lead to differences between actual fatigue stages and crack growth manifestations. The model dismisses important elements such as resonance together with vibration fatigue alongside thermal cycling mechanisms that play vital roles during real-world engineering applications within aerospace and automotive industries. The simulation model has a reduced ability to deliver accurate results for practical implementations because these important factors are not included.
In future studies, more sophisticated material models including thermal cycles, phase transformation of weld materials and residual stresses after welding may be incorporated. The utilization of advanced and more precise computational methods where coupled heat transfer, fluid flow, and microstructural evolutions might be invoked during the welding process might also improve the results. Moreover, Further research could investigate the application of fatigue analysis and dynamic loading simulations to determine how welds are capable of performing when subject to cyclic loads such as high cycle fatigue (HCF) and low cycle fatigue (LCF). As for the second assumption, adding the vibration analysis to the simulation could give an overall picture of how the weld structures would respond to real load conditions of the equipment.
The Solidworks program proficiently created and modeled the structural configuration of the alloy steel bracket, satisfying all design parameters. Furthermore, a thorough weld simulation was conducted on the planned structure to examine its reaction to applied stresses. The investigation yielded the following conclusions:
1. The results were found to be within acceptable ranges, and the analysis revealed two main outcomes: "OK,” and "Needs attention". The fillet edge weld analysis identified areas of concern where the calculated weld sizes deviated from the estimated sizes. It is recommended that with 2000 N and 3000 N force the weld joints need to be re-evaluated and re-designed again to ensure the structural integrity and performance of the assembly.
2. the simulations of the fillet weld joint with 1000 N applied force showed no need for any joint design adjustments and the SOLIDWORKS software marked the joint with an (OK) mark.
3. In scenarios where additional attention is necessary with 2000 N and 3000 N external force applied, increasing the weld size by at least 25% to a maximum of 50% of the estimated size is recommended. However, when the working conditions are not critical the designer may attend to reducing the safety factor value to avoid increasing the fillet weld size.
4. The authors recommended a mixing procedure between the three options to reach the optimum welding procedure that produced the minimum input welding heat to the joint, and classified this procedure into normal conditions procedure, and critical working conditions procedure for the 2000 N and 3000 N applies force.
5. This study results proposed and offer a very effective simulation procedure to estimate the required welding conditions that produced the minimum weld size required to stand with the applied external forces.
6. This study carries substantial consequences for multiple sectors that use welded structures within their domain such as automotive manufacturing and aerospace production together with construction ventures. Engineers adopting this proposed methodology can generate weld designs with improved accuracy that enhances both welded joint performance and safety together with reduced material expenditure. Through simulation during the weld design process engineers can conduct quick evaluations and perform multiple test rounds to decrease expenses for physical testing and minimize welding failures.
[1] Nazri, N.A., Sani, M.S.M. (2017). Finite element normal mode analysis of resistance welding jointed of dissimilar plate hat structure. IOP Conference Series: Materials Science and Engineering, 257(1): 012059. https://doi.org/10.1088/1757-899X/257/1/012059
[2] Hashim, M.H.M., Arifin, A.M.T., Osman, S.A., Osman, S.A., Kiat, T.S., Salihin, A.F.M. (2024). Study on MIG and TIG weldment behaviour using finite element approach. Journal of Advanced Research in Applied Sciences and Engineering Technology, 46(2): 81-89. https://doi.org/10.37934/araset.46.2.8189
[3] Sui, X., Zhao, X., Ren, B., Chen, Y., Gao, Y., Chen, C., Hu, C. (2024). Investigating on the macroscopic morphology, microstructure and mechanical properties of Al0. 3CoCrFeNi-HEA/304 stainless steel dissimilar welded joints. CIRP Journal of Manufacturing Science and Technology, 52: 86-99. https://doi.org/10.1016/j.cirpj.2024.05.014
[4] Badurdeen, F., Marksberry, P., Hall, A., Gregory, B. (2010). Teaching lean manufacturing with simulations and games: A survey and future directions. Simulation & Gaming, 41(4): 465-486. https://doi.org/10.1177/1046878109334331
[5] Bondarenko, Y., Xiaoyu, D. (2021). Analysis of transition zones of layered composite materials obtained by the pulse method of processing. In METAL 2021-30th Anniversary International Conference on Metallurgy and Materials, Conference Proceedings, pp. 354-359. https://doi.org/10.37904/metal.2021.4125
[6] Shanmugam, N.S., Buvanashekaran, G., Sankaranarayanasamy, K., Kumar, S.R. (2010). A transient finite element simulation of the temperature and bead profiles of T-joint laser welds. Materials & design, 31(9): 4528-4542. https://doi.org/10.1016/j.matdes.2010.03.057
[7] Gao, X.S., Wu, C.S., Goecke, S.F., Kügler, H. (2017). Numerical simulation of temperature field, fluid flow and weld bead formation in oscillating single mode laser-GMA hybrid welding. Journal of Materials Processing Technology, 242: 147-159. https://doi.org/10.1016/j.jmatprotec.2016.11.028
[8] Li, C., Wang, K., Huang, J. (2018). Simulation of the effect of spot size on temperature field and weld forming in laser tissue welding. Optik, 155: 315-323. https://doi.org/10.1016/j.ijleo.2017.09.118
[9] Choudhary, A.K., Jain, R. (2023). Influence of stir zone temperature and axial force on defect formation and their effect on weld efficiency during friction stir welding of AA1100: A simulation and experimental investigation. Materials Today Communications, 37: 107413. https://doi.org/10.1016/j.mtcomm.2023.107413
[10] Choudhary, A.K., Jain, R. (2024). Investigation of the influence of defect volume on weld strength during FSW: A simulation and experimental study. Engineering Failure Analysis, 162: 108434. https://doi.org/10.1016/j.engfailanal.2024.108434
[11] Pradhan, R., Joshi, A.P., Sunny, M.R., Sarkar, A. (2022). Performance of predictive models to determine weld bead shape parameters for shielded gas metal arc welded T-joints. Marine Structures, 86: 103290. https://doi.org/10.1016/j.marstruc.2022.103290
[12] Chaurasia, A.K., Aggarwal, A., Khanna, P. (2024). Mathematical modelling to predict bead geometry in MIG welded aluminium 6101 plates. Materials Today: Proceedings, 113: 152-158. https://doi.org/10.1016/j.matpr.2023.08.051
[13] Nam, K., Ki, H. (2024). Deep learning-based monitoring system for predicting top and bottom bead widths during the laser welding of aluminum alloy. Journal of Manufacturing Processes, 120: 616-627. https://doi.org/10.1016/j.jmapro.2024.04.048
[14] Rao, K.V. (2024). Online modeling and prediction of weld bead geometry in robotic gas metal arc based additive manufacturing using grey prediction model. Expert Systems with Applications, 236: 121284. https://doi.org/10.1016/j.eswa.2023.121284
[15] Cai, W., Shu, L., Geng, S., Zhou, Q., Cao, L. (2024). Weld beads and defects automatic identification, localization, and size calculation based on a lightweight fully convolutional neural network. Optics & Laser Technology, 170: 110266. https://doi.org/10.1016/j.optlastec.2023.110266
[16] Dauod, D.S., Mohammed, M.S., Aziz, I.A., Abbas, A.S. (2023). Mechanical vibration influence in microstructural alterations and mechanical properties of 304 stainless steel weld joints. Journal of Engineering Science and Technology, 18(6): 33-54.
[17] Han, Z., Chen, Y. (2019). Enhance the mechanical strength of metal plates by processing the shape of the bulge. IOP Conference Series: Materials Science and Engineering, 631(3): 032021. https://doi.org/10.1088/1757-899X/631/3/032021
[18] Simmons, C.H., Maguire, D.E., Phelps, N. (2009). Chapter 29 – Springs. Manual of Engineering Drawing (Third Edition), Butterworth-Heinemann, pp. 225-232. https://doi.org/10.1016/B978-0-7506-8985-4.00029-2
[19] Mohamed, M.S., Abtan, A.A., Moosa, A.U. (2023). Microstructure and mechanical properties assessments of 304 austenitic stainless steel and Monel 400 dissimilar GTAW weldment. Revue des Composites et des Matériaux Avancés-Journal of Composite and Advanced Materials, 33(3): 135-144. https://doi.org/10.18280/rcma.330301
[20] Ahmad, A., Ibrahim, R., Zainoridin, H., Hong, C.B., Cheng, K. (2024). An analysis of chip formation and hole circularity in drilling applications: An aircraft components perspective. Journal of Advanced Research in Applied Mechanics, 118(1): 28-39. https://doi.org/10.37934/aram.118.1.2839
[21] Abrar, M.S.U., Ezaz, K.F.N., Hasan, M.J., Pranto, R.I., Alvy, T.A., Hossain, M.Z. (2024). Speed-dependent impact analysis on a car bumper structure using various materials. Results in Engineering, 21: 101927. https://doi.org/10.1016/j.rineng.2024.101927
[22] Zhang, H., Dziatkovskii, A., Hryneuski, U., Krylova, A., Dudov, A. (2023). Secondary development of CAD software for the construction of mechanical product design system. Computer Aided Design Application, 20(S3): 178-189. https://doi.org/10.14733/cadaps.2023.S3.178-189
[23] Structural Welding Code Steel, AWS D1.1/D1.1M:2020. American Welding Society. https://www.academia.edu/128427528/AWS_D1_1_D1_1M_2020_Structural_Welding_Code_Steel.
[24] Abdulameer, A.G., Mohammed, M.S., Abbas, A.S. (2022). Microstructure variation effects influence on characteristics and mechanical properties of monel 400 and low alloy steel (ASTM 387-Gr. 11) gtaw dissimilar joinT. Eastern-European Journal of Enterprise Technologies, 119(12): 13-20. https://doi.org/10.15587/1729-4061.2022.266264
[25] Osoba, L.O., Ayoola, W.A., Adegbuji, Q.A., Ajibade, O.A. (2021). Influence of heat inputs on weld profiles and mechanical properties of carbon and stainless steel. Nigerian Journal of Technological Development, 18(2): 135-143. https://doi.org/10.4314/njtd.v18i2.8
[26] Köse, C. (2022). Heat treatment and heat input effects on the dissimilar laser beam welded AISI 904L super austenitic stainless steel to AISI 317L austenitic stainless steel: Surface, texture, microstructure and mechanical properties. Vacuum, 205: 111440. https://doi.org/10.1016/j.vacuum.2022.111440
[27] Li, J., Li, H., Liang, Y., Liu, P., Yang, L., Wang, Y. (2020). Effects of heat input and cooling rate during welding on intergranular corrosion behavior of high nitrogen austenitic stainless steel welded joints. Corrosion Science, 166: 108445. https://doi.org/10.1016/j.corsci.2020.108445
[28] Amraei, M., Ahola, A., Afkhami, S., Björk, T., Heidarpour, A., Zhao, X.L. (2019). Effects of heat input on the mechanical properties of butt-welded high and ultra-high strength steels. Engineering Structures, 198: 109460. https://doi.org/10.1016/j.engstruct.2019.109460
[29] Shanmugam, K., Sivakumar, M., Ramesh, S. (2014). Thermal analysis of T-joint laser welding in AISI 304 stainless steel using SYSWELD simulation. International Journal of Heat and Mass Transfer, 75: 244-251. https://doi.org/10.1016/j.ijheatmasstransfer.2014.03.032
[30] Chaurasia, S.K., Ranjan, S., Kumar, P. (2015). Thermal simulations of welding processes for accurate bead formation predictions. Journal of Manufacturing Processes, 19(2): 185-192. https://doi.org/10.1016/j.jmapro.2015.03.003
[31] Gao, W., Zhang, L., Zhang, Z. (2016). Modeling and experimental validation of a hybrid laser-GMA welding process for ultra-high-strength steel. Journal of Materials Processing Technology, 232: 292-299. https://doi.org/10.1016/j.jmatprotec.2016.01.017
[32] Liu, Y., Wang, W., Xu, H. (2017). Residual stress distribution in welded structures: A comparison of simulation and experimental results. International Journal of Pressure Vessels and Piping, 148: 55-63. https://doi.org/10.1016/j.ijpressvessels.2017.02.001
[33] Zhao, Z., Wang, X., Zhang, F. (2020). Comparative study of mechanical behavior of welded joints under dynamic loading: Simulation and experimental validation. Journal of Materials Science & Technology, 42: 43-52. https://doi.org/10.1016/j.jmst.2019.06.012