Samah J. Saba*![]() | Elaf A. Abd Al-Kareem
| Elaf A. Abd Al-Kareem![]() | Muna R. Hameed
| Muna R. Hameed![]()
© 2025 The authors. This article is published by IIETA and is licensed under the CC BY 4.0 license (http://creativecommons.org/licenses/by/4.0/).
OPEN ACCESS
Globally, heart disease is one of the main causes of death. Clinical data analysis is a huge problem when it comes to accurately predicting cardiovascular disease. This work presents a prediction model that makes use of numerous proven classification algorithms and different combinations of information. The goal of this work is to help in the detection of heart disease by employing a hybrid classification system depending on the Binary Harris hawks algorithm (BHHO) and the Logistic regression approach. Also, the Boruta algorithm with random forest is used and compared with the proposed PCA-BHHO algorithm. In this work, the data is first preprocessed, and missing values are filled with mean values. Then, data is scaled using standard scaler, and the proposed hybrid PCA and BHHO are applied to select the best features. RF and logistic regression are employed to classify the patients as heart disease patients or not. For comparison, Boruta is used for feature selection and RF for classification and compared the results with the proposed PCA-BHHO algorithm. Two datasets are utilized to test the proposed model: Statlog and the Cleveland heart disease datasets. The proposed PCA-BHHO algorithm attained an accuracy of 92.59% and 89.33% on the Statlog and the Cleveland datasets, respectively. At the same time, the Boruta-RF algorithm attained an accuracy of 90.14% and 87.64% on the Statlog and Cleveland datasets, respectively.
feature selection, heart disease, optimization, Boruta algorithm, random forest, PCA, BHHO
The term "heart disease" (HD) refers to a wide range of conditions affecting the heart. The phrase cardiac disease is often used interchangeably with cardiovascular disease (CVD). Coronary supply channels give blood to the heart, and the narrowing of coronary arteries is the leading cause of heart failure. The prediction of CVD is regarded as one of the most significant topics in the field of data analytics. The leading cause of heart attacks in the United States is coronary artery disease. Cardiac disorders affect more men than women [1].
Clinical decision support systems often include models of ML that predict a patient's likelihood of developing a disease based on risk factors. In this study, we will devise a model to predict CVD. HD accounts for around 31% of deaths globally, which makes it the leading cause of death according to the WHO. Globally, 17.9 million people die from the disease each year [2].
Extracting relevant risk indicators for heart disease and properly diagnosing from such monitoring data is challenging. To address this issue and analyze cardiac disease monitoring data are used, several machine learning and optimization approaches were utilized to examine the effectiveness of the healthcare system. Thus, the primary research topics that emerge for cardiovascular/heart disease prediction are (1): How to efficiently manage varied volumes, velocities, and types of healthcare data? (2) Which machine learning or optimization approach is beneficial for managing a vast amount of healthcare data and efficiently identifying cardiovascular/heart illness within a patient's body? As a result, there is a need to create an intelligent healthcare framework employing machine learning or optimization techniques to handle a vast amount of healthcare data monitoring and to identify heart conditions rapidly and accurately.
The primary behavioral risk factors for heart disease and stroke include unhealthy eating habits, hazardous alcohol use, tobacco use, and physical inactivity. One of the leading environmental risk factors is air pollution. Because of behavioral risk factors, people may have high blood pressure, high blood sugar, high blood cholesterol, and be overweight or obese. These "intermediate risk factors" can be evaluated in primary care settings to identify an increased risk of stroke, heart failure, heart attack, and other outcomes [3].
Timely therapies can potentially avoid tragic results when persons at high risk for heart disease are identified early. As a result, there is increasing interest in predictive healthcare solutions that can determine a person's risk of developing heart disease before any clinical symptoms appear. A number of medical tests, including blood tests, electrocardiograms, echocardiograms, and stress tests, are typically used to diagnose cardiac disease. Despite their effectiveness, these techniques can be costly, time-consuming, and occasionally unavailable to patients in rural or undeveloped areas. Moreover, medical practitioners frequently depend on their expertise and judgment, which might be impacted by biases or human error. Innovative methods that can help with early heart disease diagnostics with greater accuracy and efficiency are therefore desperately needed.
Numerous research has been conducted to focus on the diagnosis of cardiac disease. They used several data mining approaches for diagnosis and obtained varied probabilities for each method. Spencer et al. [2] created unique feature sets using symmetrical uncertainty, ReliefF, and Chi-squared testing. Subsequently, a range of classification methods have been employed to generate models, which are subsequently juxtaposed to identify the ideal feature combinations and enhance the accuracy of heart condition prediction. The most accurate model had an accuracy of 85% on the datasets looked at and combined the BayesNet method with chi-squared feature selection.
Liu et al. [3] presented a heart disease categorization scheme using the ReliefF and Rough Set (RFRS) technique. Experiments were performed using the UCI database's Statlog (Heart) dataset. A jackknife cross-validation approach attained the most significant classification accuracy of 92.59%.
Khemphila and Boonjing [4] a feature selection method, a back-propagation learning technique, and a Multi-Layer Perceptron (MLP) with biological test results were developed as a classification strategy for diagnosing heart disease. Artificial neural networks are employed to categorize patient diagnoses. Eight characteristics remain after reducing thirteen. In the validation data set, accuracy is at 82%.
Albert et al. [5] suggested an optimized and balanced machine-learning system for cardiac disease identification. This approach uses oversampling methods, feature pruning, a CART decision tree classifier, and rule pruning via hyperparameter tuning to detect heart disease. It also highlights the critical factors that lead to the development of cardiac problems. The model attained an accuracy of 86.7% on the Statlog dataset.
In the study [6], neural network ensembles were utilized to diagnose cardiac disease. The suggested illness diagnostic approach made use of numerous distinct classifiers. They then pooled the findings of the separate classifiers to produce the final result. Their strategy was evaluated using the Cleveland heart disease dataset. They utilized 70% of the data for neural network training and 30% for model validation. They discovered that three neural network classifiers may get the highest prediction accuracy. Additionally, the study found that neural network ensembles outperform single learning approaches like Naïve Bayes and Logistic Regression. Their technique accuracy was around 89.01%.
Weng et al. [7] evaluated naive Bayes, KNN, decision trees, and bagging as four distinct classification methods using the Cleveland heart disease dataset. Instead of selecting the most statistically significant aspects using an algorithm; the features were chosen according to their subject expertise. This strategy, they discovered, optimized the accuracy of their naive Bayes and KNN models but reduced the accuracy of their decision tree and bagging models. They used the KNN technique and resampled the original dataset to create their most accurate model, which had an accuracy of 79.2%.
In this work, the data is first preprocessed, and missing values are filled with mean values. Then, data is scaled using standard scaler, and the proposed hybrid PCA and BHHO are applied to select the best features. RF and logistic regression are employed to classify the patients as heart disease patients or not.
Table 1 demonstrates a brief description of proposed and related work.
Table 1. A description of a previous works
|
Reference |
Approach |
Dataset |
Limitation |
|
[3] |
RFRS |
statlog |
- |
|
[4] |
MLP |
Cleveland |
data preprocessing |
|
[5] |
smote & BOML algorithm |
statlog |
didn’t handle irrelevant features |
|
[6] |
NN |
Cleveland |
didn’t handle irrelevant features |
|
[7] |
KNN |
Cleveland |
didn’t handle irrelevant features |
This article makes the following contributions:
In consideration of the effectiveness and robustness of the proposed hybrid PCA and BHHO algorithm and compared with Boruta with RF algorithm.
After analyzing the dataset, we develop a hybrid model to classify heart disease. The model is evaluated on UCI Cleveland Heart disease and Statlog dataset. And then performance is tested utilizing accuracy.
The paper is arranged as follow: section 2 illustrates Methodology, section 3 demonstrates proposed method, results and discussion demonstrated in section 4, and conclusion in section 5.
2.1 Dataset
The University of California, Irvine (UCI) provided the Cleveland dataset (UCI, 1990), which comprises four separate datasets related to heart disease, for this investigation. Six of the 303 patient data instances in it contain missing values. There are six cases of missing items in the Cleveland Heart Disease dataset. The presence (num = 1 or 2 or 3 or 4) and absence (num = 0) of the heart illness were the two classifications into which the diagnosis characteristic (num) for heart disease was divided. Class distributions showed that 54% of participants did not have heart disease, and 46% did [8]. Table 2 illustrates Cleveland dataset.
Table 2. Cleveland heart disease dataset [8]
|
Parameter Name |
Description |
|
SEX |
FEMALE=0, MALE1 |
|
EDUCATION(CONTINOUS) |
HIGHSCHOOL=1, GED=2, VOCATIONALSCHOOL=3,4=COLLEGE |
|
AGE(CONTINOUS) |
AGE |
|
CIGERATE PERDAY(CONTINOUS) |
NO. OF. CIGRATES |
|
CURRENT SMOKER |
1=YES,2=NO. |
|
PREVELANTSTROKE |
1=YES,2=NO |
|
BP MEDS(NOMINAL) |
1=YES,2=NO |
|
DIABETES |
1=YES,2=NO |
|
PREVELANT HYP(NOMINAL) |
1=YES,2=NO |
|
TOTCHOL |
TOTAL COLESTROL LEVEL |
|
SYSBP |
SYSTOLIC BLOOD PRESSURE |
|
DIA BP |
DIASTOLIC BLOOD PRESSURE |
|
BMI |
BODY MASS INDEX |
|
GLUCOSE |
LEVEL OF CLOCOSE |
|
HEART RATE |
PULSE RATE |
|
TEN YEAR CHD |
1=YES,2=NO (coronary heart disease risk) |
There are 14 characteristics and 270 samples in the Statlog dataset (Table 3) [9]. These characteristics are comparable to Cleveland's. The dataset has no missing values, and 150 samples are part of groups 0 (healthy patients) and 1 (disease patients).
Table 3. Statlog heart disease dataset [9]
|
Parameter Name |
Description |
|
GENDER |
FEMALE=0, MALE=1 |
|
CHEST PAIN TYPE |
1=TYPICAL ANGINA,3=NONANGINAL,2=ATYPICAL ANGINA |
|
AGE |
AGE |
|
RESTING BLOOD PRESSURE |
94-200 |
|
SERUM CHOLESTROL |
126-256 |
|
RESTING |
1=ST.T WAVE,0=NORMAL. |
|
FASTING BLOOD SUGAR |
0=FALSE, TRURR |
|
ELECTROCARDIOGRAPHIC RESULT |
ABNOMALITY 2=LEFT VENTRICULAR HYPERTROPHY |
|
MAXIMUM HEART RATE |
71 TO 200 |
|
EXSERSICSE INDUCED ANGINA |
1=YES,0=NO |
|
OLD PEAK |
0-6.2 |
|
SLOPE OF PEAK EXERSISE ST SEGMENT |
2=FLAT,1=UPSLOPING,3=DOWNSLOPPING |
|
NO. OF MAJOR VESSELS |
0-3 |
|
DEFECT TYPE |
6=FIXED DEFECT,3=NORMAL,7=REVERSIBLE DEFECT |
|
CLASS |
0=ABSENSE,1=PRESENSE |
2.2 Boruta algorithm
The RF classification approach is the foundation of the Boruta algorithm. Random Forest uses a Z-score to determine the important scores. The Z-score must be revised to determine a feature's importance appropriately. In addition, we require additional criteria to distinguish between significant aspects and those that do not concern the dependent variable. The Boruta algorithm is required in this situation. It makes an effort to compile every intriguing and relevant aspect. The following stages are how it operates [10, 11]:
•Initially, it generates shadow features, sometimes called permuted copies, duplicates of the original features with randomly fixed values. The dataset now includes these features.
•After that, all of these characteristics are used to train the model. The importance of each feature is then determined by computing the feature importance measure, also known as mean decrease accuracy. The greater its worth, the greater its significance.
•The value of the Z-score is assessed. It determines if a true characteristic is more essential than the best of its shadow features at every iteration. Whether a feature's Z-score exceeds the highest Z-score of its shadow features determines this. The dataset's irrelevant characteristics are eliminated, which lowers the model's performance.
•As such, the elements that remain are rejected and significant. The set number of random forest runs can be increased if any remaining questionable features exist.
2.3 Binary Harris hawks optimizer
HHO is a cutting-edge optimizer miming the movements and responses of a hawk and rabbit's hunting process. As demonstrated in the HHO original work, this optimizer's fundamental mathematical underpinnings enable it to effectively handle various restricted and unconstrained situations [12].
The primary method used by Harris hawks to pursue prey is the "surprise pounce," sometimes referred to as the "seven kills" approach. This is a cunning approach where some hawks shift to attack from different angles while simultaneously focusing on one animal that is thought to be running away from the covering. This attack can be finished swiftly by stopping the stunned target in seconds, but the "seven kills" might consist of many fast rushes near the target over minutes, depending on the target's ability to flee [13].
2.3.1 Exploration-phase
During this stage, two techniques are used to update the Hawks search agents, with each strategy having an equal chance of being chosen. In HHO, agents perch in random locations (tall trees) or about the positions of the prey and other close individuals. Eq. (1) provides a mathematical formulation of these tactics [13-15].
$\begin{array}{cc}A(t+1)= \left\{\begin{array}{l}A_{r n d}(t)-r d_1\left|A_{r n d}(t)-r d_2 A(t)\right| & p \geq 0.5 \\ \left(A_{h t d}(t)-A_{\text {avg }}(t)\right)-r d_3\left(L_{b n d}+r d_4\left(U_{b n d}-L_{b n d}\right)\right) & p<0.5\end{array}\right.\end{array}$ (1)
where A(t+1) presents the vector of hawk position in iteration t, A(t) indicates the vector position of hawk, $A_{h t d}(t)$ is the location of hunted rabbit. p, rd1, rd2, rd3, and rd4 are random numbers in range (0,1). $L_{b n d}$ and $U_{b n d}$ are lower and upper bound. The mean position of the current generation of individuals, which can be calculated using Eq. (2).
$A_{\text {avg }}(t)=\frac{1}{M} \sum_{i=1}^M A_i(t)$ (2)
where, M refers to entire number of hawks, $A_i(t)$ indicates the location of each hawk at iteration t.
2.3.2 Exploration to exploitation transition
Generally speaking, an algorithm needs a proper method to transition from exploration to exploitation to balance the fundamental searching behaviours. In HHO, this portion of the search process is controlled by the vanishing energy of the prey, which is reduced by the escaping behaviour. Eq. (3) is used to formulate the energy of the escaping prey.
$P=2 P_O\left(1-\frac{t}{T_{\max }}\right)$ (3)
where, $T_{\max }$ is maximum iteration, P indicates the power of rabbit run-out.
2.3.3 Exploitation phase
In this phase, the Harris’ hawks perform the surprise pounce (seven kills as called in the study [15]). By launching an assault on the target identified in the earlier stage. On the other hand, prey frequently try to get away from hazardous circumstances. As a result, many pursuit techniques are used in actual circumstances. Four potential strategies are suggested in the HHO to mimic the attacking stage based on the tactics of pursuing Harris' hawks and the victim's evasive actions. Prey always has a natural tendency to flee from hazardous conditions. The notation rd indicates the chance to flee; if the target escapes successfully, rd<0.5; otherwise, rd>=0.5.
If p≥0.5 and rd≥0.5 that means the prey has high energy, and utilizing some haphazard tricky rebounds to run away but last, it can't. Meanwhile the Harris`s hawks (HH) surround it to make the prey tired and the perform the ''surprise pounce". The action modeled as Eqs. (4) and (5).
$A(t+1)=\Delta A(t)-P\left|K A_{h t d}(t)-A(t)\right|$ (4)
$\Delta A(t)=A_{h t d}(t)-A(t)$ (5)
where, $\Delta A(t)$ is the difference between current position and the hawk's position vector. The arbitrary bounce force is $K=2\left(1-r d_5\right)$.
At this point, p≤0.5 and rd≥0.5, indicating that the prey is quite tired and exhibiting some runaway energy. In addition, HH closely surrounds the intended victim to execute the "surprise pounce finally". As a result, the present location is changed using Eq. (6).
$\Delta A(t+1)=A_{h t d}(t)-P\left|\Delta A_{h t d}(t)\right|$ (6)
where, P is greater than or equal to 0.5, and rd is less than 0.5, the prey has sufficient energy to flee; thus, establishing a soft blockage before the "surprise pounce" makes this strategy superior to the others. The equation below is used to execute the soft:
$B=A_{h t d}(t)-p\left|K A_{h t d}(t)-A(t)\right|$ (7)
They hypothesized that the hawks would plummet based on the LF-based shapes using the following law:
$C=B+S_{r d m} \times L F(G)$ (8)
where, G is the problem space, LF is levy flight function, and $S_{r d m}$ is arbitrary vector of size $1 \times F$.
$L F(\alpha)=0.01 \times \frac{l \times \mu}{|m|^{\frac{1}{\alpha}}} \cdot \alpha=\left(\frac{\theta(1+\alpha) \times \sin \left(\frac{\pi \alpha}{2}\right)}{\theta\left(\frac{1+\alpha}{2}\right) \times \alpha \times 2\left(\frac{\alpha-1}{2}\right)}\right)^{\frac{2}{\alpha}}$ (9)
where, l and m are arbitrary values in (0,1), and ɑ is the default constant adjusted to 1.5.
The final method for altering hawk positions during the soft blockage stage.
$A(t+1)=\left\{\begin{array}{l}B \text { if } F(B)<F(A(t)) \\ C \text { if } F(C)<F(A(t))\end{array}\right.$ (10)
where, B and C are got by Eqs. (7) and (8), respectively.
When p<0.5 and rd<0.5, the prey lacks the energy to flee, resulting in a hard blockage before the "surprise pounce" to catch and kill the animal. This phase on the prey side is identical to the soft blockade, except the hawks try to minimize the distance between their average location and the fleeing prey. Thus, the following are employed in the hard blockage case:
$A(t+1)=\left\{\begin{array}{l}B \text { if } F(B)<F(A(t)) \\ C \text { if } F(C)<F(A(t))\end{array}\right.$ (11)
where, B and C are extracted using Eqs. (12) and (13).
$B=A_{h t d}(t)-p\left|K A(t)-A_n(t)\right|$ (12)
$C=B+S_{r d m} \times L F(G)$ (13)
The pseudo code of HHO algorithm is listed below.
|
Pseudocode of HHO |
|
Input: N demonstrated the population size, T is iteration Output: The fitness value and the position of the hunted rabbit. Randomly initialize the population Ai While (stopping condition is not met) do Calculate the fitness values of hawks Set the Ahtd as the position of best hunted rabbit FOR (each hawk) do Update the bounce force K and the initial power p0 Use Eq. (3) to update P If (|p| ≥ 1)then Uue Eq. (1) to update the position vector If (|p| < 1)then If (rd ≥ 0.5 and |p| < 0.5) then Uue Eq. (4) to update the position vector else If (rd < 0.5 and |p| < 0.5) then Uue Eq. (6) to update the position vector If (rd < 0.5 and |p| ≥ 0.5) then Uue Eq. (10) to update the position vector If (rd < 0.5 and |p| < 0.5) then Uue Eq. (11) to update the position vector Return best position (Ahtd) |
2.4 Logistic regression algorithm
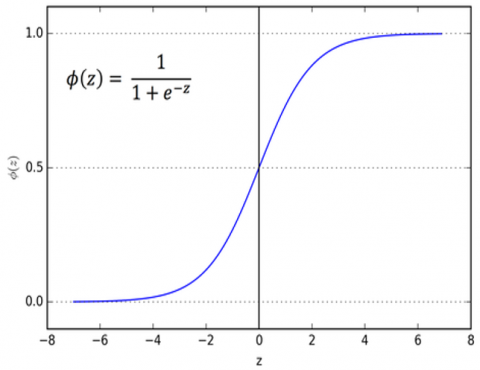
In machine learning classification algorithms, logistic regression analyzes datasets with categorical dependent variables (DVs) as well as independent variables (IVs) [16]. Linear regression provides continuous numerical output, but logistic regression uses the logistic sigmoid function to yield a probability value that may be assigned to two or more discrete classes [17].
The cost function is limited using logistic regression to a range between 0 and 1. Eq. (14) yields a probability estimate between 0 and 1, where z represents the function's input and e denotes the natural log's base [18, 19].
$\sigma(z)=\frac{1}{1+e^{-z}}$ (14)
The provided data set shows that 1 denotes a high risk of coronary heart disease during the next ten years, whereas 0 denotes no risk at all. The logistic model's independent variables are as x1, x2, …, xn [19].
Figure 1. Logistic regression [19]
This is accomplished by using the log odds of the occurrence ln(P/1−P), where P is the probability of the event that represents the CHD risk. P always falls between 0 and 1, as a result.
The formula has two inputs, z and e, which are natural log bases. Input is z, and output is between 0 and 1 (probability estimate). Figure 1 demonstrates the logistic regression [19].
In the provided data set, a value of 1 denotes a high risk of coronary heart disease during the next ten years, whereas a value of 0 denotes no heart risks at all. The logistic model's independent variables are represented as x1, x2, x3, ..., and xn [19].
$\log \left(\frac{p}{1-p}\right)=\beta_0+\beta_1 x_1+\beta_2 x_2 \ldots \ldots+\beta_n x_n$ (15)
Logistic regression attains this by taking the log odds of the event ln(P/1−P), where P represents the probability of the event being related to coronary heart disease. Therefore, P always in range (0 and 1).
2.5 Random forest (RF)
Basic classifiers in RF are hierarchical and tree-structured. The dimensions of text data are often very large. There are a lot of unnecessary features in the dataset. Only a few significant features are helpful for the classifier model. By using a simple fixed probability, the RF algorithm determines the most relevant feature [20, 21]. By mapping a random sample of feature subspaces to the RF technique, Breiman built a number of decision trees based on sample data subsets. The RF algorithm connected with a collection of training documents D and Nf attributes can be demonstrated as bellow [22, 23]:
-First, a predefined probability sample of D1, D2, ... DK was taken with replacement.
Create a decision tree model for every document that DK has. Utilizing its subspace of the m-try dimension, the training papers are randomly selected from the available features. Determine every conceivable probability using the m-try characteristics. The leaf node generates the optimal data split. A procedure will be carried out repeatedly until the saturation threshold is met.
Utllize the high probability value to determine the classification outcome after combining the K number of unpruned trees, h1(X1), h2(X2), … into the RF.
2.6 Evaluation metrics
Accuracy used to determine the most effective model for forecasting individuals with heart disease. The metrics were calculated as [24, 25]:
$Accuracy =\frac{T P R+T N R}{T P R+T N R+F P R+F N R}$ (16)
The model proposed uses a Different feature selection algorithm to select the optimal features. Boruta is a wrapper feature selection algorithm used with RF and Binary Harris Hawks Optimizer (BHHO). Hybrid BHHO and PCA are proposed and compared with the Boruta algorithm. Two datasets are used to test the system: Statlog heart disease dataset and the UCI Cleveland dataset. The proposed hybrid PCA and BHHO diagram is illustrated in Figure 2.
Figure 2. Proposed hybrid PCA-BHHO method
The data is first preprocessed, and missing values are filled with mean values. Then, data is scaled using standard scaler, and the proposed hybrid PCA and BHHO are applied to select the best features. RF and logistic regression are employed to classify the patients as heart disease patients or not.
At the preprocessing step the dataset is first checked for missing values and records with missing values is removed. The dataset is scaled using standard scaler. Then PCA is applied and the best features is selected. The features selected from PCA is forwarded to the BHHO to obtain the optimal features. The RF classifier is utilized to evaluate the population to obtain the best subset. At the classifier step the LR and RF are applied. Accuracy is used to evaluate the proposed system. Then proposed system is compared with Boruta-RF algorithm.
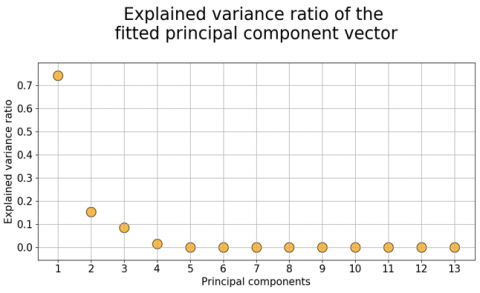
At the preprocessing step the UCI-Cleveland dataset is examined for missing values 6 records are removed. Heart Statlog dataset is examined for missing values and filled missing values with mean. The dataset is scaled using the Standard scaler. Then PCA is applied. The PCA results are illustrated in Figure 3.
Figure 3. Explained variance ratio of principal component vector for Statlog dataset
Figure 4. Fitness of proposed HHO-algorithm of Statlog dataset
In PCA, the highly correlated features are kept together to transform the data into a lower-dimensional space. PCA is computed by first normalizing data, computing a Covariance matrix, Eigenvectors, and eigenvalues, and then sorting features based on eigenvalues. In this work, we first apply PCA as a filter feature selection method and select the best features. Then, the dataset with selected features is forwarded to the wrapper feature selection BHHO algorithm to perform a hybrid PCA-BHHO algorithm. The least irrelevant feature is removed by using PCA as a filter method before performing the BHHO algorithm, which enhances computational efficiency and increases system performance.
The last feature based on PCA results is removed then results is fed to the BHHO algorithm. The HHO algorithm parameters are set as number of iterations is 100, beta is 1.5, and threshold is 0.5. Figure 4 demonstrates the fitness function of the BHHO algorithm.
The proposed PCA-HHO algorithm is achieved an accuracy of 90.14%. Nine features are selected and they are trestbps, fbs, thalach, restecg, slope, old peak, Thal, Chol, and Ca.
The PCA results of heart disease dataset is demonstrated in Figure 5. The result of proposed PCA-HHO algorithm is achieved an accuracy of 89.33%. Nine features are selected and they are CP, trestbps, thalach, restecg, slope, old peak, Thal, Chol, and Ca. Figure 6 demonstrates the fitness function of the BHHO algorithm.
Figure 5. Explained variance ratio of principal component vector for Cleveland heart disease dataset
Figure 6. Fitness of proposed HHO-algorithm Cleveland heart disease dataset
Boruta algorithm with RF are used on Statlog and Cleveland heart disease dataset and attained an accuracy of 90.14%, 87.64, respectively. Accuracy of proposed PCA-HHO algorithm and Boruta algorithm are demonstrated in Figure 7.
Comparison between related work and proposed model are demonstrated in Table 4.
For the Statlog dataset, the proposed PCA-BHHO algorithm achieved an accuracy of 92.59%, whereas Boruta and RF attained an accuracy of 90.14%. Liu et al. [3] used the RFRS technique and achieved an accuracy of 92.59%. Albert et al. [5] used the Smote & BOML algorithm and achieved an accuracy of 86.7%.
Figure 7. Comparison of proposed BHHO-algorithm and Boruta algorithm
Table 4. An accuracy comparison of model proposed with previous works
|
Reference |
Approach |
Statlog Dataset |
Cleveland Dataset |
|
[3] |
RFRS |
92.59% |
- |
|
[4] |
MLP |
- |
82% |
|
[5] |
Smote & BOML algorithm |
86.7% |
- |
|
[6] |
NN |
- |
89.01% |
|
[7] |
KNN |
- |
79.2% |
|
Ours |
Boruta and RF |
90.14% |
87.64% |
|
Proposed PCA-BHHO algorithm |
92.95% |
89.33% |
For the Cleveland dataset, Khemphila and Boonjing [4] used an algorithm and attained an accuracy of 82%. Das et al. [6] employed the NN algorithm for classification and achieved an accuracy of 89.01%. Weng et al. [7] utilized the KNN algorithm for classification and achieved an accuracy of 79.2%. The proposed PCA-BHHO algorithm achieved an accuracy of 87.64%, whereas the Boruta and RF algorithm attained an accuracy of 87.64%.
It comes to patient care, nurses are the experts. They are more knowledgeable about a patient's current state than medical professionals and hospital managers. They are the first to notice whether a patient's condition is getting worse or when they are in agony. Because of this, nurses must be able to solve problems and make decisions that affect patient outcomes. In nursing, clinical decision-making is an active process of evaluating a patient's status and making evidence-based decisions about their care. A group of medical professionals collaborate to analyze the situation and decide on the best course of action. To acknowledge patients as their own best advocates and authorities on their own physical and mental health requirements, clinical decision-making also involves patients and their families. It is useful to provide the nurses with a decision-making system to check the patients for suspicious in heart disease as a first step when check patients.
This research aims to facilitate the identification of cardiac disorders by employing a hybrid classification system that relies on the Binary Harris Hawks algorithm (BHHO) and the Logistic Regression technique. Also Boruta algorithm with random forest are used and compared with proposed PCA-BHHO algorithm. Two datasets are utilized to test the proposed model Statlog and Cleveland heart disease datasets. The proposed PCA-BHHO algorithm achieved an accuracy of 92.95%, 89.33% on Statlog and Cleveland dataset respectively. Whereas Boruta-RF algorithm achieved an accuracy of 90.14%, 87.64% on Statlog and Cleveland dataset respectively. The experimental results showed that the Boruta-RF algorithm achieved the best results with selected features (FF1, FF3, FF4, FF7, FF8, FF11, FF12) on the Statlog dataset, and the selected features for the Cleveland dataset are (FF1, FF3, FF4, FF7, FF8, FF11, FF12). In the future, the validation of results by clinicians needs to be addressed.
[1] Ramprakash, P., Sarumathi, R., Mowriya, R., Nithyavishnupriya, S. (2020). Heart disease prediction using deep neural network. In 2020 International Conference on Inventive Computation Technologies (ICICT), Coimbatore, India, pp. 666-670. https://doi.org/10.1109/ICICT48043.2020.9112443
[2] Spencer, R., Thabtah, F., Abdelhamid, N., Thompson, M. (2020). Exploring feature selection and classification methods for predicting heart disease. Digital Health, 6: 2055207620914777. https://doi.org/10.1177/2055207620914777
[3] Liu, X., Wang, X., Su, Q., Zhang, M., et al. (2017). A hybrid classification system for heart disease diagnosis based on the RFRS method. Computational and Mathematical Methods in Medicine, 2017(1): 8272091. https://doi.org/10.1155/2017/8272091
[4] Khemphila, A., Boonjing, V. (2011). Heart disease classification using neural network and feature selection. In 2011 21st International Conference on Systems Engineering, Las Vegas, NV, USA, pp. 406-409. https://doi.org/10.1109/ICSEng.2011.80
[5] Albert, A.J., Murugan, R., Sripriya, T. (2023). Diagnosis of heart disease using oversampling methods and decision tree classifier in cardiology. Research on Biomedical Engineering, 39(1): 99-113. https://doi.org/10.1007/s42600-022-00253-9
[6] Das, R., Turkoglu, I., Sengur, A. (2009). Effective diagnosis of heart disease through neural networks ensembles. Expert Systems with Applications, 36(4): 7675-7680. https://doi.org/10.1016/j.eswa.2008.09.013
[7] Weng, S.F., Reps, J., Kai, J., Garibaldi, J.M., et al. (2017). Can machine-learning improve cardiovascular risk prediction using routine clinical data? PloS One, 12(4): e0174944. https://doi.org/10.1371/journal.pone.0174944
[8] Heart Disease. https://archive.ics.uci.edu/dataset/45/heart+disease.
[9] Statlog (Heart). https://archive.ics.uci.edu/dataset/145/statlog+heart.
[10] Anand, N., Sehgal, R., Anand, S., Kaushik, A. (2021). Feature selection on educational data using Boruta algorithm. International Journal of Computational Intelligence Studies, 10(1): 27-35. https://doi.org/10.1504/IJCISTUDIES.2021.113826
[11] Gopal, P.M., Bhargavi, R. (2018). Feature selection for yield prediction in Boruta algorithm. International Journal of Pure and Applied Mathematics, 118(22): 139-144.
[12] Thaher, T., Heidari, A.A., Mafarja, M., Dong, J.S., et al. (2020). Binary Harris hawks optimizer for high-dimensional, low sample size feature selection. Evolutionary Machine Learning Techniques: Algorithms and Applications, pp. 251-272. https://doi.org/10.1007/978-981-32-9990-0_12
[13] Ibrahim, H.T., Mazher, W.J., Jassim, E.M. (2022). Feature selection: Binary Harris hawk optimizer based biomedical datasets. Inteligencia Artificial, 25(70): 33-49. https://doi.org/10.4114/intartif.vol25iss70pp33-49
[14] Heidari, A.A., Mirjalili, S., Faris, H., Aljarah, I., et al. (2019). Harris hawks optimization: Algorithm and applications. Future Generation Computer Systems, 97: 849-872. https://doi.org/10.1016/j.future.2019.02.028
[15] Jing, Z. (2014). Self-adaptive particle swarm optimization algorithm based on directed-weighted complex networks. Journal of Networks, 9(8): 2232-2238. https://doi.org/10.4304/jnw.9.8.2232-2238
[16] Christodoulou, E., Ma, J., Collins, G.S., Steyerberg, E.W., et al. (2019). A systematic review shows no performance benefit of machine learning over logistic regression for clinical prediction models. Journal of Clinical Epidemiology, 110: 12-22. https://doi.org/10.1016/j.jclinepi.2019.02.004
[17] Miguel-Hurtado, O., Guest, R., Stevenage, S.V., Neil, G.J., et al. (2016). Comparing machine learning classifiers and linear/logistic regression to explore the relationship between hand dimensions and demographic characteristics. PloS One, 11(11): e0165521. https://doi.org/10.1371/journal.pone.0165521
[18] Liu, L. (2018). Research on logistic regression algorithm of breast cancer diagnose data by machine learning. In 2018 International Conference on Robots & Intelligent System (ICRIS), Changsha, China, pp. 157-160. https://doi.org/10.1109/ICRIS.2018.00049
[19] Nishadi, A.T. (2019). Predicting heart diseases in logistic regression of machine learning algorithms by Python Jupyterlab. International Journal of Advanced Research and Publications, 3(8): 1-6.
[20] Speiser, J.L., Miller, M.E., Tooze, J., Ip, E. (2019). A comparison of random forest variable selection methods for classification prediction modeling. Expert Systems with Applications, 134, 93-101. https://doi.org/10.1016/j.eswa.2019.05.028
[21] Kullarni, V.Y., Sinha, P.K. (2013). Random forest classifier: A survey and future research directions. International Journal of Advanced Computing, 36(1): 1144-1156.
[22] Jackins, V., Vimal, S., Kaliappan, M., Lee, M.Y. (2021). AI-based smart prediction of clinical disease using random forest classifier and Naive Bayes. The Journal of Supercomputing, 77(5): 5198-5219. https://doi.org/10.1007/s11227-020-03481-x
[23] Parmar, A., Katariya, R., Patel, V. (2019). A review on random forest: An ensemble classifier. In International Conference on Intelligent Data Communication Technologies and Internet of Things (ICICI) 2018, Coimbatore, India, pp. 758-763. https://doi.org/10.1007/978-3-030-03146-6_86
[24] Saeed, N.A., Al-Tai, Z.T.M. (2019). Feature selection using hybrid dragonfly algorithm in a heart disease predication system. International Journal of Engineering and Advanced Technology, 8(6), 2862-2867. https://doi.org/10.35940/ijeat.F8786.088619
[25] Saeed, N.A., Al-Ta’i, Z.T.M. (2020). Heart disease prediction system using optimization techniques. In New Trends in Information and Communications Technology Applications (NTICT), Baghdad, Iraq, pp. 167-177. https://doi.org/10.1007/978-3-030-55340-1_12