Louay A. Mahdi*![]() | Hayder M. Ali
| Hayder M. Ali![]() | Muna K. AL-naame
| Muna K. AL-naame![]() | Ali Oodaaabd
| Ali Oodaaabd![]() | Waleed K. Alani
| Waleed K. Alani![]() | Salman H. Omran
| Salman H. Omran![]() | Hasanain A. Abdul Wahhab
| Hasanain A. Abdul Wahhab![]()
© 2023 IIETA. This article is published by IIETA and is licensed under the CC BY 4.0 license (http://creativecommons.org/licenses/by/4.0/).
OPEN ACCESS
In vapor compression refrigeration systems, refrigerants are among the most significant parameters additional to the compressor, condenser, throttling device, and the evaporator. Non-condensable gases during refrigerant manufacturing affect chest freezer performance. The temperature of the refrigerant in the condenser and evaporator is influenced by the quality of the refrigerant and its concentration. To study this effect this work is carried out on a chest freezer working with R-134a, which has a capacity of 145 liters. A high percentage of non-condensable gases in samples 3 and 6 increases the temperature of the refrigerant condenser, increases the electricity consumption, and decreases the temperature of the refrigerant flow in the evaporator. This blocks the circulation of refrigerant throughout the system and for a long time the compressor may be damaged. Samples 2,4,5 which contain low non-condensable gases work similarly to standard sample 1 with a low effect on power and refrigerant circulation, so cooling capacity is not affected.
non-condensable gases, chest freezer, power consumption, vapor compression refrigeration system
The households consume in hot regions such as Iraq for a variety of purposes, including cooling and freezing food products, drinking water, and heating and cooling rooms. Almost all of these applications work with electricity, and keeping the levels of consumption low can be achieved by selecting all the main components from trusted brands, including pure refrigerants.
When the vapor temperature is reduced below its saturation temperature, condensation occurs. Many engineering applications rely on condensation to remove heatWithin the operating temperature range of a refrigeration system, non-condensable gases do not condense into liquids. The condensing vapor receives significantly less heat transfer when even a small amount of non-condensable gas exists.
Gases that cannot condense diffuse at the interface between liquids and gases and accumulate there. There can be a great deal of cooling at the interface depending on the amount of noncondensable gas present, consequently, the heat transfer coefficient would be lower. Furthermore, there will be an increase in condensing pressure due to non-condensables in the system, high side pressure fluctuations may also be caused by them. Consequently, higher compression ratios decrease cooling capacity and efficiency.
The subcooled rejoin at the end of the condenser will prevent non-condensable gases from leaving the condenser. This will cause a reduction of condensing surface area in additional to cause high condensing pressures.
The non-condensable gas release in evaporators that is cause a heat transfer reduction. As a result of the non-condensable gases, tubes in the evaporator are insulated, which reduces the transfer of heat.
A theoretical method to calculate condensation heat transfer in the presence of a noncondensable gas was developed by Sparrow and Lin [1], which theoretically predicted a method to calculate condensation heat transfer.
In a vapor compression refrigeration system for example a chest freezer performs well when the refrigerant used is pure [2, 3]. When non-condensable gas such as air, volatile impurities, solid particles, acids, or chloride appear with circulating refrigerant, the system becomes unstable. The AHRI standard-700 determines that non-condensable gases can contain of the refrigerant charge up to 1.5% by volume at 25℃ for R-134a [4]. Reports indicate the refrigerant manufacturer created different percentages of non-condensable gases in refrigerants, which caused deviations in the working temperatures of the vapor compression refrigeration system (the condenser and evaporator working temperatures) and increased power consumption. Tsuruta and Naka [5] studied the one-dimensional condensing flow of water vapor. They found that the condensing flow causes an accumulation of non-condensing gas near the liquid surface, which increases resistance to heat flow and reduces condensation heat transfer rate. Cecchinato et al. [6, 7] investigated the vapor compression refrigeration system by adding air to the refrigeration cycle. The thermal and electric variables can be analyzed experimentally in different modes. By increasing the condensing pressure and decreasing the evaporator pressure, the existence of non-condensable gases in the vapor compression refrigeration system contributes to energy efficiency loss. Li et al. [8] created algebraic equations to represent heat transfer and mass transfer in condensation and compared the algebraic solution results with experimental results. Espindola et al. [9-11] studied the influence of non-condensable gases on household refrigerator behavior using nitrogen injected into the system. The steady-state energy consumption was measured at different compressor speeds of 2500, 3000, and 4000 RPM. When the nitrogen mass fraction was very low, system performance was not affected. Large fluctuations were seen in the flow pattern at the capillary tube inlet when the nitrogen mass fraction increased which effected system performance. Lee et al. [12] studied the condensation of non-condensable gases during an accident at a nuclear power plant. Zine-Dine et al. [13] investigate the effect of the non-condensable gas numerically in a vapor mixture of water-gas. Zhang et al. [14] conducted experimentally to investigate the influences of non-condensable gas on the condensation heat transfer process. Shamsabadi et al. [15] simulate the condensation in a convergent three-dimensional channel numerically in the presence of non-condensable gases simulate the condensation in a convergent three-dimensional channel numerically in the presence of non-condensable gases. Bérut et al. [16] Experimentally study the effect of non-condensable gas on the hollow fins fixed to a vapor chamber using IR temperature measurements and performance monitoring over time Technique.
Prior studies were conducted on refrigerators, where -8℃ cut-in and -12℃ cut-in temperatures were used. This study attempts to clarify specifically the effect of non-condensable gases on the performance of chest freezers where the set operation temperature of the evaporator box is -13℃ and the cut-out temperature is -16℃. That means operation problems increase such as refrigerant circulation blockages and power consumption increases.
2.1 Test rig
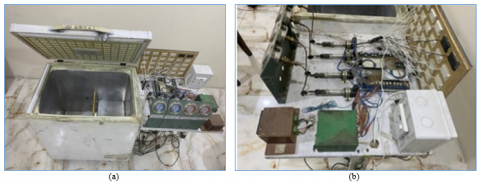
Experimental tests were conducted on a chest freezer with a volume of 145 liters (Figure 1a and b) after modification to be a laboratory apparatus. For the evaporator, 15 m long circuits were used, and copper tubes with a diameter of 7.937 mm were used in the freezer. A capillary tube is welded outside the compressor suction line. The condenser is a wire-on-tube condenser with a total length of 10.5 m and an inner tube diameter of 6.35 mm. Wire fins of 1.2 mm diameter join the outside condenser tubes on each side. The condenser heat exchanger is painted black to improve heat transfer through natural convection and radiation. The compressor is a Konor GQR60AA model, and ester oil lubrication was applied. The tests were conducted in a climatic room at 32℃ according to IEC 62552 standards [17]. The samples of refrigerant used are detailed in Table 1.
Table 1. The kind of refrigerants used in the tests
|
Freon |
Standard AHRI 700-2017 for R-134a |
Sample 1 |
Sample 2 |
Sample 3 |
Sample 4 |
Sample 5 |
Sample 6 |
|
Product Name |
134a |
ONE PARIS only |
Du point |
Frio |
ONE PARIS and air |
ONE PARIS and air |
ONE PARIS and air |
|
Chemical Name |
1,1,1,2 - Tetrafluoroethane |
||||||
|
Purity |
|
99.8 % w. |
99.8% w. |
99.8% |
99.8 % w. |
99.8 % w. |
99.8 % w. |
|
Water content |
10 ppm by w. |
max. 8 ppm w. |
1 g/l at 25℃ |
50 ppm w. |
max. 8.1 ppm w. |
max. 8.4 ppm w. |
max. 8.5 ppm w. |
|
High boiling residue |
0.01 by volume |
max. 0.01 % vol. |
---------------- |
0.01 % vol. |
max. 0.01 % vol. |
max. 0.01 % vol. |
max. 0.01 % vol. |
|
Acidity |
1 ppm by weight |
1 ppm w. |
1.06 ppm w. |
1 ppm w. |
1 ppm w. |
1 ppm w. |
1 ppm w. |
|
Air and other non-condensable gas |
1.5% by volume at 25 C |
max. 1 % vol. |
1.5% |
4% vol. |
max. 2 % vol. |
max. 2.5 % vol. |
max. 3 % vol. |
|
weight charge |
|
105 grams |
97 grams |
130 grams |
|
|
|
Figure 1. The chest freezer: (a) the body test apparatuse and (b) the measuring devices
2.2 Measurement system
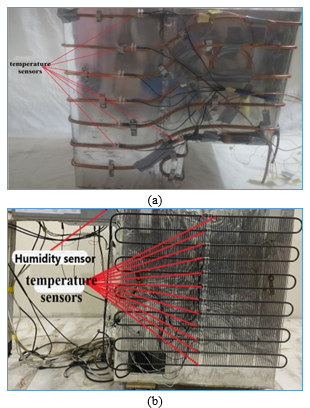
The temperatures of the condenser and evaporator are recorded using thermocouples (type t). the thermocouple accuracy is ±1℃. to record temperature changes. Thirteen thermocouples were placed on the tube surface of the condenser and seven on the evaporator as shown in Figure 2a and b. The pressures were measured at the discharge of the compressor, the end of the wire-on-tube condenser before the filter-dryer, at the inlet to the evaporator, and at the compressor suction by four transducers. also, four pressure gauges are used to confirm that the same points are being checked. transducer accuracy is 0.5%, while gauge accuracy is 1%. electrical power consumption was measured by a power analyzer measurement system with an accuracy of ±3%, for the current, ±2%, and for the voltage, ±1.2%.
Figure 2. The location of the thermocuples in: (a) evaprator and (b) wire on tube condenser respectivly
For more details about the design of the freezer, measuring devices and the its calibrations, and the testing procedure, please review the study [18]. The current research done by this testing rig separately.
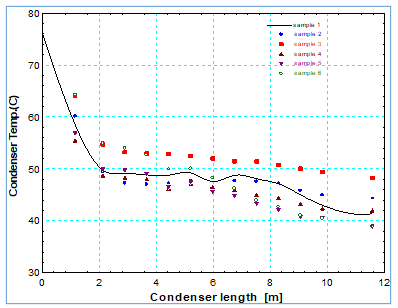
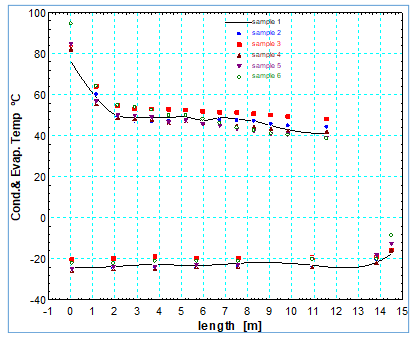
The refrigerant temperature along the wire-on-tube condenser length shows Figure 3. Sample 1 represents the standard refrigerant's work. Samples 3, 5, and 6 contain high percentages of non-condensable gases, which lead to significant deviations from sample 1. While samples 2, and 4, which contain low non-condensable gas percentages and as shown in Table 1 are close to the required percent of 1.5%, perform similarly to sample 1 which is mach the standard requirement. The first group of samples (3, 5, and 6) shows different behavior. Sample 3 causes an increase in the condenser pressure due to the higher containment of condensable gases at 4% by volume. This leads to an increase in the saturation temperature, pressure ratio for the system, energy consumption, and a blockage of the refrigerant circulation. In samples 5 and 6, the percentage of non-condensable gases are 2.5% and 3%, working below the required temperature. For first aid, this behavior is acceptable, but we must see the effect on the evaporator temperature and the overall system.
Figure 3. The condensing temperature and the length of wire on the tube condenser
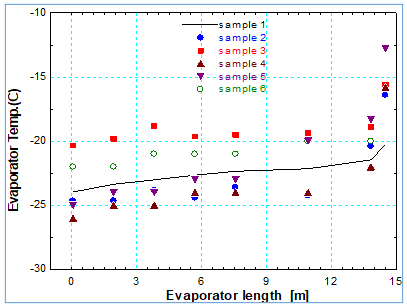
Non-condensable gases in sample 4 cause a large departure in the refrigeration evaporator temperature (sample 1), while samples 2 and 5 work close to sample 1, as shown in Figure 4 in this group. If the vapor freezes in the capillary tube, the possibility of blocking refrigerant circulation increases, which can result in damage to the compressor. It was found that samples 3 and 6 raised above the evaporator temperature (sample 1), which is unacceptable due to the effects on meat preservation.
Figure 4. The evaporating temperature and the length of the evaporator
The condenser and evaporator temperatures were combined in one plot, as shown in Figure 5. This was done to clarify the deviation from standard sample 1 for the vapor compression refrigeration system.
Samples 3 and 6 have the highest percentage of non-condensable gases, while others show poor troubleshooting, namely high power consumption and a blockage of refrigerant flow. The samples 2, 4, and 5 behavior seems similar to the standard sample 1, which indicates that there is a low effect of the non-condensable gases on the performance of the vapor compression refrigeration system.
Figure 5. The relation between the condenser and evaporator temperature and the length
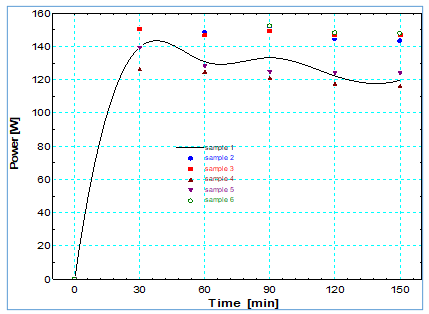
The relation between power consumption and time in the pull-down state is shown in Figure 6. The power increases in the first 30 minutes up to 140 W, then gradually decreases to 120 W for standard sample 1. For samples 3 and 6, which contain non-condensable gases in high percentages, the system needs more power to cover the increased pressure in the condenser. Other samples performed close to the standard requirement due to less impact of low percentages of non-condensable gases.
Figure 6. The relation between power and time
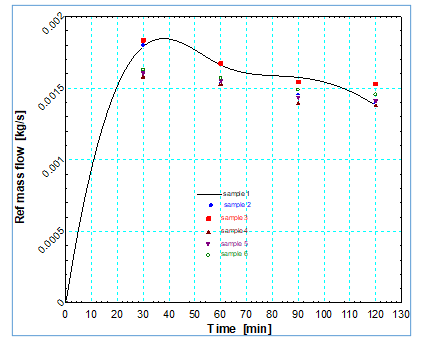
Figure 7 illustrates the refrigerant mass flow rate and time for samples used in this study. As the pressure ratio of the system increases, the refrigerant mass flow rate is reduced, which has a detrimental effect on the cooling capacity of the system.
Figure 7. The refrigerant mass flow rate and the time
A chest freezer with standard refrigerant quality R-134a along with refrigerant containing non-condensable gases with varying percentages was tested, and a significant penalty was assessed. The first penalty represents an increase in power consumption, which costs money. The second affects the evaporator temperature, which affects the ability to preserve food. It finally blocks the refrigerant circulation path by freezing moisture in the capillary tubes.
Additionally, the onset of non-condensable gases reduces the condensation heat transfer process that affects the refrigerant state at the end of the condenser, where the refrigerant state is stiff, causing the throttling device to have less capacity by avoiding the refrigerant flow path, resulting in a flooded condenser and starved evaporator, which results in a decrease in system performance.
[1] Sparrow, E.M., Lin, S.H. (1964). Condensation heat transfer in the presence of a noncondensable gas. Journal of Heat Transfer, 86(3): 430-436. https://doi.org/10.1115/1.3688714
[2] Ali, H.M., Mahdi, L.A. (2023). Exergy analysis of chest freezer working with R-134a and R-600a at steady state conditions. International Journal of Energy Production and Management, 8(2): 63-70. http://doi.org/10.18280/ijepm.080202
[3] Mahdi, L.A., Mohammad, W.S., Mahmood, S.A. (2018). Exergy analysis of a domestic refrigerator. Journal of Engineering, 9(24).
[4] AHRI Standard-700. A. (2019). Specifications for Refrigerants.
[5] Tsuruta, T., Naka, Y. (2003). Effect of noncondensable gas on experimental condensation coefficient. JSME International Journal Series B Fluids and Thermal Engineering, 46(4): 557-562. https://doi.org/10.1299/jsmeb.46.557
[6] Cecchinato, L., Dell'Eva, M., Fornasieri, E., Marcer, M., Zilio, C. (2004). The effects of non-condensable gases in household refrigerators. In International Refrigeration and Air Conditioning Conference, Purdue, USA, pp.1-8.
[7] Cecchinato, L., Dell'Eva, M., Fornasieri, E., Marcer, M., Monego, O., Zilio, C. (2007). The effects of non-condensable gases in domestic appliances. International Journal of Refrigeration, 30(1): 19-27. https://doi.org/10.1016/j.ijrefrig.2006.04.002
[8] Li, J., Saraireh, M., Thorpe, G. (2011). Condensation of vapor in the presence of non-condensable gas in condensers. International Journal of Heat and Mass Transfer, 54(17-18): 4078-4089. https://doi.org/10.1016/j.ijheatmasstransfer.2011.04.003
[9] Espíndola, R.D.S., Knabben, F.T., Melo, C. (2016). The influence of non-condensable gases on the thermal-acoustic behavior of household refrigerators. In 16th International Refrigeration and Air Conditioning Conference, Purdue, USA, pp. 1-9
[10] Espíndola, R.S., Knabben, F.T., Boeng, J. (2018). Non-condensable gases and their effect on the dynamic behavior of domestic refrigerators. In 17th International Refrigeration and Air Conditioning Conference, Purdue, USA, pp. 1-8.
[11] Espíndola, R.S., Knabben, F.T., Melo, C., Hermes, C.J. (2020). Performance evaluation of household refrigerators running with R600a contaminated with non-condensable gases. International Journal of Refrigeration Efrigeration, 111: 86-93. https://doi.org/10.1016/j.ijrefrig.2019.11.032
[12] Lee, J., Park, G.C., Cho, H.K. (2018). Simulation of wall film condensation with non-condensable gases using wall function approach in component thermal hydraulic analysis code CUPID. Journal of Mechanical Science and Technology, 32: 1015-1023. https://doi.org/10.1007/s12206-018-0202-0
[13] Zine-Dine, K., El Hammami, Y., Mir, R., Mediouni, T., Armou, S. (2017). Effect of the non-condensable gas type during condensation of water vapor. Thermal Science. 21(6 Part A): 2457-2468. https://doi.org/10.2298/TSCI160612294Z.
[14] Zhang, S., Cheng, X., Shen, F. (2018). Condensation heat transfer with non-condensable gas on a vertical tube. Energy and Power Engineering, 10(4B): 25-34. https://doi.org/10.4236/epe.2018.104b004
[15] Shamsabadi, H., Rashidi, S., Esfahani, J.A., Keshmiri, A. (2020). Condensation in the presence of non-condensable gases in a convergent 3D channel. International Journal of Heat and Mass Transfer, 152: 119511. https://doi.org/10.1016/j.ijheatmasstransfer.2020.119511
[16] Bérut, E., Lips, S., Lefèvre, F., Sartre, V. (2021). Effect of non-condensable gas on heat transfer within the hollow fin condenser of metallic and polymer vapor chambers. Applied Thermal Engineering, 190: 116777. https://doi.org/10.1016/j.applthermaleng.2021.116777
[17] IEC 62552. Household refrigerating appliances - Characteristics and test methods - Part 1: General requirements. https://webstore.iec.ch/publication/21805.
[18] Ali, H.M. (2021). Exergy analysis of chest freezer. M.Sc. Thesis. Mechanical Engineering Department, University of Technology-Iraq.