Massimiliano Lega![]() | Gabriele Medio
| Gabriele Medio![]() | Theodore Endreny
| Theodore Endreny![]() | Marco Casazza
| Marco Casazza![]() | Germana Esposito
| Germana Esposito![]() | Valeria Costantino
| Valeria Costantino![]() | Roberta Teta*
| Roberta Teta*![]()
© 2023 IIETA. This article is published by IIETA and is licensed under the CC BY 4.0 license (http://creativecommons.org/licenses/by/4.0/).
OPEN ACCESS
In the context of environmental monitoring studies, the complex dynamics of environmental systems, constrained by the distribution, intensity and interaction of multiple sources, limits the ability to detect pollution phenomena and to identify their sources. The deployment of multidisciplinary, multilevel and multi-factorial strategies supports the identification of the links between the pollutants’ sources and targets. Our new biomonitoring strategy, based on the integration of remote (satellite) and proximal (drone) sensing monitoring data with field data (bio/chemical analyses) and focused on the use of cyanobacteria as bioindicators of pollution, was implemented and was validated through its application on a test-bed area, i.e., Lake Avernus (Campania Region, Southern Italy). A long-term analysis of multispectral remote sensing observations centred on the Lake Avernus area highlighted the periodicity and seasonality of cyanobacterial bloom events over the time interval 2019-2021. However, a sudden change of characteristics, observable through remotely sensed data, was evidenced during the first and major lockdown related to the COVID-19 pandemics, in year 2020. This sudden change depended on the drastic modification of human habits and a reduction in pollutant emissions, as widely reported by the scientific literature. During the same lockdown period, the opportunity to collect samples in the field allowed to identify an unusual progression of Microcystis' bloom, whose dynamics is triggered by the existing anthropogenic sources and the evolution of environmental parameters, that can stimulate the blooming events. This work shows and demonstrates how pollution attribution can be achieved using remote sensing of cyanobacteria, which are excellent bioindicators due to their sensitivity to multiple stressors and rapid response to habitat changes throughout the event.
multilayer analysis, hierarchical monitoring, biomonitoring, remote sensing, cyanobacteria, bioindicators, COVID-19 pandemic
The identification of pollutant sources and pathways is a relevant step in the process of surveying a polluted site finalized to the protection of human health and the environment. The assessment of pollution phenomena often remains limited to the quantification of the generated impacts and their evolution, omitting further investigations on their underlying causes. Difficulties in the task of attributing environmental pollution phenomena to their causes mainly depend on their different nature, interaction and spatio-temporal variability. The resulting complex scenario should be effectively considered in the assessment procedure. Furthermore, monitoring activities are affected by technological and operational constrains, which include the availability of appropriate technologies and the economic costs of instruments, field and laboratory activities. An informative assessment of a pollution event would require both an integrated procedure, based on a multi-disciplinary approach, and an adequate spatio-temporal analysis. Instead, the underlying cause-effect relationships often remain undefined, since the evidence of a pollution event arises when its effects are detected in a specific location and time. Environmental changes may be triggered by many factors, among which the pandemics must also be included for the consequences of the impacts on human health, for the emerging research needs, for the social/political response to the pandemic and the recovery plans. The global outbreak of COVID-19 has clearly showed this high interlinkage between pandemic and environmental issues. As for example, the measures taken to control the spread of the virus such as the societal lockdown and the slowdown of social and economic activities induced several environmental changes. From one side, part of these changes were observed, considering them under the light of a positive reduction of environmental stressors [1, 2]. However, the forced behavioral changes simply modified the nature and distribution of pollution sources, without necessarily reducing their intensity [3, 4]. Consequently, despite a diffuse public interpretation, often spread by the media, considering only the occurred changes as positive, the evidence derived from observations is different and requires further investigations [5, 6].
Many works, focused on the impact of COVID-19 on the environment, concentrated on urban areas, being motivated by their higher population densities, determining a higher number of individuals exposed to harmful pollutants [7-9]. Conversely, the observation of coastal areas and, especially, coastal waters was less considered, despite the fact that pollutant discharges in coastal areas, often transported through inland waters, adversely impact on human and environmental health [10-12]. With this respect, the relevance of coastal waters protection is very high, considering also the high number of ecosystem services provided by these areas for the benefit of human communities [13-15].
Considering the multiple factors affecting environmental status and the heterogeneity and the variability of the impacted scenarios, a Multi- disciplinary, Multi-level (hierarchical) [16, 17] Multi-parametric (different sensors) approach (MuM3 hereafter) [18, 19], is needed for the Monitoring of such complex scenarios and identification of multiple source-path-target routes.
When the existing constraints do not allow a direct measure of some parameters of concern, bioindication becomes fundamental. In fact, the reaction of different living species (organism/microorganism or communities thereof), being sensible to the variation of certain physical and chemical parameters and acting as biomonitors, can be used as a mean to deliver the needed information on the status and variability of environmental conditions, as well as to evidence the connections between different pollution sources and the existing vulnerable targets [20, 21]. Compared to chemical and physical measures of environmental quality, bioindicators are capable of capturing cumulative impacts of multiple pollutants and habitat changes, in an early stage and over time. Cyanobacteria are good bioindicators of water quality [22]: in certain conditions (eutrophication) generated from excessive nutrient input usually of anthropogenic origin, cyanobacteria can form extensive blooms, often toxic, that are their (species-specific) response to environmental stressors. In our latest researches, we explored the use of cyanobacteria as pollution bioindicators of coastal water of Campania region in Italy [23]. In particular, several cyanobacterial blooms were detected and reported in different spots of Campania region coasts, which were highly impacted by eutrophication phenomena due to the release of pollutants into water bodies [24]. Then, the observations were extended to some lakes in the same region, where cyanobacterial blooms were also observed. The presence of cyanobacterial toxins, dangerous for human health, was identified and their relation with anthropic and environmental stressors was assessed [25]. These findings were the results of the application of our new fast detection strategy (FDS) [26], combining the advantages of remote/proximal sensing with those of analytical/bioinformatics analyses, namely, LC-HRMS-based molecular networking.
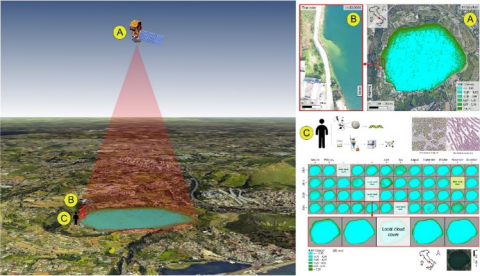
By this study the fast detection strategy (FDS) is implemented through its integration with MuM3 framework and our new comprehensive biomonitoring strategy is validated by its application, choosing a top-down approach (Figure 1), to a real testbed area.
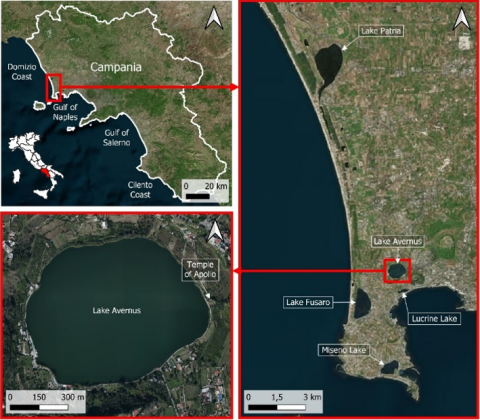
Both remote and proximal sensing data were acquired, beginning at the satellite level and scaling-down at different spatial–temporal resolutions with the aid of Unmanned Aerial Vehicle (UAV) platforms. The observation time-frame included the periods before, during and after the COVID-19 lockdown along the years 2019-2021. Within the observed area, the entire coastal water bodies located in the North of the city of Naples (Campania region, Southern Italy) (Figure 2), the Lake Avernus, a volcanic coastal lake, was selected as region of interest for a detailed analysis [27].
Figure 1. Overview of our multilevel, multiscale, multitemporal, multiparametric strategy applied on Lake Avernus (Southern Italy). Left panel: A) Sentinel-2 satellite, B) DJI Mavic 2 Pro drone and C) in situ sampling. Right panel: A) NDVI satellite data of Lake Avernus, B) Visible range imageries grabbed from drone and C) analytical and bioinformatic analyses
Figure 2. Selected testbed area. Larger aerial view of the testbed, evidencing the region of interest (red rectangle) within the larger area of Campania Region (upper left). Zoom of the region of interest, displaying the Domitia coast and the position of Lake Avernus (red square) (right picture). Zoom of Lake Avernus area (lower left)
Lake Avernus is considered an optimum testbed site for different reasons. First, due to the morphology of surrounding landscape, during rainfalls, Lake Avernus can act as a collector of run-off waters coming from the surrounding areas. Second, several blooms of different cyanobacterial species and their associated toxins were observed in this area in different years. Third, all the observed blooming events were triggered by stressors, that derived from an assessed state of different environmental variables.
This study shed light on the causes and consequences of the assessed environmental conditions emerged at the beginning of COVID-19 pandemics, further enabling the observation of the influences of anthropic pressures on cyanobacterial bloom events.
The applied hierarchical monitoring integrated the acquisition of data coming from sensors mounted on remote (i.e., satellite) and proximal (i.e., drones) platforms, as well as from in-situ sampling. Field activities were aimed at detecting the presence of polluted discharges [28, 29] along the coastal waters of Campania region (Southern Italy). The two sensing platforms included the satellites of the Copernicus Sentinel 2 mission and the DJI Mavic 2 Pro drone.
Users of the Sentinel 2 mission, have access to a database of geo-referenced orthophotos, 100$\times$100 km2 wide coming from two twin satellites (2A and 2B). The delivered radiometric images were sampled for 13 different spectral bands (Table 1). In Table 1, for each sensor, the table lists its spatial resolution (m), central wavelength (nm), bandwidth (nm) and the range (description), where VNIR identifies the very near infrared region of the electro-magnetic wave spectrum and the SWIR identifies the shortwave infrared region. For the purpose of this study, only bands 2, 3, 4 and 8, having a pixel spatial resolution of 10 meters.
Table 1. Key data of the radiometric sensors mounted on the SENTINEL-2 twin satellites (S2A & S2B)
|
Band Nr. |
Spatial Res. (m) |
Central Wavelength (nm) |
Bandwidth (nm) |
Type |
||
|
S2A |
S2B |
S2A |
S2B |
|||
|
1 |
60 |
442.7 |
442.3 |
21 |
21 |
Ultra-blue |
|
2 |
10 |
492.4 |
492.1 |
66 |
66 |
Blue |
|
3 |
10 |
559.8 |
559.0 |
36 |
36 |
Green |
|
4 |
10 |
664.6 |
665.0 |
31 |
31 |
Red |
|
5 |
20 |
704.1 |
703.8 |
15 |
16 |
VNIR |
|
6 |
20 |
740.5 |
739.1 |
15 |
15 |
VNIR |
|
7 |
20 |
782.8 |
779.7 |
20 |
20 |
VNIR |
|
8 |
10 |
832.8 |
833.0 |
106 |
106 |
VNIR |
|
8a |
20 |
864.7 |
864.0 |
21 |
22 |
VNIR |
|
9 |
60 |
945.1 |
943.2 |
20 |
21 |
SWIR |
|
10 |
60 |
1373.5 |
1376.9 |
31 |
30 |
SWIR |
|
11 |
20 |
1613.7 |
1610.4 |
91 |
94 |
SWIR |
|
12 |
20 |
2202.4 |
2185.7 |
175 |
185 |
SWIR |
Source: MSI Instrument – Sentinel-2 MSI Technical Guide – Sentinel Online (esa.int)
The DJI Mavic 2 Pro is an Unmanned Aerial Vehicle (UAV) equipped with a fully stabilized three-axis gimbal RGB camera. The resolution of collected images is 20 megapixel. A multispectral camera (MAPIR Survey 3) was added to the standard DJI Mavic 2 Pro payload. The use of MAPIR Survey 3 allowed the acquisition of other 3 spectral bands (“Orange”, “Cyan”, “Near Infrared”). The use of RGB camera was motivated by the need of comparing the remote and proximal observation in the visible range with a higher spatial resolution, which, in the case of the UAV-mounted RGB camera, falls in the range of a few cm/px, depending on the altitude of the flight path. In the case of this work, the majority of images were collected at spatial resolutions of 5-10 cm/px.
First, a multi-spectral analysis of satellite imageries was performed along a wide timeframe, including the periods before and after the first lock-down due to COVID-19 pandemics, in year 2020, ranging from year 2019 to year 2021. The Sentinel-2 data, publicly available through a dedicated website, were downloaded and analyzed to calculate two different multi-spectral indexes for three different time periods: the period before the lockdown, starting from year 2019; the period during the first lock-down, in year 2020, and the period after the lock-down, until year 2021. The chosen Sentinel 2 data were radiometrically corrected, then, after their elaboration, the elaborated images were classified to highlight the spatial regions of interest to include the observed water discharge plumes and the river inlets into the sea. The open-source QGIS software was used to elaborate the geo-referenced data and to calculate the chosen multi-spectral indices.
The first selected multispectral index was the Normalized Difference Vegetation Index (NDVI). The NDVI is defined as:
$\mathrm{NDVI}=\left(\mathrm{R}_{\mathrm{NIR}}-\mathrm{R}_{\mathrm{RED}}\right) /\left(\mathrm{R}_{\mathrm{NIR}}+\mathrm{R}_{\mathrm{RED}}\right)$ (1)
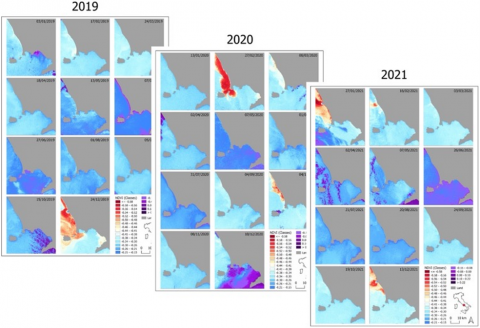
where, RNIR and RRED indicate the values of near-infrared and red reflectance channels [30]. This index allows to infer the presence of photosynthetically-active organisms and the magnitude of photosynthetic activity. In particular, the NDVI is able to identify the chlorophyll-a, being present also in the algal and bacterial blooms (e.g., cyanobacteria) within coastal waters. This is why the NDVI is successfully applied to detect the presence of eutrophication phenomena, mostly depending on the supply of nutrients contained in wastewater or contaminated water. Within the elaboration process, thematic maps in false color scale were produced, preserving the same criterion for the classification of the elaborated data to make them comparable. The attribution of chromatic ranges and values was kept constant for all the annuities to guarantee comparability and a coherent analysis. The specific color range and associated NDVI values are depicted in Figure 3.
Figure 3. NDVI thematic maps (grey colour refers to the land areas, while false-colour scale refers to coastal waters). Data refer to the years 2019-2021
The Surface Algal Bloom Index (SABI) allows the detection of floating biomass into water bodies [31]. The SABI is defined as:
$\mathrm{SABI}=\left(\mathrm{R}_{\mathrm{NIR}}-\mathrm{R}_{\mathrm{RED}}\right) /\left(\mathrm{R}_{\mathrm{BLUE}}+\mathrm{R}_{\mathrm{GREEN}}\right)$ (2)
where, RNIR, RRED, RBLUE and RGREEN indicate the values of reflectance for the near-infrared, red, blue and green spectral bands, being especially sensitive to algal and cyanobacterial blooms.
Thanks to the integrated use of different platforms and sensors, having different spatial resolutions, it was possible to combine the imageries related to the testbed areas at different spatial scales.
3.1 NDVI maps and water quality
NDVI maps referred to the years interval between 2019 and 2021 are displayed in Figure 3. Maps were grouped and classified according to 20 classes. Water areas in purple and red identify the regions of major interest for this study. In particular, areas in purple identify the areas with higher NDVI index values, being associated to higher chlorophyll-a values. The initial quality of downloaded imageries was chosen to avoid the presence of atmospheric disturbances that would affect the multi-spectral indices calculation. The identified region of interest, where the photosynthetic activity within water bodies is higher, delimits the water bodies potentially impacted by nutrients discharges deriving from anthropogenic sources (e.g.: sewage drains, channels collecting irrigation waters from agricultural fields, etc.), which give rise to eutrophication phenomena.
Red-coloured regions, closer to the coastline, are found close to the river and channels mouths. The calculated NDVI values and subsequent classification depend on the presence of discharge plumes, often characterized by a higher turbidity, that were triggered by periods of intense rainfalls.
3.2 Lake Avernus analysis
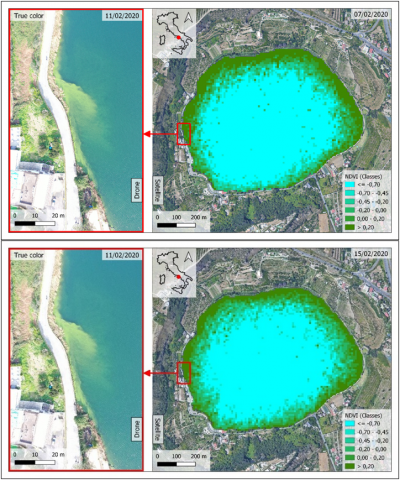
Due to the larger spatial extension of the observation area with respect to the regions of interest and the variable quality of satellite imageries, due to the presence of cloud cover, a specific target area was identified, where a preliminary analysis showed a more evident relationship between environmental stressors and the observed response. This area corresponds to the Lake Avernus. Figure 4 displays the comparison between the elaboration of data derived from proximal sensing (i.e., drone, on the left) and remote-sensing (i.e., satellite, on the right) platforms. Satellite data were sampled on February 7th, 2020 (top right) and 8 days later (bottom right) while the drone data were collected on February 11th, 2020. The NDVI analysis on February 7th, 2020 data revealed the presence of a pollution discharge, being evident on the left-side images of the figure. The observed green plume can be attributed to an ongoing cyanobacterial bloom.
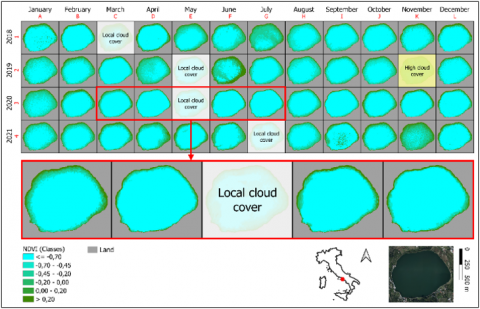
During this period, the lake was interested by a Microcystis aeruginosa bloom event, that was evidenced by the in situ collection and analysis of water samples [25]. In order to parallel the field data collection, a drone mission was performed to collect proximal sensing data, later analysed together with satellite multispectral data. Comparing the satellite maps derived from the calculation of multispectral indices and the drone RGB images, a significant correspondence of blooming peaks was found along the shores of the lake. In order to infer the relevance of the observed blooming event, the calculation of NDVI derived from satellite data was extended to the year interval between 2018 and 2021. Monthly data were elaborated from imageries with the lowest possible cloud cover. The elaborated thematic maps are grouped into a synoptic table in Figure 5.
Figure 4. Right: NDVI satellite data sampled on February 7th 2020 (top) and February 15th 2020 (bottom). A higher value of the NDVI (dark green) corresponds to higher chlorophyll-a content. Left: Visible range imageries grabbed from drone
Figure 5. Synoptic table of the NDVI (normalized difference vegetation index) monthly thematic maps for Lake Avernus. Grey colours are associated to land. Cyan colour is associated to water with lower NDVI corresponding to a negligible algal bloom concern, while dark green identifies areas with observed maximum algal bloom concern, where NDVI values are higher
3.3 Seasonal and temporal variations
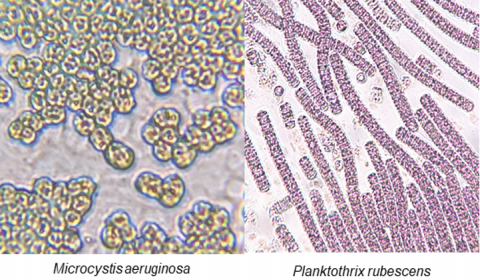
The evident periodicity of blooming reflects the seasonal cyclicality, depending both on climate factors (i.e., solar radiation and water temperature) and on the variability of human activities occurring in the areas around the lake. The biomonitoring activities carried out for this work integrated the remote/proximal sensing analysis and the laboratory biological and chemical analyses of the samples collected in situ in the spots pointed by drone [32]. The microscopic observation of collected samples allowed to identify two prevalent alternating cyanobacterial species: the Microcystis aeruginosa and the Planktothrix rubescens (Figure 6). The production of toxins by both species depends on the presence of environmental stressors, as reported by the literature [25, 27].
The observed blooming in the period March - July 2020 was not comparable by magnitude to those occurred in the same period in the other years included in this study. In particular, the surface extension of the bloom in year 2020 was minor. This period corresponded to the first and most severe Italian COVID-19 lockdown. The observed condition corresponds to a much lower anthropogenic pressure. In fact, while agricultural activities were minimized in the area, recreational uses were totally banned during the lockdown.
Figure 6. Microscopic observation of samples of algal blooms collected from Lake Avernus. Two prevalent cyanobacterial species were evidenced: Microcystis aeruginosa (left) and Planktothrix rubescens (right)
3.4 Comparison of NDVI and SABI indices
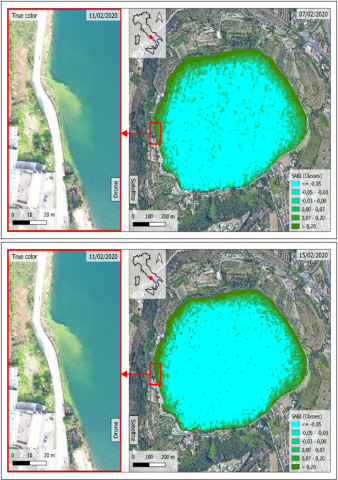
A deeper analysis required the calculation of the SABI, being more specific for the identification of algal blooms. The thematic maps derived from the classification of the SABI values (6 classes), obtained from the same database used for the NDVI, are grouped in Figure 7. The SABI map derived from the satellite imageries of February 7th 2020 (top right) allowed to confirm the presence of a potential algal bloom, depending on the discharge evidenced by the true-colour picture (left images) collected during the drone flight and confirmed by the laboratory analysis, which allowed to identify the prevailing cyanobacterial species of the observed bloom (Figure 6).
As clearly visible, no significant differences are observed between the NDVI and the SABI maps, confirming both the validity of remotely-sensed observations, being in parallel validated through the laboratory analysis of field samples, which allowed the identification of the prevailing cyanobacterial species associated to the blooming event.
Figure 7. Right: SABI satellite data sampled on February 7th 2020 (top) and February 15th 2020 (bottom). A higher value of the SABI (dark green) corresponds to higher chlorophyll-a content. Left: Visible range imageries grabbed from drone
Our integrated multidisciplinary, multilevel and multiparametric strategy, based on the spatio-temporal integration of remote/proximal sensing observations and in situ measurements, proved to be successful for detecting and identifying the presence of environmental stressors, their sources and evolution. Specifically, the application of our biomonitoring strategy on a target area, corresponding to the Lake Avernus (Campania region, Southern Italy), allowed to identify the existence of pollutant discharges in water bodies and their variability during COVID-19 lockdown in Italy through the monitoring of cyanobacterial blooming and their dynamics.
The new implemented procedure allowed to characterize water pollution events through the integration of remote and proximal sensing observation of cyanobacterial bloom dynamics, being excellent bioindicators due to their sensitivity to multiple environmental stressors and their rapid response to habitat changes throughout the observed event. Knowing the planning of the satellite passages on the specific area it was possible to plan the drone pre-flight and in situ sampling. However, only after the satellite acquisition, it is possible to evaluate the quality and relative usability of the data (excessive cloudiness, strong wind etc.) and also the effective conduct of the surveys on field could be conditioned by the unfavorable weather conditions. It must also be pointed out that the observed phenomena have a relatively slow evolution and therefore also the possible time gap between the data coming from the various layers if limited to a few days may be not considered relevant. In particular, the carried out analysis, even allowing a quantitative evaluation which in the lower layers also has a high resolution, was then undersampled in the context of the overall analysis, bringing the considerations back to a level of both spatial and temporal scale in which even the small variations occurred also after a few days do not invalidate the broader interpretation of the phenomenon. It is evident that what has been developed aims to be more an operating model in support of phenomenological interpretations and also a valid support for early detection and warning actions. Further studies will be directed to investigate the specific environmental factors that trigger, from one side, the cyanobacterial bloom and, from the other side, the production of toxins.
The database for this work was originally used for the project “Attività pilota di Monitoraggio di Cianobatteri nella fascia costiera della Regione Campania”, funded by the “Centro di Riferimento Regionale per la Sicurezza Sanitaria del Pescato (CRiSSaP)”. The above project was performed in cooperation with the Agency for the Environmental Protection of Campania region in Italy (ARPAC), the University of Naples “Federico II” (Department of Pharmacy, ref. V. Costantino, and Department of Veterinary Medicine and Animal Production, ref. A. Anastasio), the University of Naples “Parthenope” (Department of Engineering, ref. M. Lega). This project was partly supported by the University of Naples “Parthenope” (Italy) under “Bando di sostegno alla ricerca individuale” and by the Department of Pharmacy – University of Naples “Federico II” under “Bando contributo alla ricerca – Anno 2021” within the project “CyaAq – I cianobatteri come promettente risorsa di antimicrobici non convenzionali”.
[1] Irfan, M., Ahmad, M., Fareed, Z., Iqbal, N., Sharif, A., Wu, H. (2022). On the indirect environmental outcomes of COVID-19: Short-term revival with futuristic long-term implications. International Journal of Environmental Health Research, 32(6): 1271-1281. https://doi.org/10.1080/09603123.2021.1874888
[2] Mousazadeh, M., Paital, B., Naghdali, Z., Mortezania, Z., Hashemi, M., Karamati Niaragh, E., Aghababaei, M., Ghorbankhani, M., Lichtfouse, E., Sillanpää, M., Hashim, K.S., Emamjomeh, M.M. (2021). Positive environmental effects of the coronavirus 2020 episode: A review. Environment, Development and Sustainability, 23: 12738-12760. https://doi.org/10.1007/s10668-021-01240-3
[3] Magni, S., Della Torre, C., Nigro, L., Binelli, A. (2022). Can COVID-19 pandemic change plastic contamination? The case study of seven watercourses in the metropolitan city of Milan (N. Italy). Science of the Total Environment, 831: 154923. https://doi.org/10.1016/j.scitotenv.2022.154923
[4] Lovarelli, D., Fugazza, D., Costantini, M., Conti, C., Diolaiuti, G., Guarino, M. (2021). Comparison of ammonia air concentration before and during the spread of COVID-19 in Lombardy (Italy) using ground-based and satellite data. Atmospheric Environment, 259: 118534. https://doi.org/10.1016/j.atmosenv.2021.118534
[5] D. Atoufi, H., Lampert, D.J., Sillanpää, M. (2021). COVID-19, a double-edged sword for the environment: A review on the impacts of COVID-19 on the environment. Environmental Science and Pollution Research, 1-10. https://doi.org/10.1007/s11356-021-16551-1
[6] Han, J., Yin, J., Wu, X., Wang, D., Li, C. (2023). Environment and COVID-19 incidence: A critical review. Journal of Environmental Sciences, 124: 933-951. https://doi.org/10.1016/j.jes.2022.02.016
[7] Gkatzelis, G.I., Gilman, J.B., Brown, S.S., Eskes, H., Gomes, A.R., Lange, A.C., McDonald, B.C., Peischl, J., Petzold, A., Thompson, C.R., Kiendler-Scharr, A. (2021). The global impacts of COVID-19 lockdowns on urban air pollution: A critical review and recommendations. Elementa: Science of the Anthropocene, 9(1): 00176. https://doi.org/10.1525/elementa.2021.00176
[8] Marwah, M., Agrawala, P.K. (2022). COVID-19 lockdown and environmental pollution: An Indian multi-state investigation. Environmental Monitoring and Assessment, 194(2): 49. https://doi.org/10.1007/s10661-021-09693-9
[9] Girdhar, A., Kapur, H., Kumar, V., Kaur, M., Singh, D., Damasevicius, R. (2021). Effect of COVID-19 outbreak on urban health and environment. Air Quality, Atmosphere & Health, 14: 389-397. https://doi.org/10.1007/s11869-020-00944-1
[10] Suh, J., Shin, S., Kahng, H.Y., Ahn, S., Lee, Y.S., Jung, J.S. (2018). Survey of coastal inland pollution sources and their influence on seawater quality in Doam bay, Korea. Environmental Monitoring and Assessment, 190: 1-13. https://doi.org/10.1007/s10661-018-6982-y
[11] Luo, X., Jiao, J.J., Moore, W.S., Cherry, J.A., Wang, Y., Liu, K. (2018). Significant chemical fluxes from natural terrestrial groundwater rival anthropogenic and fluvial input in a large-river deltaic estuary. Water Research, 144: 603-615. https://doi.org/10.1016/j.watres.2018.07.004
[12] Dodder, N.G., Maruya, K.A., Ferguson, P.L., Grace, R., Klosterhaus, S., La Guardia, M.J., Lauenstein, G.G., Ramirez, J. (2014). Occurrence of contaminants of emerging concern in mussels (Mytilus spp.) along the California coast and the influence of land use, storm water discharge, and treated wastewater effluent. Marine Pollution Bulletin, 81(2): 340-346. https://doi.org/10.1016/j.marpolbul.2013.06.041
[13] Liu, C., Liu, G., Casazza, M., Yan, N., Xu, L., Hao, Y., Franzese, P.P., Yang, Z. (2022). Current status and potential assessment of China’s ocean carbon sinks. Environmental Science & Technology, 56(10): 6584-6595. https://doi.org/10.1021/acs.est.1c08106
[14] Yang, Q., Liu, G., Casazza, M., Hao, Y., Giannetti, B.F. (2019). Emergy-based accounting method for aquatic ecosystem services valuation: A case of China. Journal of Cleaner Production, 230: 55-68. https://doi.org/10.1016/j.jclepro.2019.05.080
[15] Yang, Q., Liu, G., Hao, Y., Zhang, L., Giannetti, B.F., Wang, J., Casazza, M. (2019). Donor-side evaluation of coastal and marine ecosystem services. Water Research, 166: 115028. https://doi.org/10.1016/j.watres.2019.115028
[16] Lega, M., Casazza, M., Teta, R., Zappa, C.J. (2018). Environmental impact assessment: A multi-level, multi-parametric framework for coastal waters. International Journal of Sustainable Development and Planning, 13(8): 1041-1049. https://doi.org/10.2495/SDP-V13-N8-1041-1049
[17] Lega, M., Kosmatka, J., Casazza, M., De Maio, L., Severino, D., Teta, R. (2020). Environmental monitoring and assessment: A multi-scale and multiparameter case study in Campania Region (S Italy) on the recreational seawater quality evaluation. Regional Studies in Marine Science, 39: 101465. https://doi.org/10.1016/j.rsma.2020.101465
[18] Medio, G., Severino, V., Teta, R., Endreny, T., Lega, M. (2022). Hierarchical monitoring of water quality: Coordinating the spatiotemporal resolution of multilayer and multispectral sensors to characterize pollution. WIT Transactions on Ecology and the Environment, 257: 3-15. https://doi.org/10.2495/WMEI220011
[19] Errico, A., Angelino, C.V., Cicala, L., et al. (2014). SAR/multispectral image fusion for the detection of environmental hazards with a GIS. In Earth Resources and Environmental Remote Sensing/GIS Applications V, 9245: 9-16. https://doi.org/10.1117/12.2066476
[20] Szczerbiñska, N., Gaczyñska, M. (2015). Biological methods used to assess surface water quality. Fisheries & Aquatic Life, 23(4): 185. https://doi.org/10.1515/aopf-2015-0021
[21] Pander, J., Geist, J. (2013). Ecological indicators for stream restoration success. Ecological Indicators, 30: 106-118. https://doi.org/10.1016/j.ecolind.2013.01.039
[22] Teta, R., Esposito, G., Casazza, M., Zappa, C.J., Endreny, T.A., Mangoni, A., Costantino, V., Lega, M. (2019). Bioindicators as a tool in environmental impact assessment: Cyanobacteria as a sentinel of pollution. International Journal of Sustainable Development and Planning, 14: 1-8. https://doi.org/10.2495/SDP-V14-N1-1-8
[23] Teta, R., Romano, V., Della Sala, G., Picchio, S., De Sterlich, C., Mangoni, A., Di Tullio, G., Costantino, V., Lega, M. (2017). Cyanobacteria as indicators of water quality in Campania coasts, Italy: A monitoring strategy combining remote/proximal sensing and in situ data. Environmental Research Letters, 12(2): 024001. https://doi.org/10.1088/1748-9326/aa5649
[24] Esposito, G., Teta, R., Marrone, R., De Sterlich, C., Casazza, M., Anastasio, A., Lega, M., Costantino, V. (2019). A Fast Detection Strategy for Cyanobacterial blooms and associated cyanotoxins (FDSCC) reveals the occurrence of lyngbyatoxin A in Campania (South Italy). Chemosphere, 225: 342-351. https://doi.org/10.1016/j.chemosphere.2019.02.201
[25] Teta, R., Sala, G.D., Esposito, G., Stornaiuolo, M., Scarpato, S., Casazza, M., Anastasio, A., Lega, M., Costantino, V. (2021). Monitoring cyanobacterial blooms during the COVID-19 pandemic in Campania, Italy: The case of Lake Avernus. Toxins, 13(7): 471. https://doi.org/10.3390/toxins13070471
[26] Teta, R., Esposito, G., De Sterlich, C., Lega, M., Costantino, V. (2021). Early detection of cyanobacterial blooms and associated cyanotoxins using fast detection strategy. Journal of Visualized Experiments, (168): e61889. https://doi.org/10.3791/61889
[27] Lega, M., Medio, G., Endreny, T., Esposito, G., Costantino, V., Teta, R. (2022). Attribution of pollution discharges in coastal waters during the Covid-19 lockdown using remote sensing and bioindicators. WIT Transactions on Ecology and the Environment, 257: 177-186. https://doi.org /10.2495/WMEI220151
[28] Persechino, G., Lega, M., Romano, G., Gargiulo, F., Cicala, L. (2013). IDES project: An advanced tool to investigate illegal dumping. WIT Transactions on Ecology and the Environment, 173: 603-614. https://doi.org/10.2495/SDP130501
[29] Ferrara, C., Lega, M., Fusco, G., Bishop, P., Endreny, T. (2017). Characterization of terrestrial discharges into coastal waters with thermal imagery from a hierarchical monitoring program. Water, 9(7): 500. https://doi.org/10.3390/w9070500
[30] Rouse, J.W., Haas, R.H., Schell, J.A., Deering, D.W. (1974). Monitoring vegetation systems in the Great Plains with ERTS. In: Freden, S.C., Mercanti, E.P., Becker, M.A., eds. Third Earth Resource Technology Satellite-1 Symposium, Washington, DC, USA: NASA, pp. 309–317.
[31] Alawadi, F. (2010). Detection of surface algal blooms using the newly developed algorithm surface algal bloom index (SABI). In Remote Sensing of the Ocean, Sea Ice, and Large Water Regions 2010, 7825: 45-58. https://doi.org/10.1117/12.862096
[32] Teta, R., Della Sala, G., Esposito, G., Via, C.W., Mazzoccoli, C., Piccoli, C., Bertin, M.J., Costantino, V., Mangoni, A. (2019). A joint molecular networking study of a Smenospongia sponge and a cyanobacterial bloom revealed new antiproliferative chlorinated polyketides. Organic Chemistry Frontiers, 6(11): 1762-1774.