Hussain H. Al-Kayiem*![]() | Mohammed N. Mohammed | Koh Kelly
| Mohammed N. Mohammed | Koh Kelly![]() | Tri W. B. Riyadi
| Tri W. B. Riyadi![]() | Marwan Effendy
| Marwan Effendy![]()
© 2023 IIETA. This article is published by IIETA and is licensed under the CC BY 4.0 license (http://creativecommons.org/licenses/by/4.0/).
OPEN ACCESS
The Predicted Mean Vote (PMV) model for thermal comfort determination is unsuitable for use as a generalized index in tropical climates where the weather is hot and humid throughout the year. The current study is aimed to address the discrepancy in the thermal comfort models to estimate the thermal sensation in a tropical climate. Then, a case study was performed on a single-story office building in Malaysia, which has a typical tropical climate, to develop a new modified adaptive Predictive Mean Vote (maPMV) that suits the tropical climate. Experimental measurements were conducted with two groups of occupants. The adoptive mean vote showed that the participants were likely to feel comfortable when the indoor temperature was between 24°C and 26°C. The PMV model overestimated the thermal sensation in the room. Accordingly, a maPMV model was developed to mitigate the inaccuracy of the existing PMV model. The coefficients of the developed model were determined based on the adaptive approach using actual thermal sensation data obtained from a questionnaire survey of the occupants. The overall thermal comfort estimation could be improved using the developed model to reduce the cooling load and the building’s energy consumption in tropical areas.
actual mean vote, adaptive predicted mean vote, predicted mean vote, thermal comfort in a tropical climate, thermal sensation
Building and structure should serve both aesthetical and functional purposes. An appealing appearance not only enhances the aesthetic value of the building but also increases the property value of the asset. The function of the building to accommodate its occupants’ requirements must be considered in the design stage. The indoor thermal environment of a building is often associated with the performance and productivity of the occupants. Sick building syndrome is used to describe the building-related illnesses suffered by the occupants. According to NHS-UK [1], sick buildings may cause headaches, blocked or runny nose, dry, itchy skin, sore eyes or throat, cough or wheezing, rashes, tiredness, and difficulty concentrating. Also, Parsons [2] and Latha et al. [3] concluded that the symptoms of the sick building syndrome include eye, nose, and throat irritation, heavy sweating, dehydration through sweating, low blood pressure, and fainting.
1.1 Building’s thermal comfort
To provide a thermally comfortable environment to the occupants, a significant amount of energy in buildings is used for heating, ventilation, and air-conditioning to maintain thermal comfort [4, 5]. In a tropical climate, buildings are constantly exposed to solar radiation throughout the year [6]. Therefore, buildings in a tropical climate greatly depend on air-conditioning and mechanical ventilation (ACMV) to achieve a comfortable indoor thermal environment for the occupants.
The widespread acceptance of the use of mechanical means in response to the growing demand for a thermally comfortable environment within the building environment has led to an upward trend in energy demand and a sharp increase in energy consumption in the building sector [2, 7]. In developed countries, the building sector accounts for a large proportion of primary energy consumption, between 20% and 40%, as demonstrated by Rupp et al. [8] and Berardi [9]. In China, as determined by Zhou et al. [10], buildings contribute approximately 28% of energy consumption and buildings in the United States contribute 40% of energy consumption, as reported by Li and Wen [11]. In a typical tropical climate like Malaysia, the energy consumption of the building is about 53.6% of the total energy consumption and 14.6% of the final energy demand, as reported by Suruhamjaya [12]. However, Kwong et al. [13] and Zaki et al. [14] found that developing countries are likely to consume more energy than those developed countries and buildings in tropical climates represent the major energy users. It depends greatly on air-conditioning to achieve better thermal comfort, especially during the hot season [15, 16]. Hence, there is an opportunity for thermal comfort research to maintain a thermally comfortable environment and improve the energy efficiency of the building.
1.2 On the thermal comfort models
Thermal comfort models adopted by reference standards, such as ASHRAE and International Standards Organization (ISO), are conducted in mid-latitude regions in North America and northern Europe [17]. Thermal comfort standards, such as ISO 7730 [18] and ASHRAE Standard 55 [19], are the guidelines for a comfortable indoor environment when designing a building. An upgraded version, ISO EN 16789-1, included daylight factors and assumed occupant schedules. This new standard also considers the occupational expectation difference between persons in a naturally or mechanically ventilated space and a year-round evaluation of the indoor thermal environment. ASHRAE Standard 55 is a standard that provides minimum requirements for an acceptable indoor environment whereby the recommended indoor design temperature is between 20°C and 23°C for summer and 23°C and 26°C for winter; meanwhile, the recommended relative humidity in both summer and winter is at about 30% and 60%, respectively [19]. However, ASHRAE Standard 55 is not accurate in tropical climates, such as Malaysia, where it is hot and humid throughout the year. According to the Department of Standards Malaysia (DOSM) [20], the MS1525 recommended indoor design temperature is 23°C-26°C and the relative humidity is 60%-70%. These standards are based on theoretical analyses of human heat exchange and primarily mathematical models developed by Fanger based on controlled climate chamber experiments [21-23]. Thermal comfort is defined by Hensen [24] as ‘a state where no driving impulses exist to modify the environment by the behaviors’. In another context, thermal comfort is ‘that condition of mind which expresses satisfaction with the thermal environment and is assessed by subjective evaluation’ [19, 20].
A chronological review of the contemporary thermal comfort knowledge suggests two different approaches; the heat balance model based on a controlled climate chamber and the adaptive model based on field studies.
1.2.1 Predicted mean vote (PMV) model
The heat balance approach model developed by Fanger [25] is based on the effect of thermal load on the mechanism of the human thermoregulatory system in a uniform and steady-state condition to predict thermal sensation. The approach combines the theories of heat balance with physiological thermoregulation to achieve a thermally comfortable indoor environment by determining a range of comfortable temperatures.
In the Fanger experiment, the participants’ parameters, such as clothing insulation and metabolic rate, were assumed to be fixed and then exposed to the different thermal environments [26]. In his review article, Enescu [27] stated that Fanger derived a mathematical equation based on the body heat balance known as Predicted Mean Vote (PMV). The PMV evaluates the thermal environment and the degree of warm and cold sensation by a standard seven-point of comfort scale, recommended by ASHRAE Standard [19], as shown in Table 1. PMV refers to the imbalance between the actual heat flow from a human body in a given environment and the heat flow required at a specified activity to achieve optimum comfort level. PMV is the most widely accepted tool for indoor thermal comfort assessment and was adopted in international standards such as ISO 7730 and ASHRAE Standard 55.
The PMV is the relationship between the sensitivity coefficient, ƴ, and thermal load, L.
PMV = ƴ.L (1)
ƴ is the thermal strain as some unknown function of L and metabolic rate, which could be obtained by solving the heat balance equation for the human body as shown in Eq. 2.
L = H - Ed- Esw- Eres- Cres- R - C (2)
The parameters in Eq. 2 are internal heat production, H, shown in Eq. 3; heat loss due to water vapor diffusion through the skin, Ed, shown in Eq. 4; heat loss due to perspiration, Esw, given in Eq. 5, latent heat loss due to respiration, Eres, given by Eq. 6, dry respiration heat loss, Cres, shown in Eq. 7, heat loss by radiation from the surface of the clothed body, R shown in Eq. 8, and heat loss by convection from the surface of the clothed body, C, shown in Eq. 9.
H = M - W (3)
Ed = 3.05[5.73 - 0.007(M - W) - pa] (4)
Table 1. Thermal sensation scale (Source [19])
|
Value |
Sensation |
|
−3 |
Cold |
|
−2 |
Cool |
|
−1 |
Slightly cool |
|
0 |
Neutral |
|
1 |
Slightly warm |
|
2 |
Warm |
|
3 |
Hot |
Esw= 0.42[(M - W) - 58.15] (5)
Eres= 0.173M(5.87 - pa) (6)
Cres= 0.0014M(34 - Ta) (7)
R = 3.96 * 10-8fcl[(Tcl + 273)4 - (Tmrt+ 273)4] (8)
C = fcl hc(Tcl - Ta) (9)
By substituting all the parameters of thermal load into the PMV thermal comfort model, Eq. 2 becomes:
PMV = [0.303 e-0.036M+ 0.028]L (10)
PMV = [0.303 e-0.036M+ 0.028] {(M - W) - 3.05 * 10-3 [5733 - 6.99 (M - W) - pa]
- 0.42[(M - W) - 58.15] - 1.7 * 105 M (58.15 - pa) - 0.0014M (34 - Ta)
- 3.96 * 10-8fcl[(Tcl+ 273)4 - (Tmrt+ 273)4] - fcl hc(Tcl- Ta)} (11)
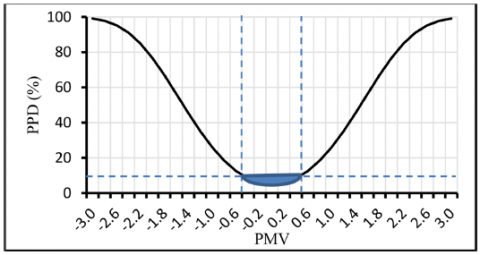
Fanger also developed another equation, the Predicted Percentage of Dissatisfied (PPD), to determine the percentage of occupants dissatisfied with the thermal comfort level. The relationship between PMV and PPD is expressed in Eq. 12. The acceptable thermal comfort range is where PMV is between −0.5 and +0.5 and PPD is less than 10%, as illustrated in the blue region in Figure 1.
PPD = 100 - 95 exp(-0.03353 PMV4 - 0.2179PMV2) (12)
It is important to note that the body’s surface area and weight play an important role in estimating the metabolic rate [28]. Typical metabolic rate values are provided in Appendix A-1 [19]. Khan and Pao [29] found that although occupants are in a similar indoor environment with different physiological conditions, their metabolic rates vary in their experimental analysis.
PMV model is only suitable in mechanically ventilated buildings instead of naturally ventilated buildings. However, there is an obvious discrepancy between the predicted and actual thermal sensation, particularly in the field study settings [30, 31]. The discrepancies between the predicted and actual thermal sensation are likely due to poor estimation of clothing insulation and metabolic rates, resulting in the inaccuracy of PMV prediction [21].
Figure 1. Predicted mean vote predicted - percentage of dissatisfied [PMV - PPD] chart
1.2.2 Adaptive predictive mean vote (aPMV) model
The PMV model is unsuitable for predicting the thermal sensation or comfort in a naturally ventilated building as thermal adaptation results in different thermal perceptions and tolerance of occupants in the free-running building [32]. The PMV model is not adequate in hot and humid climates. It uses mean effective outdoor temperature as the only input instead of clothing insulation, metabolic rate, relative humidity, and air velocity required by the PMV model [30]. In a naturally ventilated building and a warm to hot climate, the occupants prefer a higher range of indoor thermal environments than that predicted by the PMV model [33]. Hence, the adaptive PMV approach is established to determine the thermal comfort of the occupants of the building.
The adaptive PMV model (aPMV) is an extension of the PMV model for thermal comfort proposed by En. [34] in 1970. aPMV model is adopted by international thermal comfort standards such as European Standard EN 15251 and ASHRAE Standard called Adaptive Comfort Standard [35]. The adaptive approach model highlights the effect of human interaction and the environment [36].
To address the local variations, linear regression models were developed by fitting individual parameters and thermal sensations with the environment [30]. Due to individual differences, occupants can experience different thermal sensations, even in the same thermal environment, as concluded by Shen and Yu [37].
It is observed that the PMV model lost validity on the actual vote in an extreme thermal environment. The proposed aPMV model can explain if PMV underestimates or overestimates the thermal sensation in extremely warm and cold conditions, respectively, because the PMV model does not consider the physiological, psychological, and behavioral adaptation in the real world.
Research conducted using the existing ASHRAE RP-884 online database, the discrepancies between PMV thermal comfort model and thermal sensation in naturally ventilated and air-conditioned buildings are studied by Dear and Brager [32]. It is found that the PMV model underestimates the thermal sensation by 13% during summer and 35% during winter in naturally ventilated buildings. Meanwhile, the PMV model overestimates the thermal sensation by 31% and 33% during summer and winter, respectively. Experimental research in a naturally ventilated building in Chongqing, China, was conducted by Yao et al. [38] during both summer and winter. It has been found that the PMV is greater than the AMV in summer and is the opposite in winter. Another research by Han et al. [39] in China shows that the adaptive coefficient is -0.334 in warm conditions and -0.196 in cold conditions, considering the adaptation effect on individuals. In the case of an air-conditioned building, experimental research conducted by Fang et al. [40] in Hong Kong, where the climate is humid subtropical, the PMV model underestimates the human thermal sensation when the operative temperature is lower than 27°C. Another research conducted in Seoul, Korea, by Kim et al. [41] shows that the adaptive coefficient value is -5.74 in warm and -1.40 in cold conditions.
1.2.3 Extended predicted mean vote (ePMV) model
As the existing thermal comfort models, such as the PMV model, cannot be used as a generalized index for other parts of the world, especially in a warm and humid climate, and can only be used in air-conditioned buildings, Fanger and Toftum introduced extended Predicted Mean Vote (ePMV) [42]. It is introduced to highlight the expectations of people based on local climate and mechanical conditioning, particularly for warm and humid climates for naturally ventilated buildings [43]. A correction factor, also known as the expectancy factor, is incorporated, ranging from 0.5 to 1.0 depending on the indoor condition. The ePMV equation is expressed in Eq. 13.
ePMV = ep* PMV (13)
1.2.4 Modified predicted mean vote (mPMV) model
Core temperature, skin temperature, heart rate, and blood pressure are among the important parameters in the human thermoregulatory system [44]. The human metabolic rate is a sum of basal metabolic heat where a nude body is lying down in the case of thermoneutrality, metabolic heat of posture, and metabolic heat of activity. Activity level or metabolism rate varies by 0.3 PMV units on neutral sensation [45]. The variation in metabolism rate depends on climatological and biological factors. As Gilani et al. [44] realized, blood pressure influences the basal metabolic rate and is often associated with blood flow and body temperature. The relationship between the activity level and blood pressure is expressed in Eq. 14.
Activity level = 0.1092 * exp(MAP * 0.0296) (14)
The activity level using mean artery pressure, MAP, is then substituted into the existing PMV model and is called the modified Predicted Mean Vote (mPMV), as shown in Eq. 15.
mPMV = [0.303 e-0.036(0.1092 * exp(MAP * 0.0296) + 0.028] {[(0.1092 * exp(MAP * 0.0296)) -W]-3.05 * 10-3 [5733 - 6.99 ([(0.1092 * exp(MAP * 0.0296)) - W) - pa] -0.42[(0.1092 * exp(MAP * 0.0296)) -W) -58.15] -1.7 * 105 * (0.1092 *exp(MAP * 0.0296)) (58.15 - pa) - 0.0014(0.1092 * exp(MAP * 0.0296)) (34 - Ta) - 3.96 * 10-8fcl[(Tcl+ 273)4 - (Tmrt+ 273)4] - fcl hc(Tcl- Ta)} (15)
This paper has two main objectives. The first objective is to discuss the literature on thermal comfort models, heat balance approach models, and adaptive approach models and addresses the discrepancy in previous investigations. The proposed models to estimate the thermal comfort in the building envelope available in the literature are summarized in Table 2. The second objective is to mitigate the discrepancy by developing a modified adaptive predictive mean vote that suits the tropical climate. Hence, a field case study by an experimental measurement in a single-story postgraduate office building has been performed in Malaysia. A modified adaptive predicted mean vote (maPMV) model is developed based on modifying the existing aPMV utilizing the case study results.
Table 2. Summary of proposed models to predict the buildings’ thermal comfort
|
Model |
|
Suggested by |
Year |
|
Predicted Mean Vote |
PMV |
Fanger [25] |
1970 |
|
Predicted Percentage of Dissatisfied |
PPD |
Fanger [25] |
1970 |
|
Adaptive Predicted Mean Vote |
aPMV |
Nicol and Humphreys [42] |
2002 |
|
Extended Predicted Mean Vote |
ePMV |
Fanger and Toftum [43] |
2002 |
|
Modified Predicted Mean Vote |
mPMV |
Gilani et al. [44] |
2016 |
Modifications of the existing thermal comfort estimation models are advised by Nicol and Humphreys [43] to address the expectations of people based on local climate and mechanical conditioning, particularly for warm and humid climates. A case study in this research comprises both subjective and objective studies. The subjective study included administering a questionnaire to subjects during the experimental measurement. The objective and subjective studies were conducted in Malaysia on 26 March 2019.
3.1 Experimental setup
Figure 2. Location map of the case study in the solar research site in UTP - Malaysia
The micro-climatic parameters such as outdoor ambient temperature, outdoor relative humidity, and outdoor solar irradiance were measured simultaneously with the subjective study. The experimental measurement has taken place in the postgraduate office building in the solar research site at Universiti Teknologi PETRONAS (UTP), Figure 2, about 40 km from Ipoh and 213 km north of Kuala Lumpur - Malaysia. The geographical location of the solar research site is at an altitude of 3.12 °N and a longitude of 101.55 °E.
Figure 3 shows the postgraduate office building at the solar research site. The office building is constructed using low-cost materials, including a sandwich panel for the roof, a composite metal sheet for the exterior wall, and a gypsum board interior wall. The geometrical and thermal properties of each wall and the roof are presented in Table 3. The wall materials permit large heat transfer from the outside to the inside of the building resulting in low thermal comfort. The office was equipped with 2 × 1.5 horsepower air-conditioning units.
Figure 3. Postgraduate office in the solar research site in UTP, showing external frontal view of the experimental building
Table 3. Physical and thermal properties of the wall and roof of the experimental office
|
Wall/roof |
Thermal coefficient, U (W/m2 + K) |
Area of surface, A (m2) |
|
Wall A |
4.853 |
22.92 |
|
Wall B |
4.853 |
13.80 |
|
Wall C |
4.853 |
22.92 |
|
Roof |
0.290 |
35.96 |
3.2 Experimental measurements and instrumentations
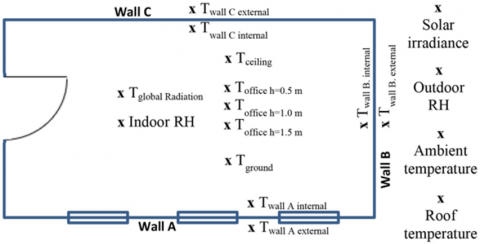
The weather in this region is mainly hot and humid, with showers and the occasional thunderstorm. The mean annual relative humidity is around 80%, and the mean annual ambient temperature is around 32°C. Figure 4 displays the position of thermocouples, globe thermometer, and hygrometer in the experimental office. The office building walls exposed to the external environment are labeled Walls A, B, and C, respectively.
Several parameters have been considered and measured to evaluate the thermal conditions of the building in a tropical climate, as follows:
Figure 4. Locations of the measuring sensors inside and outside the experimental office
3.3 Subjective study
A subjective approach study is based on the findings of actual thermal sensation in field settings. The thermal response, or AMV, was measured by a descriptive ‘standard seven-point comfort scale’ by recording occupants’ comfort vote’ in a questionnaire. In the current case study, the questionnaire was prepared following the ASHRAE Standard 55-Informative Appendix E ‘thermal environment survey’ shown in Appendix B of this article. The prime target of the subjective approach study is to investigate any discrepancies between AMV and calculated PMV indexes. The subjective study was conducted for two groups of different sizes to make the study relevant. The first group consisted of 10 participants, coded as case 1, and the second group consisted of 20 participants, coded as case 2. Table 4 shows the average personal variables for both cases of participants in terms of metabolic rates and clothing.
All participants were tested clinically in UTP medical clinic to ensure that their normal healthy conditions were normal. At the beginning of the subjective study, the participants were advised to sit or stand idle for about 30 minutes to regulate their body temperature at room temperature. This procedure is necessary to minimize errors and maintain uniformity throughout the study.
Table 4. Average personal variables for the experimented cases
|
Case |
# of participants |
Statistical prediction |
Metabolic rate |
Clothing insulation |
|
(met) |
(clo) |
|||
|
Case 1 |
10 |
Average |
1.02 |
0.563 |
|
Standard deviation |
0.0632 |
0.0718 |
||
|
Case 2 |
20 |
Average |
1.3 |
0.588 |
|
Standard deviation |
0.0165 |
0.0544 |
3.4 Objective study
The target of the objective study is to determine thermal comfort based on site measurements, clothing insulation data, and metabolic rate. The indoor thermal environment was obtained by measuring the office temperature at three different heights, mean radiant temperature, and relative humidity. The measured parameters have been used to calculate the thermal sensation with the existing Fanger PMV model, as expressed in Eq. 11. The participant’s average clothing insulation and metabolic rate were obtained from the questionnaire during the subjective study. The thermal sensation from the PMV model was then validated with the thermal response, or AMV, recorded in the subjective study to inspect any discrepancies. In case of discrepancies, linear regression models would be developed to determine if the PMV underestimates or overestimates the AMV.
4.1 Analysis of the subjective method
To study the effects of physiological and psychological adaptation, the thermal sensation vote of the participants recorded on the questionnaire was validated by the answers to the correlated questions about their thermal preferences. The analysis of the subjective method provided some values that are essential to be used in the predictions of PMV and AMV.
Small differences in the participants’ answers in both cases were realized. This is expected as occupants can experience different thermal sensations, even in the same thermal environment. In their review article, Wang et al. [46] second this observation as it is common in all individual responses within a group.
4.2 Comparison between AMV and PMV
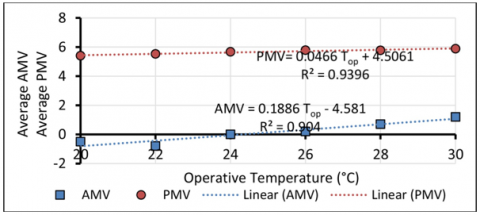
Figures 5 and 6 represent the trends of AMV and PMV against the operative temperature, Top, respectively. The AMV values were obtained through a questionnaire survey during the subjective study using the seven-point comfort scale to record the ‘comfort vote’ at different operating temperatures. The participants also recorded their metabolic rate and clothing insulation level in the subjective study. The PMV values were calculated using the existing heat balance theory, expressed in Eq. 11.
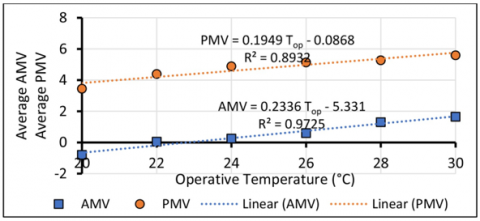
It has been observed that the PMV index in case 1 and case 2 ranges between 3 to 7, which is hot to extremely hot. However, the actual thermal sensation recorded by both group participants ranges from -1 to 2, slightly cool to warm. Figures 5 and 6 show that the participants feel neutral when the operative temperature is at 24°C for case 1 and 23°C for case 2.
Figure 5. Comparison between AMV and PMV (case 1)
According to ASHRAE Standard 55, the acceptable range of indoor thermal comfort levels is between -0.5 and 0.5. Therefore, the range of optimum operative temperature in the postgraduate office building range from 23°C to 26°C. The difference in the PMV index in both groups of participants is mainly due to the overcrowding in the second group resulting in excessive heat accumulated in the room.
Figure 6. Comparison between AMV and PMV (case 2)
A linear regression model is defined mathematically by Eq. 16. It is a standard technique used to compute the estimations of parameters and to fit the scattered data in function to dependent variable, y, and independent variable, x. The linear regression model development procedure is adopted in this analysis to address the local variations. The slope and y-intercept of the equation are represented as:
y = bx + a (16)
The linear regression equations for AMV and PMV against the operative temperature are shown in Eqns. 17 and 18 for case 1 and case 2, respectively.
Case 1,
AMV = 0.1886Top - 4.581 R2 = 0.904 (17)
PMV = 0.0466Top + 4.5061 R2 = 0.9396 (18)
Case 2,
AMV = 0.2336Top - 5.331 R2 = 0.9725 (19)
PMV = 0.1949Top - 0.0868 R2 = 0.8932 (20)
The slope of the line represents the thermal sensation vote for the optimum temperature. It is observed that the AMV is more sensitive than the calculated PMV index. The trend of the AMV and PMV results in the current case study matches many previously reported investigations, like the works of Cheung et al. [15], Lin and Deng [47], Yao et al. [38], Kim et al. [41], and Fanger [42].
The results achieved in terms of Eqns. 17-20 demonstrate a strong positive correlation between AMV and PMV to the operative temperature. These indices’ correlation coefficient, R2 values, were found as 0.904, 0.9396, 0.9725, and 0.8932 for Eqns. 17-20, respectively. Therefore, it is reasonable to use operative temperature as the main dictator for analysis of the thermal sensation limit, which is applied in international standards.
For both case 1 and case 2, presented in Figures 5 and 6, there is an obvious discrepancy between the recorded AMV and calculated PMV. It can be observed that the AMV values are lower than the corresponding calculated PMV index. This discrepancy explains that the PMV overestimates the thermal sensation in the indoor environment. Adaptation processes influence the deviations in the AMV values to achieve a thermally comfortable indoor environment. The overestimation results obtained in this study have the same trend as the claims of Ahmed et al. [14] and Cheung et al. [14], which suggested that the PMV overestimates the thermal sensation in the tropical climate.
4.3 Development of modified adaptive predicted mean vote (maPMV)
In standard formulation, a set of n pairs of observations (xi, yi) is commonly used to find a function giving the value of the dependent variable, y, from the values of an independent variable, x. The least square method is used in the adaptive approach model to derive the adaptive coefficient. The current study calculates the modified adaptive coefficient using Yao et al. [38] procedure.
$m a P M V=\frac{P M V}{1+\Lambda^* P M V}$ (21)
$\frac{1}{A M V}=\frac{1}{P M V}+\Lambda$ (22)
y = x + ʎ (23)
If letting x = 1/PMV and y = 1/AMV, then, for n observations, or pairs of x, y:
$\Lambda=\frac{\sum_{i=1}^n\left(y_i-x_i\right)}{n}$ (24)
Equation 22 was obtained by transforming Eq. 21 to derive the adaptive coefficient. The values of the adaptive coefficient were calculated using Eq. 24, and the maPMV for the two cases is expressed in Eqns. 25 and 26, respectively, for both groups of participants.
Case 1, $m a P M V=\frac{P M V}{1+0.2953 *_{P M V}}$ , ʎ = 0.2953 (25)
Case 2, $m a P M V=\frac{P M V}{1+2.0506 *_{P M V}}$ , ʎ = 2.0506 (26)
As the experimental measurements were conducted in a tropical climate, similar to warm conditions, the modified adaptive coefficient calculated in this research matches the method of Yao et al. [38]. In a warm environment inside the building, the adaptive coefficient is greater than 0.0, and in cold conditions, the adaptive coefficient is lesser than 0.0 [38]. Therefore, it could be concluded that the developed maPMV provides a better thermal sensation predictor than PMV.
In the adaptive approach model, self-regulatory actions adapt to the condition and achieve desired thermal comfort. The three main self-regulatory actions are physiological adaptation, psychological adaptation, and behavioral adaptation.
In response to the adaptation process, the participants suggested installing a mechanical ventilation system, such as an exhaust fan, to improve air circulation and ventilation in the room. The exhaust fan can draw warm and humid air out of the room. In addition to that, participants also suggested the installation of blinders or film reflectors on the window to avoid direct solar irradiance into the room, which increases the cooling requirements to cool the room to the desired indoor environment. Also, it is recommended to use alternative methods such as green façades or green roof covers to achieve better thermal comfort levels so that occupants can work comfortably and efficiently.
The application of the PMV model in tropical climates was evaluated through a subjective and objective study of an air-conditioned office building in Malaysia to assess the indoor thermal comfort level. According to the adaptive approach model, a building’s occupants play an important role in achieving the desired thermal comfort level by adapting to the office environment. The adaptive approach model contributes to reducing heating and cooling needs in the building, which reduces the building’s energy consumption. This is important in a tropical climate because cooling accounts for most of a building’s total energy use.
The participants were likely to feel comfortable when the indoor environment temperature was between 24°C and 26°C, which is the recommended range by the DOSM. Therefore, setting the operative temperature of air-conditioning in the room to 25°C is safe and can avoid energy wastage.
A new adaptive approach model was developed, effective in hot and humid weather (e.g., tropical climate). The new maPMV is more suitable for predicting thermal comfort in tropical climates.
For future development of the work, it is recommended to conduct a comparative analysis of the developed maPMV with experimental measurements of school classrooms or partially exposed buildings to solar radiation. The partially shaded building methods could be achieved by green façades or roof covers.
The questionnaire of case 1 and case 2, responses of participants and all measurement data are available in UTPedia, URL: http://utpedia.utp.edu.my/20538/
The authors wish to acknowledge Universiti Teknologi PETRONAS (UTP) - Malaysia for supporting the work under RIPHEN research program and the funding under grant YUTP - FRG, CS: 015LC0-206. Researchers of Universitas Muhammadiyah Surakarta (UMS) - Indonesia are acknowledged for contributing to the project.
[1] National Health Service (NHS-UK). (2020). Sick building syndrome. https://www.nhs.uk/conditions/sick-building-syndrome/
[2] Parsons, K.C. (2005). Human thermal environments. Taylor & Francis: New York.
[3] Latha, P. K., Darshana, Y., Venugopal, V. (2015). Role of building material in thermal comfort in tropical climates - A review. Journal of Building Engineering, 3: 104-113. https://doi.org/10.1016/j.jobe.2015.06.003
[4] Pérez, G., Coma, J., Sol, S., Cabeza, L.F. (2017). Green façade for energy savings in buildings: The influence of leaf area index and façade orientation on the shadow effect. Applied Energy, 187, 424-437. https://doi.org/10.1016/j.apenergy.2016.11.055
[5] Yang, L., Yana, H., Lam, J. C. (2014). Thermal comfort and building energy consumption implications - A review. Applied Energy, 115, 164-173. https://doi.org/10.1016/j.apenergy.2013.10.062
[6] Gou, Z., Gamage, W., Lau, S.S.Y., Lau, S.S.Y. (2018). An investigation of thermal comfort and adaptive behaviors in naturally ventilated residential buildings in tropical climates: A pilot study. Buildings, 8: 5. https://doi.org/10.3390/buildings8010005
[7] Taleghani, M., Tenpierik, M., Kurvers, S., den Dobbelsteen, A. (2013). A review into thermal comfort in buildings. Renewable and Sustainable Energy Reviews, 26: 201-215. https://doi.org/10.1016/j.rser.2013.05.050
[8] Rupp, R.F., Vásquez, N.G., Lamberts, R. (2015). A review of human thermal comfort models in the built environment. Energy and Buildings, 105: 178-205. https://doi. org/10.1016/j.enbuild.2015.07.047
[9] Berardi, U. (2017). A cross-country comparison of the building energy consumptions and their trends. Resources, Conservation and Recycling, 123: 230-241. https://doi.org/10.1016/j.resconrec.2016.03.014
[10] Zhou, Z., Feng, L., Zhang, S., Wang, C., Chen, G., Du, T., Li, Y., Zuo, J. (2016). The operational performance of “net zero energy building”: A study in China. Applied Energy, 177: 716-728. https://doi.org/10.1016/j.apenergy.2016.05.093
[11] Li, X., Wen, J. (2017). Net-zero energy building clusters emulator for energy planning and operation planning. Computers, Environment and Urban Systems, 62: 168-184. https://doi.org/10.1016/j.compenvurbsys.2016.09.007
[12] Suruhanjaya, T. (2011). Malaysia Energy Information Hub, Final energy demand. https://meih.st.gov.my/statistics
[13] Kwong, Q.J., Adam, N.M., Sahari, B.B. (2014). Thermal comfort assessment and the potential energy efficiency enhancement in modern tropical buildings - A review. Energy and Buildings, 68: 547-557. https://doi.org/10.1016/j.enbuild.2013.09.034
[14] Zaki, S.A., Damiati, S.A., Rijal, H.B., Hagishima, A., Abd Razak, A. (2017). Adaptive thermal comfort in university classrooms in Malaysia and Japan. Building and Environment, 122: 294-306. https://doi.org/10.1016/j.buildenv.2017.06.016
[15] Cheung, C., Fuller, R.J., Luther, M. (2005). Energy efficient envelope design for high-rise apartments. Energy and Buildings, 37: 37-48. https://doi.org/10.1016/j.enbuild.2004.05.002
[16] Mirrahimi, S., Mohamed, M.F., Haw, L.C., Ibrahim, N.L.N., Yusoff, W.F.M., Aflaki, A. (2016). The effect of building envelope on the thermal comfort and energy saving for high-rise buildings in a hot-humid climate. Renewable and Sustainable Energy Reviews, 53: 1508-1519. https://doi.org/10.1016/j.rser.2015.09.055
[17] Ogbonna, A.C., Dong, J.H. (2008). Thermal comfort in sub-Saharan Africa: Field study report in Jos-Nigeria. Applied Energy, 85: 1-11. https://doi.org/10.1016/j.apen-ergy.2007.06.005
[18] International Organization for Standardization. (2015). Ergonomics of the thermal environment - Analytical determination and interpretation of thermal comfort using calculation of the PMV and PPD indices and local climate thermal comfort criteria (ISO 7730). https://www.iso.org/standard/53115.html
[19] American Society of Heating, Refrigerating and Air-Conditioning Engineers. (2004). Thermal environment conditions for human occupancy (ANSI/ASHRAE Standard 55).
[20] Department of Standards Malaysia. (2001). MS1525 Code of practice on energy efficiency and use of renewable energy for non-residential buildings.
[21] Charles, K.E. (2003). Fanger's thermal comfort and draught models. Institute of Research in Construction, National Research Council of Canada. https://doi.org/10.4224/20378865
[22] Orosa, J.A., Oliveira, A.C. (2011). A new thermal comfort approach comparing adaptive and PMV models. Renewable Energy, 36(3): 951-956. https://doi.org/10.1016/j.renene.2010.09.013
[23] Djongyang, N., Tchinda, R., Njomo, D. (2010). Thermal comfort: A review paper. Renewable and sustainable energy reviews, 14(9): 2626-2640. https://doi.org/10.1016/j.rser.2010.07.040
[24] Hensen, J.L.M. (1991). On the thermal interaction of building structure and heating and ventilating system. Technische Universiteitt Eindhoven.
[25] Fanger, P.O. (1970). Thermal comfort, analysis and application in environmental engineering. Copenhagen: Danish Technical Press.
[26] Katić, K., Li, R., Zeiler, W. (2016). Thermophysiological models and their applications: A review. Building and Environment, 106: 286-300. https://doi.org/10.1016/j.build-env.2016.06.031
[27] Enescu, D. (2017). A review of thermal comfort models and indicators for indoor environments. Renewable and Sustainable Energy Reviews, 79: 1353-1379. https://doi.org/10.1016/j.rser.2017.05.175
[28] Djamila, H. (2017). Indoor thermal comfort predictions: Selected issues and trends. Renewable and Sustainable Energy Reviews, 74: 569-580. https://doi.org/10.1016/j.rser.2017.02.07
[29] Khan, M.H., Pao, W. (2015). Thermal comfort analysis of PMV model prediction in air conditioned and naturally ventilated buildings. Energy Procedia, 75: 1373-1379. https://doi.org/10.1016/j.egypro.2015.07.218
[30] Song, D.S., Kang, K.N., Kato, S. (2007). New approaches of indoor environmental control for energy saving-adaptive model. Journal of the Korean Society of Living Environmental System, 14: 253-262.
[31] Djamila, H., Chu, C.M., Kumaresan, S. (2013). Field study of thermal comfort in residential buildings in the equatorial hot-humid climate of Malaysia. Building and Environment, 62: 133-142. https://doi.org/10.1016/j.buildenv.2013.01.017
[32] Dear, R., Brager, G.S. (1998). Developing an adaptive model of thermal comfort and preference. ASHRAE Transactions, 104(1a): 145-167.
[33] Brager, G.S., De Dear, R.J. (1998). Thermal adaptation in the built environment: a literature review. Energy and buildings, 27(1): 83-96. https://doi.org/10.1016/S0378-7788(97)00053-4
[34] En, D. (2007). Indoor environmental input parameters for design and assessment of energy performance of buildings addressing indoor air quality, thermal environment, lighting and acoustics. In DIN EN 15251: 2007-08, Beuth Verlag, Berlin.
[35] Humphreys, M.A., Nicol, J.F. (2002). The validity of ISO-PMV for predicting comfort votes in every-day thermal environments. Energy and buildings, 34(6): 667-684. https://doi.org/10.1016/S0378-7788(02)00018-X
[36] Zingano, B.W. (2001). A discussion on thermal comfort with reference to bath water temperature to deduce a midpoint of the thermal comfort temperature zone. Renewable energy, 23(1): 41-47. https://doi.org/10.1016/S0960-1481(00)00101-4
[37] Shen, C., Yu, N. (2010). Study of thermal comfort in free-running buildings based on adaptive predicted mean vote. In 2010 International Conference on E-Product E-Service and E-Entertainment, Henan, China, pp. 1-4. https://doi.org/10.1109/ICEEE.2010.5660625
[38] Yao, R., Li, B., Liu, J. (2009). A theoretical adaptive model of thermal comfort-Adaptive Predicted Mean Vote (aPMV). Building and environment, 44(10): 2089-2096. https://doi.org/10.1016/j.buildenv.2009.02.014
[39] Han, J., Zhang, G., Zhang, Q., Zhang, J., Liu, J., Tian, L., Moschandreas, D.J. (2007). Field study on occupants’ thermal comfort and residential thermal environment in a hot-humid climate of China. Building and Environment, 42(12): 4043-4050. https://doi.org/10.1016/j.buildenv.2006.06.028
[40] Fang, Z., Zhang, S., Cheng, Y., Fong, A.M., Oladokun, M. O., Lin, Z., Wu, H. (2018). Field study on adaptive thermal comfort in typical air conditioned classrooms. Building and Environment, 133: 73-82. https://doi.org/10.1016/j.buildenv.2018.02.005
[41] Kim, J.T., Lim, J.H., Cho, S.H., Yun, G.Y. (2015). Development of the adaptive PMV model for improving prediction performances. Energy and Buildings, 98: 100-105. https://doi.org/10.1016/j.enbuild.2014.08.051
[42] Fanger, P.O., Toftum, J. (2002). Extension of the PMV model to non-air-conditioned buildings in warm climates. Energy and buildings, 34(6): 533-536. https://doi.org/10.1016/S0378-7788(02)00003-8
[43] Nicol, J.F., Humphreys, M.A. (2002). Adaptive thermal comfort and sustainable thermal standards for buildings. Energy and buildings, 34(6): 563-572. https://doi.org/10.1016/S0378-7788(02)00006-3
[44] Gilani, S.I.U.H., Khan, M.H., Ali, M. (2016). Revisiting Fanger’s thermal comfort model using mean blood pressure as a bio-marker: An experimental investigation. Applied thermal engineering, 109: 35-43. https://doi.org/10.1016/j.applthermaleng.2016.08.050
[45] MacAuley, D., McCrum, E.E., Stott, G., Evans, A.E., McRoberts, B., Boreham, C.A., Trinick, T.R. (1996). Physical activity, physical fitness, blood pressure, and fibrinogen in the Northern Ireland health and activity survey. Journal of Epidemiology & Community Health, 50(3): 258-263. https://doi. org/10.1136/jech.50.3.258
[46] Wang, Z., de Dear, R., Luo, M., Lin, B., He, Y., Ghahramani, A., Zhu, Y. (2018). Individual difference in thermal comfort: A literature review. Building and Environment, 138: 181-193. https://doi.org/10.1016/j.buildenv.2018.04.040
[47] Lin, Z., Deng, S. (2008). A study on the thermal comfort in sleeping environments in the subtropics-developing a thermal comfort model for sleeping environments. Building and Environment, 43(1): 70-81. https://doi.org/10.1016/j.buildenv.2006.11.026