OPEN ACCESS
Series capacitors are installed in high voltage alternating current transmission lines to counteract the inductive reactance of the line. The resonance caused by series capacitors between electric system and mechanical system at frequencies less than the synchronous speed, leads to torsional oscillations. Undamped oscillations may cause a severe fatigue in the turbine generator shaft system. Rotating component undergoes various modes of oscillations when it is subjected to resonance. Rotor oscillate in different modes such as swing mode, super synchronous mode, electromechanical mode and torsional mode. Rotor dynamics of rotating structure depends on several factors like Coriolis Effect, moment of inertia and stiffness coefficient. Modal analysis using finite element method gives the natural frequency and mode shapes of any rotating structures. In this paper, a two mass rotating system which is analogous to turbine generator is subjected to resonance by adding series capacitors and its dynamic behavior is studied using finite element method.
modal analysis, subsynchronous resonance, turbine-generator, finite element method
Over the past century, power systems have grown in a tremendous way which has also looking after about several new problems. One of them is on shaft systems of turbine generator. Capacitors interacts with long transmission lines and causes damage to the shaft which connects turbine with generator. By decreasing the effective reactance, it increases stability of the system and improves the load carrying capability of multiphase power transmission lines. By controlling the line reactance it gives the user a better control over load sharing between parallel transmission lines. Subsynchronous resonance phenomena can occur due to induction generator effect, torsional interaction and transient torque (Padiyar, 2002; Childs and Scharrer, 1988). The first two will occur during the initial stages of the fault and it can be analyzed using Eigen values. Transient torque arises during large short circuit which oscillate at one of the system natural frequencies. Rotor in the turbine generator system is a complex system where many electrical components are involved. The length and area of the rotor will be very large and it weighs over hundred tons (Assenkamp et al., 2017; Wang et al., 2017). Turbine section is a combination of several rotating masses which is mounted on the shaft of turbine generator system. Turbine generator system has six concentrated masses which represent the generator rotor, two numbers of low pressure sections of turbine (LP), an intermediate pressure section of turbine (IP), and a high pressure section of turbine (HP). The sixth mass represents the excitation system mass mounted on the shaft. Torsional oscillations occur when rotors on the shaft starts whirling relative to each other (Mohammadpour et al., 2014). Some of the torsional oscillations can be damped if the magnitude of the torque in the shaft is low. But the main problem of lightly damped oscillation is due to the interaction with the external network. Modal analysis using finite element method is used to determine the vibration characteristics which involves natural frequencies and mode shapes of any structure or a particular rotating machine component. It is the initiating point for a dynamic analysis such as transient dynamic analysis, harmonic or spectrum analysis. Modal analysis can be applied also for a pre-stressed structures like spinning turbine blade. If the structure or a machine component is damped, the analysis is defined as damped modal analysis where the natural frequencies and mode shapes become complex. In a rotating machine component, the gyroscopic effects resulting from rotational velocities are introduced into the modal system which ultimately change the system's damping. The impact of damping changes when bearing is present (Fischer et al., 2010; Mohammadpour & Santi, 2015). The relation between natural frequencies along with rotational velocity can be studied using Campbell diagram. The Campbell diagram gives valuable information about frequency as a function of rotation speed of the shaft.
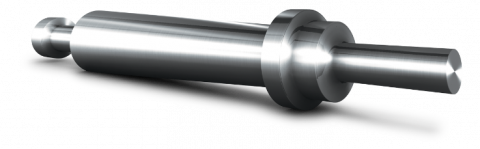
The generator shaft is similar in size to the turbine. In practice, shafts are not perfectly aligned and it is the coupler which has to damp the misalignments. Couplings and supergrip bolts are used to damp the misalignment. The couplings are able to give high torque and high speed with low mass as well as low torque and low speed capabilities. The coupling can be rigid as well as flexible (IEEE Sub synchronous resonance working group, 1985). A rigid coupling is used when the driver generates more amount of torque and when there is no change in the axial position of the shaft which is coupled. Rigid couplings are less expensive compared to flexible couplings. In Figure 1. Model of a rotor shaft is shown. Most of the rotor shaft in a turbine generator shaft is made with both ferrous and nonferrous material. Some of the common material used are hot rolled plain carbon steel, cold drawn plain carbon/alloy composition, High strength micro alloy (HSMA) and alloy steels. Stiffness coefficient plays an important role in the turbine generator shaft. The shaft model consists of a rotating shaft which transmits the torsional torque and also a static shaft which supports the bending moment which is caused by the own weight of the blades. It is clear that when the synchronism is not maintained on the turbine generator shaft, it will leads to huge economic loss for any power system operation unit.
Figure 1. Model of rotor shaft
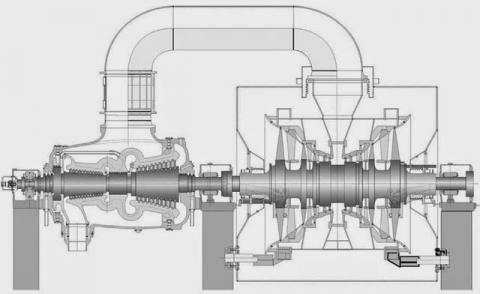
Figure 2. Combination of Turbine – Generator shaft
The most common problem arising in turbine generator shaft lines is the loss of eccentricity between Rotor–stator and also there may be chance of distortion in bearing. Whirl instability may be triggered when the slender rotor resonance due to the series capacitors connected in the transmission line. In Figure 2, the turbine generator shaft line is shown. It consists of bearings which is connected in both horizontal and vertical arrangements and couplers total arrangement (Someya, 1989; Limebeer & Harley, 1981). A typical rotor diameter varies from 100 m -107 m and weighs 95-100 tons.
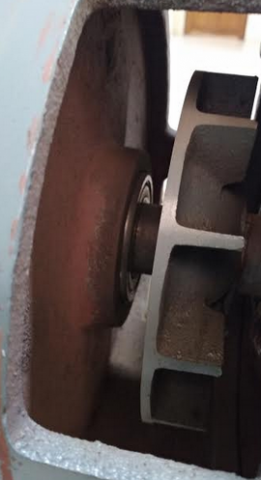
The main shaft is established by an alloy steel. The main shaft is supported by two main bearings and both bearings are have the capacity to align themselves. The load factor of the shaft line is more and it is greased to provide soft Lubrication system. The bearing seals are maintenance free. The load on each rolling element is calculated by the formulae (1) and (2). Bearings in the actual model is shown in figure 3.
$Q _ { R } = \left[ \frac { 1 } { Z } \sum _ { J = 1 } ^ { z } \left( Q _ { R J} \right) ^ { \mathrm { w } _ { 2 } } \right] ^ { \frac { 1 } { W _ { 2 } } }$ (1)
$Q _ { R } =$ Average load on rotating ring
$Z =$ Number of rolling elements
$W _ { i } =$ Constant
$Q _ { S } = \left[ \frac { 1 } { Z } \sum _ { J = 1 } ^ { z } \left( Q _ { S J } \right) ^ { w _ { c } } \right] ^ { \frac { 1 } { W _ { c } } }$ (2)
$Q _ { S } =$ Average load on stationary rings
$Z =$ Number of rolling elements
$W _ { e } =$ Constant
Figure 3. Bearings in the experimental setup
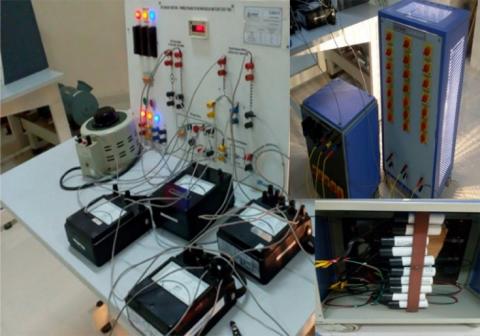
The entire experimental setup is shown in the Figure 4. It consists of two rotating machines. The machine configuration is given in table I. Capacitors are rated till 5kVAr and 10 units of capacitors are installed for the series compensation.
Figure 4. (a), (b) and (c) Experimental set up
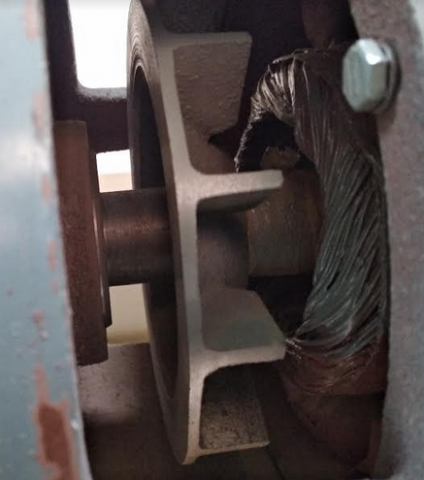
The length of the turbine generator shaft line is around 0.92 meters. Mass of the two machines is considered as 40kg which is based on the density of the material. A coupler connect the two machines and prevent any misalignment. The rotor shaft connects the turbine through a bearings. Ball bearings used in both the machines. It reduces the friction during rotation and it supports both radial and axial loads. Ball bearings available in single and double row designs which can be open or sealed. In experimental set up open type ball bearings is used. Due to the low frictional torque, it supports high speed operation of the machine. The main fucntion of the bearings are to provide smooth rotation and to be stable at high temperatures. Figure 5 and 6 shows the bearings in the generator side and turbine side.
Table 1. Machine parameters
|
Machine 1 |
Machine 2 |
||
|
Source |
AC |
Source |
DC |
|
Output power |
2.2kW |
Output power |
3.7kW |
|
Max speed |
1500rpm |
Max speed |
1500rpm |
|
Voltage (Max) |
415V AC |
Voltage (Max) |
220V DC |
|
Current (Max) |
4A |
Current (Max) |
19A |
|
Insulation class |
F |
Insulation class |
F |
Figure 5. Shaft connected to generator with bearings
Figure 6. Shaft connected to turbine with bearings
There are several kinds of analyses used in engineering and technology. Quasi-static analysis is where the load is applied slowly and make the acceleration zero. Dynamic analysis considers the acceleration as a non-zero element. Compared to both quasi-static and dynamic analysis, modal analysis provides the response of the system. Every rotating structure has an internal frequency or resonant frequency where it starts vibrating. At this frequency, transfer of energy takes place and when this frequency increases, the losses start increasing. The 3D model of the shaft line is modelled in Ansys. Modal analysis is carried out in an efficient manner where point mass, stiffness coefficient is given as per the readings calibrated during compensation. Modal analysis settings are available in table 2.
Table 2. Analysis settings
|
SL NO |
Parameter |
Statistics |
|
1 |
Analysis method |
Sweep Method |
|
2 |
Element Option |
Solid |
|
3 |
Nodes |
62722 |
|
4 |
Elements |
13055 |
|
5 |
Environment Temperature |
22. °C |
|
6 |
Rotational Velocity at 50% compensation |
187 rad/s ~ 1786 rpm |
|
7 |
Coriolis Effect |
Considered |
|
8 |
Modes considered |
6 |
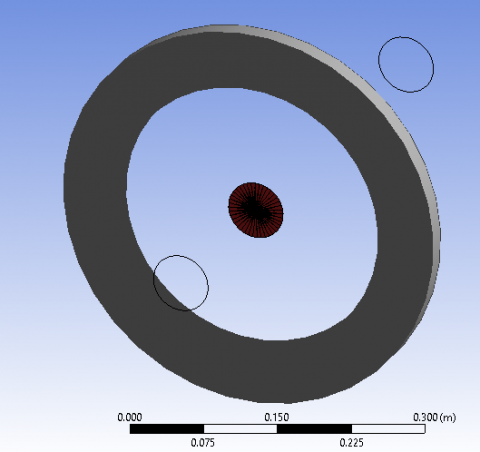
Figure 7. Representation of bearing in wireframe form
Bearing on both the sides of the turbine shaft line is modelled in the modal analysis. Torque which is calibrated at 50% of series compensation is related to the stiffness coefficient of the machine. Dampers are not considered in the turbine generator shaft line.
Figure 8. Meshing of Turbine generator shaft line
Meshing is done in finite element method to discrete the model into different elements. Meshing here is done on the curvature and the relevance centre is kept as fine. High smoothing is required to set the mathematical model in an efficient way. The size of each mesh is made as 0.2m based on the total size of the turbine generator shaft line. Program controlled default settings is followed for transition ratio, maximum layers and growth rate. Inflation algorithm and triangular mesh is defined in the mathematical model. Mesh morphing is disabled as it can save calculation time and increase accuracy. Tetrahedral elements can be a better option for a structure having complex geometry. However, when the shape functions are integrated with the points of mass, it is less accurate than the other shape while meshing. To avoid the complexity and also considering this model, triangular mesh is considered in the meshing. Total number of nodes formed after meshing is around 62722 and elements is around 13055 which is a medium size model and it reduces the processing time and space required for solving the model.
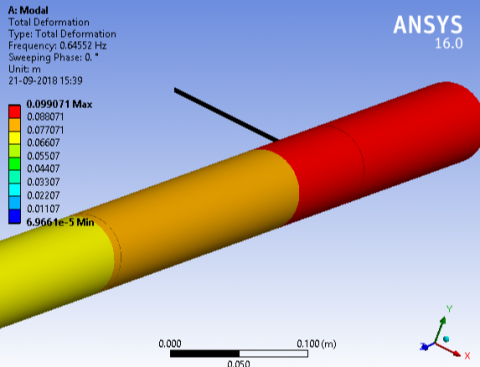
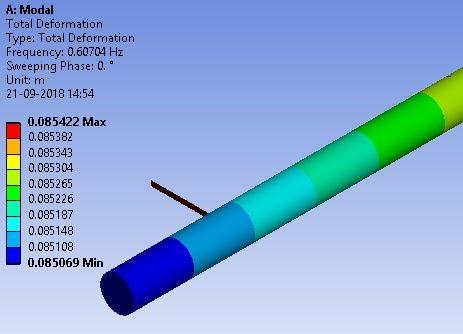
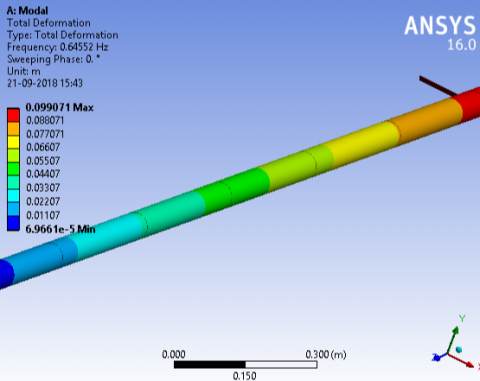
Modal analysis is performed in Ansys which uses finite element method to build the mathematical model. Sweep method is used for the analysis. 6 multimode oscillation is simulated and analyzed. In Figure 9, the deformation of the turbine generator shaft line is shown. It is clear from the deformation that the turbine side shaft stress is more when compared to the generator side shaft. The frequency at which the turbine side shaft runs is around 0.64552Hz which is different from the generator side. In figure 10, deformation occurs in the frequency around 0.60704Hz. The maximum stress is around 0.085422 in the generator side and 0.099071 in the turbine side.
Figure 9. Total deformation near the bearing side of turbine
Figure 10. Total deformation near the bearing side of generator
In Figure. 11 the total deformation of turbine generator shaft line is shown. Though there is a load which is denoted by the point mass in the 4,5 & 6 sliced section, the stress caused by the load is less when compared to the turbine side shaft line. Coupler connecting the two masses have a little damping factor on the shaft line. It is also to be noted that bearing effect of on the turbine side shaft line did not created any impact on the stress caused by the series compensation of the line. When compared to the coupler, bearing is not damping the stress on the turbine generator shaft.
Figure 11. Total deformation on turbine generator shaft line
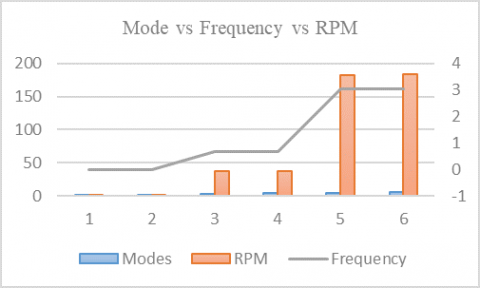
In Campbell diagram each line denotes the origin of frequency which results in rotating of the rotor with respect to the rotational velocities. The direction of rotation can be backward or forward. In some situations, the whirl frequency is denoted as undetermined which means that there is no whirling happening. If the whirling direction is in forward condition, the rotating structure is in same direction and vice versa. If the Campbell diagram is having any unstable condition, it means the shaft is rotating in a divergent trajectory instead of an elliptical trajectory. Black colour lines in the diagram is the ratio between the frequency of the whirl and rotational velocity. The intersection of these black lines is denoted with a red marker. Critical speed is the intersection of these lines and at this critical speed, the rotating frequency resonates with the natural frequency.
Figure 12. Campbell diagram for modal analysis
In Figure 12, the Campbell diagram for the experimental set up is plotted and the mode 1 becomes unstable having a negative value of -0.002147 rad/s. there are two backward and forward whirling directions which are marked as stable. The maximum critical speed is around 19.213 rad/sec which occurs in Mode 6. (See table 2. The maximum displacement also occurs in Mode 6. The maximum frequency at which the whirling happens is around 3.1718Hz. It is also noted that the participation factor has a positive value for mode 1 and mode 6. It is because mode 1 is unstable and mode 6 has high rpm when compared to other mode of oscillation. Participation factor is a scalar quantity and it determines the degree of a system parameters which focus on the information of oscillation for a linear system. In the experimental results, figure 13 shows the plot which represents the various modes and critical speed. It shows that the multimode oscillation is a linear system.
Table 2. Stability of the system
|
Mode |
Whirl Direction |
Mode stability |
|
1. |
undetermined |
unstable |
|
2 |
undetermined |
stable |
|
3 |
backward |
stable |
|
4 |
forward |
stable |
|
5 |
backward |
stable |
|
6 |
forward |
stable |
Table 3. Frequency analysis of modes
|
Mode |
Critical speed (rad/s) |
Frequency at Minimum displacement |
Frequency at Maximum displacement |
|
1. |
-0.002147 |
-0.002147 |
-0.002147 |
|
2 |
0.0266 |
0.0042335 |
0.0042335 |
|
3 |
4.174 |
0.66475 |
0.64552 |
|
4 |
4.1795 |
0.66476 |
0.68382 |
|
5 |
19.055 |
3.0449 |
2.9262 |
|
6 |
19.213 |
3.0449 |
3.1718 |
Table 4. Participation factor at minimum displacement
|
Mode |
Frequency at Minimum displacement |
Participation factor |
|
1. |
-0.002147 |
6.9548 |
|
2 |
0.0042335 |
-11.566 |
|
3 |
0.66475 |
-0.24010E-4 |
|
4 |
0.66476 |
-0.18619E-4 |
|
5 |
3.0449 |
-0.92885E-6 |
|
6 |
3.0449 |
0.22325E-5 |
|
Mode |
Frequency at Maximum displacement |
Participation factor |
|
1. |
-0.002147 |
6.9548 |
|
2 |
0.0042335 |
-11.566 |
|
3 |
0.64552 |
-0.18716E-4 |
|
4 |
0.68382 |
-0.12342E-4 |
|
5 |
2.9262 |
-0.30076E-6 |
|
6 |
3.1718 |
0.15953E-5 |
Figure 13. Plot representing various modes and critical speed
In the proposed work, the generator is loaded with resistive loads. In the meantime series compensators are connected to the system. It is observed that, the shaft vibration increases when the capacitors are connected to the system. This vibration is due to the resonance caused by the capacitors. The shaft line is modelled for its point mass, stiffness coefficient derived from the experimental results. Modal analysis is carried out and multimode oscillations are found out using ANSYS. Finite element method is used to build the mathematical model. Mode 1 becomes unstable which is denoted in the Campbell diagram. From this work, it is clear that finite element can give various modes of oscillation and the deformation of the shaft. It is necessary to use this analysis for any turbine generator shaft line in the design phase. This analysis can increase the stability and reliability of the model.
The authors are grateful to Christ (Deemed to be) University – Department of EEE, Faculty of engineering for providing the laboratory facilities and Department of EEE, Ghousia College of engineering Ramanagaram (Affiliated to Visvesvaraya Technological University), Karnataka India.
Assenkamp A., Hoffmann R., Kreische C., Exnowski S. (2017). Simulative analyses of dynamical behavior of steam-powered turbo generators during power system incidents with a higher rate of change of frequency. IET International Conference on Resilience of Transmission and Distribution Networks, Birmingham, pp. 1-6. https://doi.org/10.1049/cp.2017.0343
Childs D., Scharrer J. (1988). Theory versus experiment for the rotor dynamic coefficients of labyrinth gas seals: Part II – a comparison to experiment. ASME J Vibration Acoustic Stress Reliability, Vol. 10, pp. 281–287. https://doi.org/10.1115/1.326951
Fischer D. T., Angquist L., Nee H. (2010). Frequency-domain modeling of sub-synchronous torsional interaction of synchronous machines and a high voltage direct current transmission link with line-commutated converters. lET Generation Transmission and Distribution, Vol. 4, No. 3, pp. 418-431. https://doi.org/10.1049/iet-gtd.2009.0129
IEEE Sub synchronous resonance working group (1985). Terms, definitions and symbols for sub synchronous resonance oscillations. IEEE Transactions on Power Apparatus and Systems, Vol. PAS-104, No. 6, pp. 1326-1334. https://doi.org/10.1109/TPAS.1985.319152
IEEE Sub synchronous resonance working group. (1985). Second benchmark model for computer simulation of sub synchronous resonance. IEEE Transactions on Power Apparatus and Systems, Vol. PAS-104, No. 5, pp. 1057-1066. https://doi.org/10.1109/TPAS.1985.323456
IEEE Sub synchronous resonance working group. (1992). Readers guide to sub synchronous resonance oscillations. IEEE Transactions on Power Apparatus and Systems, No. 7, pp. 150-157. https://doi.org/10.1109/59.141698
Limebeer J. N., Harley R. G. (1981). Sub synchronous resonance of single-cage induction motors. IEE Proceedings, Vol. 128, No. 1, pp. 33-41. https://doi.org/10.1049/iet-gtd.2010.0618
Mohammadpour H. A., Ghaderi A., Santi E. (2014). Analysis of SSR in DFIG-based wind farms interfaced with gate - controlled series capacitor. IET Generation Transmission & Distribution. https://doi.org/10.1109/APEC.2014.6803749
Mohammadpour H., Santi E. (2015). Optimal adaptive sub-synchronous resonance damping controller for a series-compensated doubly-fed induction generator-based wind farm. IET Renewable Power Generation, Vol. 9, No. 6, pp. 669-681. https://doi.org/10.1049/iet-rpg.2014.0155
Padiyar K. R. (2002). Power system dynamics: Stability and control. BS Publications,
Someya T. (1989). Journal bearing design data book. Berlin: Springer-Verlag.
Wang L., Peng J., You Y., Ma H. W. (2017). SSCI performance of DFIG with direct controller. IET Generation. Transmission, Distribution, Vol. 11, No. 10, pp. 2697–2702. https://doi.org/10.1049/iet-gtd.2016.2022