Sola O. Ayantola*![]() | John O. Amigun
| John O. Amigun![]()
© 2023 IIETA. This article is published by IIETA and is licensed under the CC BY 4.0 license (http://creativecommons.org/licenses/by/4.0/).
OPEN ACCESS
The integrated very low frequency of electromagnetic (VLF-EM) and vertical electrical sounding technique (VES) of electrical method were carried out to explore for groundwater resource in a very complex terrain within Akure metropolis. The VLF data was acquired at 10m interval along five traverses (TR 1 to 5). The conductive zones mapped on EM profiles and 2-D pseudo-section suspected to be fracture or localized features were further probed using a VES technique. A total number of 12 VES points were acquired to ascertain the fractured or contact zones. Relatively high conductivity is observed around the portion marked as F1, F2 and F3. VES conducted on these conductive zones acknowledged the suspected fractured or geologic contacts zone observed on the EM profiles. VES 1, 7 and 11 acquired on the conductive zones delineates both weathered and fractured layers with the resistivity values ranging from 80 to 490Ωm and 228 to 935Ωm respectively. These layers are considered to favour groundwater accumulation. VES acquired on the high resistive zones of EM profiles also showed high resistivity which may be not be prolific for groundwater development. The outcomes of this research may serve as a guide for sustainable water supply and water management plan.
electromagnetic method, fracture, geologic contact, vertical electrical sounding, low frequency, aquifer, water
Water is one of the most essential resources throughout the world, without which man cannot survive for more than a week [1]. Water is important for the existence of a man nonetheless, its use for domestic and industrial purposes cannot be overemphasized [2]. According to the UNICEF article released in November, 2020, it was reported that the average amount of water required by a person daily is 9 litres while the minimum admissible range by National standards is between 12 and 16 litres per day [3]. Undesirably, a large number of people in some communities have to walk long distances to fetch water from lakes, streams and rivers most especially during the dry season. A report of survey, released by Nigeria’s Federal Ministry of Water Resources and UNICEF in 2019 revealed that about 33.3% of Nigerian population drink contaminated water and about 46 million still continue practicing open defecation thereby contaminating the surface water such as stream and lake [3]. Vulnerability of natural sources of water such as lake, ocean and river, to pollutants and contaminants has made them not suitable for human consumption. As inaccessibility to safe and clean water continue to pose a serious danger to those living in a very complex terrain, groundwater provides a better clean water due to its natural microbiological and chemical qualities [4]. Groundwater is the water found beneath the ground surface most especially within the pore spaces or voids in the rock. The appreciably porous zone in the subsurface provides a better accommodation for groundwater. This zone is not usually easy to find in the basement environment due to the geologic settings and heterogeneous nature of crystalline rock. In some environment, rocks that are extremely weathered or fractured would have to be delineated before groundwater could be successfully exploited. In order to delineate those weathered or fractured zone believed to be porous, a detailed geophysical investigation has to be carried out to understand the hydrogeologic settings of such complex basement terrain before citing a well or borehole. This deals with deployment of geophysical methods to determine structures, thickness, properties of subsurface layers etc. Acquisition of geophysical data help to effectively identify an aquifer and characterise them into hydro-geologically potential zones which is significant in the groundwater exploitation and decision making in groundwater development [5]. Very low frequency of electromagnetic (VLF-EM) and electrical resistivity (ER) methods are efficient tools for groundwater investigations [5]. Some authors have described VLF-EM as a reconnaissance tool for mapping fractures in the crystalline basement environment [5-8]. They succeeded in delineating some water bearing fractures and recommended those points for drilling. However, they are some deep seated fractures in a basement complex environment or an environment with conductive thick overburden that VLF-EM may not capture due to its shallow depth of investigation. It is necessary to integrate the EM method with other geophysical methods particularly ER method, to increase the success rate of exploration [8]. ER method has been adjudged efficient and has been effectively applied to environmental and hydrogeological related problems [9]. Braga et al. [10] 2006 applied ER method to solve aquifer vulnerability. They were able to delineate two types of aquifers namely confined and unconfined but we found out that they did not have challenge with groundwater resource rather the unprotected capacity of the aquifer. Srinivas et al. [11] applied ER to solve saline water intrusion. They were able to delineate fresh and saline layers by estimating conductance anomalies in the subsurface without minding how prolific the strata they delineated is.
Several researchers have integrated ER method with other geophysical methods in a typical basement terrain for groundwater investigations but result of the methods has not really emphasized the variation of prolific and non-prolific zone [5], [12-15].
However, electromagnetic and electrical resistivity of geophysical methods are integrated in this research with the aim of delineating prolific zone that is fractured or weathered, depressed portion of basement and deep weathered zones to solve water scarcity in the complex environment.
1.1 Site description
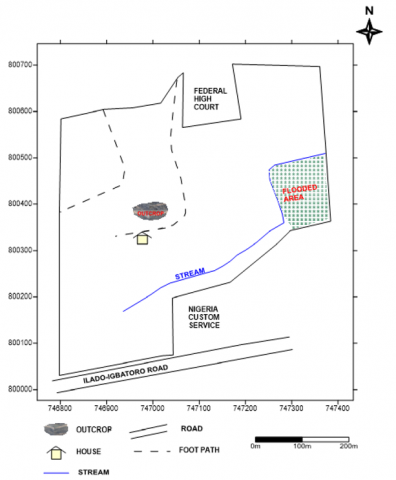
The area at which this study was carried out is located close to Federal High Court Akure, South-western part of Nigeria. The area is bounded by northing coordinate 800020N and 800700N and easting coordinate 746800N and 747400E in Universal Traverse Mercator (UTM). The study area is easily accessible through Akure-Igbatoro road (Figure 1).
Figure 1. Description map of the study area
1.2 Geology of the area
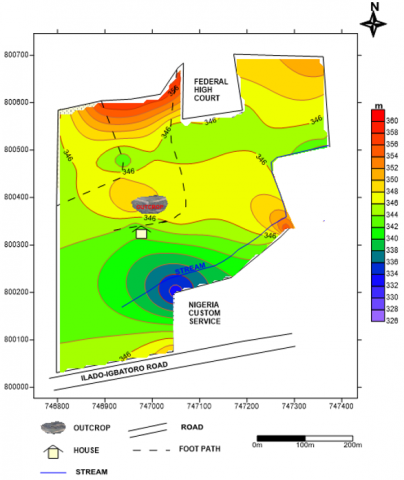
The topography of the study area is characterised by high land and low land. The Northern part of the area is relatively elevated compared to the central and small part of south eastern side (Figure 2). The area falls under the geologic setting of migmatite gneiss and granite of complex rocks of the Precambrian Basement Complex of southwestern Nigeria [16]. Migmatite gneiss outcrop at the central part suggested that the underlying granitic rock in the study area might have been metamorphosed (Figure 3). The relief seems to have been influenced by the underlying geology and tectonic activities in the past.
The area is classified into the tropical Savannah climate. The rainy season starts from late March to early October with the annual rainfall of about 1500 mm per annum while the dry season probably starts from November to March.
Figure 2. Topographical map of the area
Figure 3. A Geological map of Akure showing the study area (Modified after [7])
The materials used are ABEM WADI, Omega terrameter, Global positioning system (GPS), tape rules, connecting cables, four electrodes, hammer, cutlass, four reels of cable wires, clips and data sheet. This research utilised the integration of electromagnetic and electrical resistivity methods of geophysics.
2.1 Very low frequency of electromagnetic method
The very low frequency method (VLF-EM) is a powerful tool for studying shallow conducting lineament features in the near surface earth [17]. Electromagnetic radiation generated in the low frequency band of 15–25 kHz was utilised because waves at low frequencies propagate effectively over long distances within the ground surface and ionosphere [18, 19]. We used ABEM WAD equipment to acquire the raw real and filter real data. The data were taken along five traverses at station intervals of 10m. The five traverses were oriented in a direction perpendicular to the geologic strike (Figure 4). KHFFILT version 1.0 software [20] was used to process the raw and filter real data. The Q-factor readings computed through an equation [(Q4+Q3)-(Q2+Q1)] were plotted with the raw real values against the distance.
2.2 Electrical resistivity survey
A total number of 12 VES were carried out at selected locations based on the results obtained from the VLF surveys (Figure 4). We used Omega terrameter equipment to acquire the apparent resistivity data through the multiplication of displayed ground resistance (R) by its corresponding geometric factor. The maximum current electrode spacing (AB/2) reached was 100m. The apparent resistivity values got from the field were plotted against the current electrode spacing on a bi-log graph. The plotted points on the graph were then matched segment by segment with the theoretical curves through the aid of curve matching. True resistivity and thickness of each geo-electrical layers were estimated from the graph using a general calculation of layer resistivity ( $\rho_{\mathrm{n}}$ ) and thickness ( hn ) [21]. These two parameters were used as starting models for the computer iteration of WinResist Version 1.0 [22]. The results were presented as profiles and sections. The data were qualitatively and quantitatively analysed and interpreted to determine the groundwater potential.
Figure 4. A Map of data acquisition of the study area
3.1 VLF-EM results
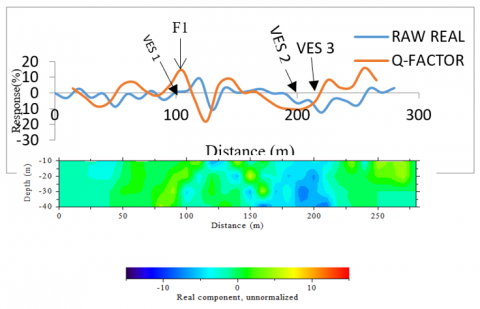
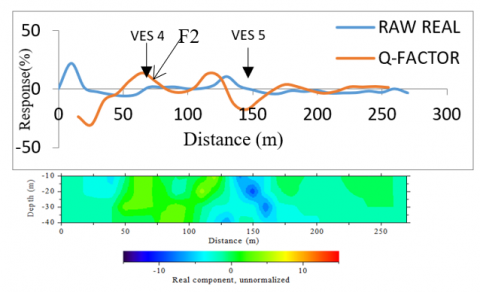
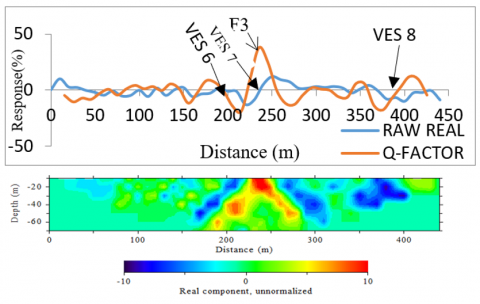
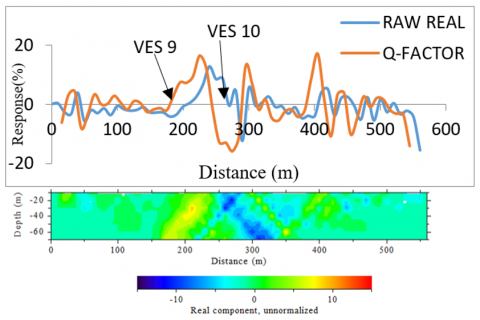
The raw and filtered real plotted against distance are presented as profiles show the variation or distribution of conductivity within the study area (Figures 5a-e). The pseudo sections corresponding to the profiles are equally attached. Generally, it was observed that the VLF-EM profiles show some conductive zones, most especially where the peak positive of the Fraser filter coincides with the inflexion point of the raw real (cross over point of the raw real) across the traverses. The zone seen to be conductive may be as a result of some geologic features such as fractures, faults, geologic contacts or weathered basement filled with fluid or conductive mineralized rock. Figures 5a, b, c and d show several cross over points mapped as fractures (e.g., Figure 1 on Traverse 1, Figure 2 on Traverse 2 and Figure 3 on Traverse 3 at distances 105m, 70m and 235m respectively). These points are zones suspected to be prolific for groundwater development in a basement terrain. The corresponding section which is a measure of conductivity also depicts the zones seen to be conductive.
Suspected zones delineated on the profiles labelled Figures 1-3 also show similar occurrence of higher conductivity on the pseudo-section. These points are suspected to favour groundwater exploitation. Figure 5a shows a highly resistive structure on the section between distance of 175 and 205m. The resistive body suspected to be a dyke structure or an intrusion is known to impede the flow of groundwater.
Figure 5c shows the conductive bodies at distance of 240m lies between the enclosing resistive structures around the distance of 195-285m. The linear conductive structure is typical of a fractured or contact zone in the basement region while the other resistive structure on the traverse 3 between 350-395m is typical of a shallow bed rock. A structure typical of dyke is also observed on the traverse 4 between the distance of 245 and 295m (Figure 5d).
Figure 5. (a) VLF-EM profile and its corresponding KH-filter Pseudosection along Traverse 1
Figure 5. (b) VLF-EM profile and its corresponding KH-filter Pseudosection along Traverse 2
Figure 5. (c) VLF-EM profile and its corresponding KH-filter Pseudosection along Traverse 3
Figure 5. (d) VLF-EM profile and its corresponding KH-filter Pseudosection along Traverse 4
Figure 5. (e) VLF-EM profile and its corresponding KH-filter Pseudosection along Traverse 5
3.2 Vertical electrical sounding (VES) results
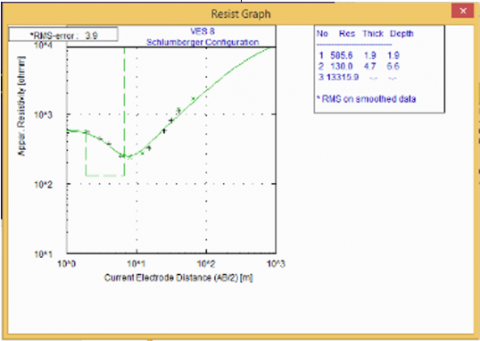
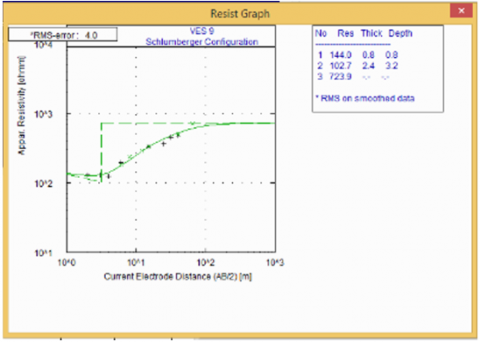
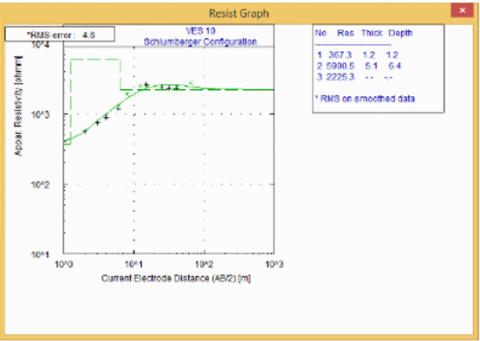
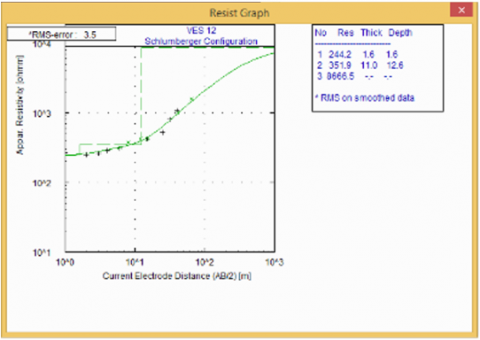
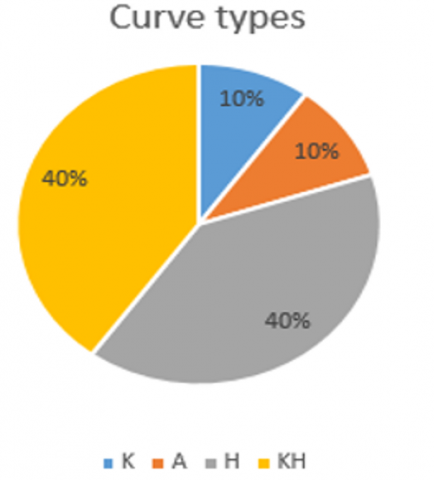
The profiles of the 12 VES are shown in Figure 6. The 12 sounding curves obtained from the study area were classified into four curve types namely H, A, K and KH, with H and KH having higher distributions (Figure 7).
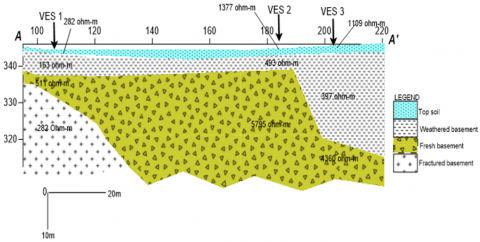
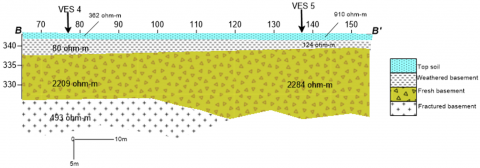
Generally, the five geo-electric sections were drawn along East-West direction with the similar trend of traverse direction. The VES delineates five subsurface layers which are top soil, partly weathered basement, weathered basement, fractured and fresh basements. Relatively high variation of the resistivity data at some VES positions depicts the complexity of the basement terrain in the study area.
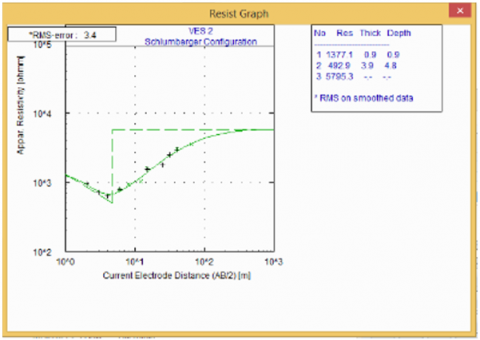
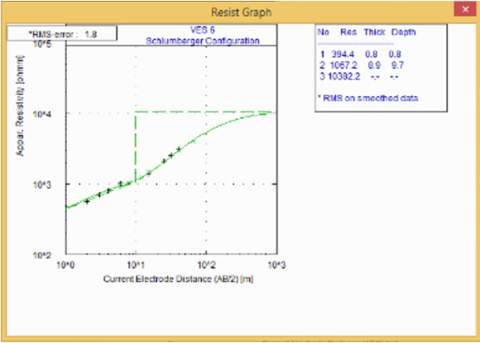
The resistivity of the top soil ranges between 67 and 1377Ωm with thickness between 0.6 and 1.9m. This suggests the composition of clayey sand, sand and lateritic hardpan. Weathered layer resistivity ranging from 80 and 490Ωm suggests a lithological unit composed of sand and clayey sand. The thickness of weathered layer ranges from 1.7 to 33.5m. The resistivity of partly weathered basement and fractured basement ranges from 407 to 493Ωm and 228 to 935Ωm respectively. The resistivity of fresh basement ranges between 511 and 13,316 Ωm. At traverse 1, a marked suspected fractured zone (F1) on the EM profile exhibits similar nature on the VES 1 curve with an evidence of fracturing at layer four of geo-electric section A-A’ (Figure 8). The resistivity of the fractured layer is 228Ωm which still favour groundwater exploitation (Figure 8). VES 2 position seen to be resistive on the EM profile shows a shallow overburden of about 4.8m with fresh basement of resistivity value of 5795Ωm. VES 3 positioned beside the delineated resistive zone seems to have the same curve type but with thick weathered zone. VES 3 position is believed to be a contact zone filled with materials suggested to have been weathered. Therefore a contact zone is a prolific region of groundwater accumulation to explore while undertaking geophysical survey for groundwater resource. VES 4 on traverse 2 also delineates a fractured basement mapped out on the EM profile.
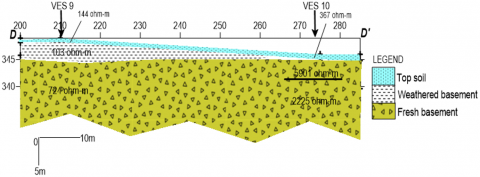
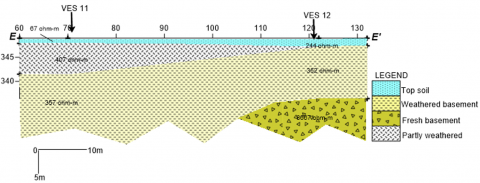
The VES 7 positioned on the suspected fractured zone (Figure 3) on traverse 3, delineates both the weathered and fractured zones with resistivity values of 297 and 935Ωm respectively (Figure 8). The VES 8 positioned on the resistive zone on the EM profile delineated shallow overburden without fractured zone (Figure 8; section C-C’). VES 11 positioned on the nearly inflection point of EM profile also delineates the fractured zone at section E-E’ (Figure 8). Results of VES 10 and VES 12 confirm the resistive zones mapped on the EM profiles.
a
b
c
d
e
f
g
h
i
j
k
l
Figure 6. Profiles of VES 1 - VES12
Figure 7. Pie chart of VES type curve distribution
The integrated geophysical methods used in this study have significantly assisted in locating prolific positions for groundwater development. The EM method was able to detect some suspected fractured or contact zones most especially at Figure 1, Figure 2 and Figure 3 positions. The VES technique of electrical method employed to probe the suspected zones on the EM.
Profiles further confirmed the VES 1, 4, 7 and 11 to be better prolific positions that can be drilled for groundwater abstraction. Interpretation of the EM has shown that the non-conductive zone might not be prolific for groundwater. The quantitative interpretation of the VES also revealed the hydro-geologic nature of the subsurface within the study area. The weathered and fractured zone are seen to be prolific for groundwater exploitation. The prolific positions delineated by VES 1,4,7 and 11 are recommended for drilling and logging in order to further characterise their aquifer.
a
b
c
d
e
Figure 8. Geo-electric Section along A-A’, B-B’, C-C’, D-D’ and E-E’ direction
[1] Aulenbach, D.B. (1968). Water-our second most important natural resource. 9Boston College Law Review, 9(3). http://lawdigitalcommons.bc.edu/bclr/vol9/iss3/2, accessed on Jan, 17, 2023.
[2] Okhuebor, S.O., Izevbuwa, O.E. (2020). The quality and effect of borehole water proliferation in Benin city, Nigeria and its public health significance. Microbiology Research, 4(1): 1-5. http://dx.doi.org/10.24966/AMR-694X/100013
[3] Eliana, D. (2020). New Survey reveals progress and gaps in Nigerian’s access to water, sanitation and hygiene services. UNICEF Nigeria Press Release.
[4] Okpoli, C.C. (2017). Hydrogeochemistry of water resources of Oka municipality. Environmental Science, 2(1): 46–58. https://doi.org/10.22606/GR.2017.21006
[5] Adiat, K.A.N., Olayanju, G.M. Omosuyi, G.O., Ako, B.D. (2009). Electromagnetic profiling and electrical resistivity soundings in groundwater investigation of a typical basement complex – a case study of ODA town southwestern Nigeria. Ozean Journal of Social Sciences. 2(4): 333-359. https://www.researchgate.net/publication/281372961, accessed on Dec. 10, 2022.
[6] Olorunfemi, M.O., Dan-Hassan, M.A. and Ojo J.S. (1995). On the scope and limitations of the electromagnetic method in groundwater prospecting in a Precambrian basement terrain - a Nigerian case study. Elsevier Journal of African Earth Sciences, 20(2): 151-160. https://doi.org/10.1016/0899-5362(95)00033-P
[7] Olorunfemi, M.O, Ojo, J.S, Akintunde, O.M (1999). Hydro geophysical evaluation of the groundwater potential of Akure metropolis, southwestern Nigeria. Journal of Mining and Geology, 35(2): 207-228. https://www.researchgate.net/publication/291757724, accessed on Nov. 12, 2022.
[8] Sundararajan, N., Nandakumar, G. Raman K., Narsimha, C., Yasa, K.S. (2007). VES and VLF – An application to groundwater exploration. Khammam, India. The Leading Edge, 26(6). https://doi.org/10.1190/1.2748489
[9] Ayuk, M.A., Adelusi, A.O. and Adiat, K.A.N. (2013). Evaluation of groundwater and aquifer protective capacity assessment at Tutugbua-Olugboyega area, off Ondo Road, Akure Southwestern Nigeria. International Journal of Physical Science, 8(1): 37-50. https://doi.org/10.5897/IJPS 09.299
[10] Braga, A.G.O., Filho, W.M. and Dourado J.C. (2006). Resistivity DC method applied to aquifer protection studies. Revista Brasileira de Geotisica, 24(4): 573-581. http://dx.doi.org/10.1590/S0102-261X2006000400010
[11] Srinivas, Y., Oliver D.H., Raj, A.S., Muthuraj D. and Chandrasekar N. (2012). Estimation of conductance anomalies in subsurface through Dar-Zarrouk parameters by resistivity inversion method. International Journal of Physical and Mathematical Sciences, 3(1): 140-151. http://www.researchgate.net/publication/230729321, accessed on Dec. 21, 2022.
[12] Adelusi, A.O, Adiat, K.A.N and Amigun, J.O. (2009). Integration of surface electrical prospecting methods for fracture detection in precambrian basement rocks of Iwaraja area, southwestern Nigeria. Ozean Journal of Applied Sciences, 2(3): 265-280. https://www.scinapse.io/papers/2188695300, accessed on Jan. 1, 2023.
[13] Gupta, G., Patil, S.N., Padmane, S.T., Erram, V.C. and Mahajan, S.H. (2015). Geoloectric investigation to delineate groundwater potential and recharge zones in Soku river basin, North Maharashtra. Journal of Earth System Science, 124(7): 1487-1501. https://www.ias.ac.in/article/fulltext/jess/124/07/1487-1501, accessed on Jan. 12, 2023.
[14] Lenkey, L., Hamori, Z. and Mihalffy, P. (2005). Investigating the hydrogeology of a water supply area using direct-current vertical electrical soundings. Geophysics, 70(4): H1–H19. http://dx.doi.org/10.1190/1.2000288
[15] Okpoli, C.C. and Tijani, R. (2016). Electromagnetic profiling of Owena Dam, Southwestern Nigeria, using very-low-frequency radio fields. RMZ – M&G, 63: 237-250. https://doi.org/10.1515/rmzmag-2016-0021
[16] Rahaman, M.A. (1976). Review of the Basement Geology of Southwestern Nigeria, In Geology of Nigeria (Kogbe, C.A. Ed). Elizabeth and Publishing Company, Nigeria, pp. 41-58.
[17] Telford, W.M., King, W.F. and Becker, A. (1977). VLF mapping geological structure. Geological Survey of Canada, 76(25): 1-1. https://emrlibrary.gov.yk.ca/gsc/papers/76-25.pdf, accessed on Jan. 1, 2023.
[18] Keary, P., Brooks, M., Hill, I. (2002). An Introduction to Geophysical Exploration. Third edition, Oxford, Blackwell Scientific Publication, pp. 183-199, 208-221.
[19] Milsom, J. (2003). Field Geophysics. 3rd Edition. John Wiley and Sons, pp. 249.
[20] Pirttijarvi, M. (2004). Manual of the KHFFILT program; Karous-Hjelt and Fraser filtering of VLF measurements, Version 1.1a. University of Oulu, Finland, pp. 1-6. Uploaded file.
[21] Omosuyi, G.O., Ojo, J.S. and Enikanselu, P.A. (2003). Geophysical investigation for groundwater around Obanla-Obakekere in Akure area within the basement complex of SW Nigeria. Journal of Mining and Geology, 39(2): 109-116.
[22] Orellana, E., Mooney, H. M. (1972). Two and three-layer master curves and auxiliary point diagrams for vertical electrical soundings using Wenner arrangement. Madrid (Spain): Interciencia 43 sheets.