Sahar Mahar Al-Alossy* | Ayad Mustafa | Jumaa Al-Somaydaii
© 2022 IIETA. This article is published by IIETA and is licensed under the CC BY 4.0 license (http://creativecommons.org/licenses/by/4.0/).
OPEN ACCESS
This study aims to assess the quality of storm sewer water in Ramadi city before its discharge into the Euphrates River and Al-Warrar Canal. Several samples were taken from the storm sewer in two different periods October and April months. Samples were tested in laboratories which included (PH), electrical conductivity (EC), alkalinity (Alk), total hardness (T.H), calcium (Ca), biological oxygen requirements (BOD5), chemical oxygen requirements (COD), nitrate (NO3). sulfate (SO4) dissolved solids (TDS), suspended solids (TSS), and some heavy metals such as copper (Cu) and zinc (Zn). In this study, the authors suggested a new approach for calibrating WQI values using the multiple linear regression (MLR) model and coefficients analysis The results showed that the (MLR) model is acceptable, the multiple linear regression analysis (MLP) was applicable to calibrate WQI values, and new WQI equation with four variables was developed (SO4, BOD5, TSS and TDS), The results showed that the MLR model has a coefficient of R2 equal to (0.859), which indicates that 85.9% of the variance of the data was explained as well as obtaining significance values greater than 0.05 for each of the absolute WQI value. According to analysis, SO4 is the parameter that has the greatest effect on WQI.
WQI, sewer, water quality, multiple linear regression, SO4, TSS
The quality of storm water is being negatively impacted by urbanization as well as an increase in the frequency and severity of floods [1]. Storm water is being progressively contaminated by a wide range of biological and chemical contaminants that are the direct consequence of human activities in urban areas. Storm water runoff that has been polluted is one of the primary contributors to the transfer of contaminants into the water [2].
In urbanized settings, the storm water drainage system is critical. This system gathers rainfall and transports surface runoff over a long distance before discharging it to the water receiver [3]. A considerable quantity of pollutants settles in storm streams, forming sediments that induce the re-release of different sediment pollutants after being discharged into receiving waters, increasing the release of pollutants to receiving water bodies [4].
In order to maintain the system's right functioning and analyze pollution in stormwater sewer systems and whether it constitutes a risk to the environment or human health, the sediment must be collected on a regular basis and handled and correctly or disposed of the study [5]. The suspended particles present in the runoff are the most important in terms of quantitative and qualitative assessment of the sediment [6].
The long-term persistence of surface water runoff and unmanaged or improperly controlled discharges is one of the main causes of low-quality water. Drainage control has therefore become more crucial in recent years when it comes to sanitation issues. Additionally, big investments have been made to address these issues [7].
Because there are so many obstacles to overcome when trying to solve these problems, the creation and application of water quality models has become increasingly important. During the course of the last several years, a number of these models have been developed in order to simplify the management of water pollution control.
Powerful mathematical methods can be used to anticipate performance and improve operating control based on previous notes for certain important parameters. This can be done by looking at the relationship between those two factors. On the other hand, modeling water quality is challenging.
It is difficult to accurately characterize nonlinear behaviors using linear mathematical models [8] due to the complexity of the physical, chemical, and biological processes that take place in treated wastewater. The development of quality control programs for the quality of treated wastewater has the dual purpose of assisting planners and protecting freshwater resources already in existence. The quality of treated wastewater is the focus of the quality control programs. In most cases, determining the quality of water involves making a comparison of the current values to the standards that have been averaged over a certain amount of time. This allows for the extraction of important information about the quality of the water based on the spatial and temporal.
There have been a great number of investigations carried out all around the world to investigate the levels of pollution found in sewers water. The effectiveness of multivariate linear regression (MLR) and artificial neural network (ANN) models is examined in this study to forecast two crucial water quality metrics in a wastewater treatment facility. The indirect markers of organic content and the biochemical and chemical oxygen demands (BOD and COD) are indicative of the quality of wastewater [9].
Researcher's study intends to examine the possibility for using sewage water for irrigation and investigate the overall performance of Rustumiya Station in Baghdad, Iraq. Additionally, assess the environmental quality (EQI) of the wastewater at the water treatment facility to understand the impacts of wastewater at the Rustumiya STP on the Diyala River, and then create prediction models using the EQI ANN Model and Multiple Linear Regression (MLR) Model [10].
It aims to create a new water quality index (WQI) equation for Mirim Lagoon using multiple linear regression analysis models. It also assesses the suitability of these models for monitoring the water quality of this resource and whether the WQI values produced by the new equation can be used to accurately monitor the quality of the lagoon's waters [11]. The researcher's aims included establishing a connection between the origin of a pollutant and the nature of the pollutant, as well as determining how the distribution of heavy metals changed throughout transportation between dissolved and particulate forms of the pollutant [12]. The contamination of the Euphrates River was the primary focus of the researches conducted in Iraq. research studied temporal and geographical variations in Euphrates River Water Quality Index in Anbar Governorate [13]. A search for TDS concentrations during three years (2011, 2012, and 2013) and 3-year average values along the Euphrates River in Iraq [14]. Using satellite photos, the purpose of the research was to make a prediction about the regional distribution of water quality metrics in the Euphrates [15]. This research focused on the water quality standards of the Euphrates River in Iraq, namely in the towns of Hit and Ramadi, as well as the influence flow has on water quality [16].
The objective of this study is to assess the current status of the water quality of storm sewer system before it flows to the last estuary in the Euphrates River and Al-Warrar Canal in the Ramadi city. Water samples were taken from the rain collection holes (manholes), the main collection basin in the station, and the outlet hole before it flows into the river. This study was included, laboratory analyzed of, water quality parameters, and calibrate the WQI with a multiple linear regression model. This work intends to construct a novel WQI equation using multiple linear regression models and evaluate their feasibility for water quality monitoring of this water resource, as well as whether the resulting WQI results can be utilized accurately to monitor storm sewer quality.
The remainder of this article is structured as follows: Section 2 provides a description of the study area, and the third section describes the sampling sites, the method of collecting and analyzing samples, as well as describing the statistical analyzes and the method of knowing water quality index, and the fourth section describes the results of the analyzes and the most important elements causing water pollution the storm sewer , and describes the composition A new equation for the standardization of water quality, the fifth section describes the summary of the research and the most important recommendations reached by the researchers.
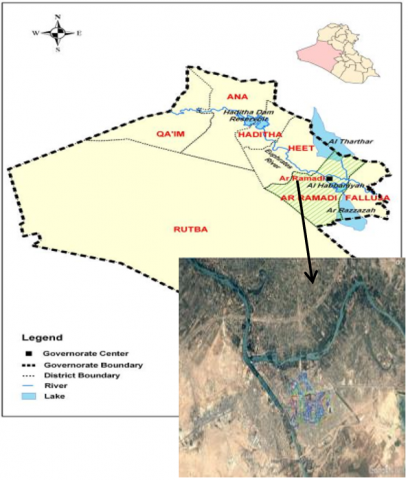
Ramadi city is the governorate of Al Anbar's capital around about 110 kilometers northwest of Baghdad (Latitude:33°25'11'' N, Longitude: 43°18'45'' E). The study area represents the center of the city of Ramadi, which is bordered on the east by the Al-Warrar Canal and on the north by the Euphrates River (Figure 1). Recently constructed sewers cover about 13 square kilometers of heavily populated downtown Ramadi (about 114,000 people), flowing by gravity with a its diameters Ranging between of (315 mm - 900 mm). The city's sewage network is very young, and it is divided into two types: sewage and storm sewer system. Storm sewers feed into the Euphrates River or the Warrar Canal.
Figure 1. Map of Al- Anbar Governorate (case study)
3.1 Sampling locations
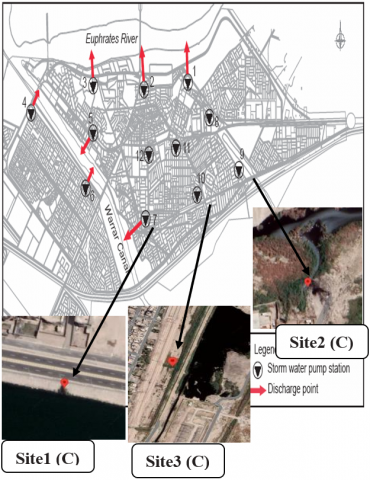
Water samples were collected from three districts in downtown Ramadi city (Al-Moallemen District, Al-Malaab District, and Al-Shurta District). Samples were collected in each of the three sites: the first site is the rainwater collection hole (manholes), the second site is the station's main collection basin, and the third site is the storm sewer outlet opening before the water is discharged into the Euphrates River or the Warrar Canal. Figure 2 shows the sampling locations in each region. The samples were taken in two parts, the first time the samples were collected in the dry season before the rainy season, and the second time the samples were collected after the rainy season, but this year's rains were irregular and rare. During the past two years, Iraq has suffered from a lack of rain and its scarcity and climate change, in contrast to previous years, when drought increased and the rainfall rate decreased to less than 50% of its normal rates.
Table 1 shows the coordinate locations of the samples, where it denotes the sample taken from manholes (A), the sample taken from the main collection basin of stations (B), and the sample taken from an exit before it poured into the river (C).
Figure 2. Sampling sites in Ramadi city center
Table 1. The location coordinates of the regions from where the samples were obtained
|
Region |
Sample |
Coordinate location |
|
Al-moallemen (Site 1) |
A |
33.415245, 43.298394 |
|
B |
33.415176, 43.298632 |
|
|
C |
33.413022, 43.293408 |
|
|
Al-Malaab (Site 2) |
A |
33.423111, 43.330790 |
|
B |
33.423407, 43.331024 |
|
|
C |
33.423714, 43.331607 |
|
|
Al-shurta (Site 3) |
A |
33.417585, 43.320272 |
|
B |
33.417350, 43.319943 |
|
|
C |
33.409916, 43.316301 |
3.2 Sampling collection
Water samples were collected in October and April. Samples were stored in sterile, hermetically closed glass plastic containers. The analyzes were carried out in the laboratories of the University of Anbar, the College of Science, and the laboratories of the Great Ramadi Water Project Department.
3.3 Analytical and statistical analysis
In this study, some physical and chemical properties of the water quality in storm drains were examined. They include (PH), electrical conductivity (E.C), alkalinity (Alk), total hardness (T.H), calcium (Ca), biological oxygen requirement (BOD5), chemical oxygen requirement (COD), nitrate (NO3), sulfate (SO4), dissolved solids (TDS), suspended solids (TSS), and some heavy metals such as copper (Cu) and zinc (zn). Electrical conductivity and pH were measured immediately after sampling, total hardness (T.H), alkalinity (Alk) and chloride were measured by titration, Cu concentrations were determined by atomic absorption method (AAS). The Canadian CCME WQI model is characterized by its widespread and global use by researchers to assess water resources and determine the degree of their pollution [17]. This model does not care about the weight of characteristics. Parameters in which even one test deviation from the standard limits, but rather exceeds it to the weight of each measurement (test value) deviating from the standard limits, which gives high accuracy in evaluating the quality of the studied water [18].
The Canadian model (CCME WQI) was used in this study using the following equations and to find the values of the index by calculating three factors as follows:
(1) F1 (Scope) represents the percentage of variables that exceed the standard limits compared to the total number of variables (even once during the study period).
$\mathrm{F} 1=\frac{\text { number of failed variables }}{\text { total number of variables }} \times 100$ (1)
(2) F2 Frequency: the percentage of individual examinations exceeding the limits of the standard over the total number of examinations
$\mathrm{F} 2=\frac{\text { number of failed tests }}{\text { total number of tests }} \times 100$ (2)
(3) F3 (Amplitude) represents the amount of tests passed and is calculated in two stages.
The first stage: the number of times the individual concentrations exceed the standard limits, and it is called the (Excursion), and it is calculated as follows
Excursion $\mathrm{i}=\left(\frac{\text { failed test value } \mathrm{i}}{\text { objective } \mathrm{j}}\right)-1$ (3)
In the case that the exceeded test value is higher than the standard value, the calculation for it is done by inverting the ratio.
The second stage: the amount of the individual test set that is exceeded, and it is calculated by summing the individual deviations and dividing it by the total number of tests (overdone and non-override). This variable is called the (normalization of Excursion) and is symbolized by (nse).
$\mathrm{nse}=\frac{\sum_{i=1}^n \text { Excursioni }}{\text { numer of tests }}$ (4)
The Amplitude F3 is calculated from the following equation:
$\mathrm{F} 3=\frac{n s e}{0.01 n s e+0.01}$ (5)
After finding the three factors, the Canadian index is calculated from the following equation:
CCME WOI =$100-\left[\frac{\sqrt{F 1^2+F 2^2+F 3^2}}{1.732}\right]$ (6)
The constant 1.732 A, to adjust the result of the index value and make it confined between 100 - 0.0 [19].
Water quality is categorized into five categories as shown in the Table 2 [20].
Table 2. The Index for the quality of water Canadian council of ministers of the environment (CCME WQI)
|
CCME WQI values |
0-44 |
45-59 |
60-79 |
80-94 |
95-100 |
|
Rating |
Poor |
Marginal |
Fair |
Good |
Excellent |
|
Class |
1 |
2 |
3 |
4 |
5 |
3.3.1 Multiple linear regression (MLR)
The linear equation for multiple linear regression is [21].
$\mathrm{Y}=\alpha+\beta 1 \mathrm{X} 1+\beta 2 \mathrm{X} 2+\cdots+\mathrm{e}$ (7)
where, Y = dependent variable
α = Constant or Intercept
β1 = slope of the gradient y on the first independent variable
β2 = slope of the gradient y on the second independent variable
X1 = the first independent variable
X2 = the second independent variable
Once we have the outcomes of the multiple regression equation, the next step is to demonstrate that these coefficients are statistically acceptable, also known as statistically significant. It is important to note that the significance is determined on an individual basis for each parameter. The T-test and the probability level that corresponds to it are what we use to determine whether or not the regression coefficients have significant meaning. It should go without saying that the R and SPSS programs will automatically extract the T-test and the probability level that corresponds to it [9].
In addition to this, it will acquire statistics that are used for determining the overall relevance of the model, such as (R) (R2). The first R is known as the simple correlation coefficient, and it determines how strongly two or more variables are related to one another. The second R2 is known as the coefficient of determination, and it determines how well the estimated model explains the data (estimated equation) [11].
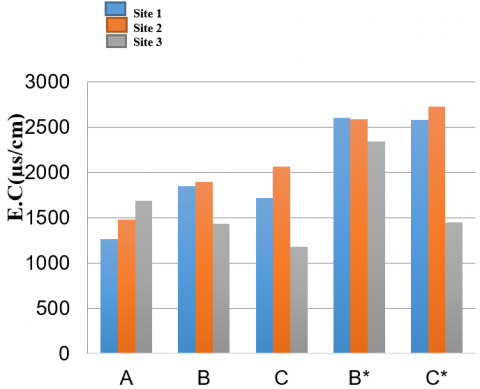
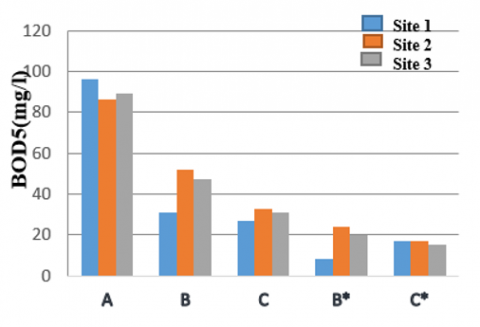
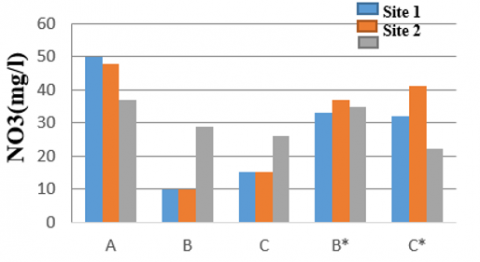
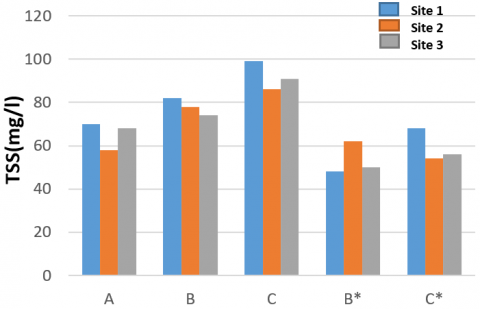
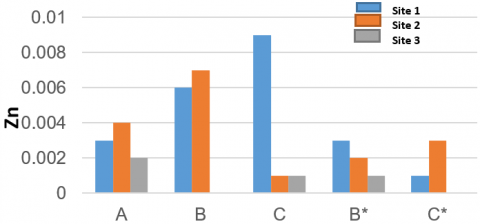
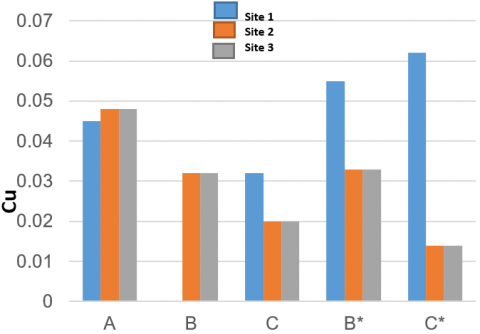
The results of analyzes conducted on samples taken from storm sewer water in the three sites are presented as shown in Table 3, these samples were examined in the month of October. Samples (B*) is the sample of the main catchment basin which was taken in the month of April and (C*) is the sample that was drawn from the storm sewage drainage opening before it dropped into the river that was taken in the month of April. Figure 3 shows pH levels between (7.3 - 7.8), which are within WHO standards (WHO). High salt concentrations and the dominance of chloride and sulfur over bicarbonate may be to cause for acidic water samples [22]. Figure 4 shows the electrical conductivity (E.C) values, and it is found that all values are over the limitations of the standards allowed by the (WHO), with values ranging between (1176 - 2725). Figure 5 shows alkalinity analysis, where it is found that site 1 sample A, C and site 2 samples in October exceeded the allowed limit (WHO). Site 3 is under the allowed level, as are the April exams at all three sites, not exceed 200. The values of the total hardness T.H analysis are shown in Figure 6, and they are generally high and exceed the WHO allowed limits, with the exception of site 3 at point C*, which is lower than the upper limit, suggesting it is within the permissible range. The results of the tests conducted to determine the vital oxygen requirement BOD5 are shown in Figure 7. The values are ranged from 8 to 96, higher than the permissible limit set by the (WHO), manholes (A) had the highest levels. Manhole water comes from the streets and carries high contaminants [23]. Sample C had decreased BOD5 due to pollutant and suspended matter deposition [24], but it still above the limit. under the allowed level, as are the April exams at all three sites, not exceed 200. The values of the total hardness T.H analysis are shown in Figure 6, and they are generally high and exceed the WHO allowed limits, with the exception of site 3 at point C*, which is lower than the upper limit, suggesting it is within the permissible range. The results of the tests conducted to determine the vital oxygen requirement BOD5 are shown in Figure 7. The values are ranged from 8 to 96, higher than the permissible limit. Figure 8 shows the COD test results, which are all high and over the (WHO) recommended threshold. The values range from to (83-37). High COD levels are caused by organic materials and reduced inorganic compounds emitted by enterprises that utilize dissolved oxygen [25]. The nitrate analysis (NO3) is shown in Figure 9, which shows that site 1 and 2 samples of B, C are below the (WHO) allowed level, whereas the remainder of the results exceed the limits and values range from to (10 - 50). Figure 10 shows the values of SO4 sulfate, where a considerable rise in values is seen and all samples above the allowed limit of the (WHO), which does not exceed 250. while the values of the samples ranged (362-1966). The rise in SO4 may be due to the remnants of the war that the city witnessed during the violent battles that lasted three years (2014-2016), in which different types of weapons were used that contain sulfurate elements whose traces are still Existing to this day, as well as fuels derived from petroleum (such as gasoline and diesel fuel) [26], where it is observed in the city the use of private generators whose waste contains SO4 [27]. As for the dissolved solids (TDS) concentrations, as indicated in Figure 11. These values are ranged between (523-1886). Some of these values are within WHO's allowed limits, while others exceed them, as Site 2 shows. All samples surpassed the allowable limit for dissolved solids. The suspended solids (TSS) values shown in Figure 12 are between (48 - 99). The values of the Zn and Cu samples are shown in Figures 13 and 14, and they are limited and within the standards of the (WHO).
Table 3. Physical and chemical analysis of in site storm sewer samples (1, 2 and 3.)
|
Region |
(Site 1) |
(Site 2) |
(Site 3) |
|
|||
|
|
min |
max |
min |
max |
min |
max |
WHO |
|
PH |
7.3 |
7.8 |
7.1 |
7.6 |
7.3 |
7.7 |
6.5-8.5 |
|
E.C(µs/cm) |
1264 |
2061 |
1476 |
2725 |
1176 |
2343 |
750 |
|
ALK(mg/l) |
170 |
279 |
173 |
289 |
112 |
190 |
200 |
|
TH(mg/l) |
820 |
1500 |
894 |
1642 |
436 |
1276 |
750 |
|
Ca(mg/l) |
194 |
435 |
206 |
392 |
109 |
302 |
200 |
|
BOD5(mg/l) |
8 |
96 |
17 |
86 |
15 |
89 |
5 |
|
COD(mg/l) |
37 |
74.4 |
48 |
83 |
45 |
80.5 |
|
|
NO3(mg/l) |
10 |
50 |
10 |
48 |
22 |
37 |
15 |
|
SO4(mg/l) |
680 |
1966 |
722 |
1546 |
362 |
730 |
250 |
|
TDS(mg/l) |
620 |
1752 |
986 |
1880 |
523 |
1590 |
750 |
|
TSS(mg/l) |
48 |
99 |
54 |
86 |
50 |
91 |
60 |
|
Zn |
0.001 |
0.003 |
0.001 |
0.007 |
0 |
0.002 |
|
|
Cu |
0 |
0.062 |
0.014 |
0.048 |
0 |
0.038 |
|
Figure 3. pH values (October and April months)
Figure 4. Electrical conductivity values (October and April months)
Figure 5. Alkalinity concentrations (October and April months)
Figure 6. Total hardness concentrations (October and April months)
Figure 7. BOD5 concentrations (October and Apri months)
Figure 8. COD concentrations (October and April months)
Figure 9. Nitrate values (October and April months)
Figure 10. Sulfate values (October and April months)
Figure 11. TDS values (October and April months)
Figure 12. TSS values October and April months
Figure 13. (Zn) value In the month of October and April
Figure 14. (Cu )value In the month of October and April
The water quality index is based on some important characteristics and criteria that are a preliminary guide to water quality, and thus gives a general idea of the potential water problems in any region. The water quality index for the storm sewers in Ramadi city to the final exit before it flows into the river is shown in Table 4, where all values indicate that the water quality that comes from the storm sewage is very poor, except for site 3 (C* in April), the water Poor quality This indicates that the storm sewer network may have to be bypassed, and there may be sources of pollution in the city, which may be industrial, commercial or agricultural, whose waste is dumped directly on the street. Pollution is transferred to river waters through storm sewers, which may be one of the causes of river pollution.
Table 4. Water quality Indices for water samples from (site 1, site 2, site 3)
|
Region |
water sample |
Water Quality Index (WQI) |
Class |
Status of water quality |
|
Al-moallemen (Site 1) |
C |
23.58 |
1 |
Poor water quality |
|
C* |
27.619 |
1 |
Poor water quality |
|
|
Al-Malaab (Site 2) |
C |
23 |
1 |
Poor water quality |
|
C* |
41.8 |
1 |
Poor water quality |
|
|
Al-shurta (Site 3) |
C |
40.5 |
1 |
Poor water quality |
|
C* |
53 |
2 |
Marginal water quality |
4.1 Multiple linear regression
If you have a limited sample size, the most effective methods for analyzing any link between dependent and independent variables are statistical approaches, such as regression models [28]. Modeling the linear connection that exists between a dependent variable and one or more independent variables may be accomplished via the use of the MLR approach.
Using version 26 of the SPSS program, multiple linear regression analysis was performed. The information from the water assays and how it relates to the water quality index was used, and in order to determine which variables have a significant correlation with the WQI, the variables that were used in this analysis (SO4, BOD5, TSS, and TDS) were examined to determine which variables have a significant correlation with the WQI. As a consequence, a multiple linear regression model was employed in order to determine the association between WQI and the variables (SO4, BOD5, TSS, and TDS). The findings of the study were compiled and presented in Table 5, which can be seen below.
Table 5. Multiple linear regression analysis for WQI
|
Dependent Variable |
WQI |
|
|
|
|
|
predictive variables |
|
SO4 |
BOD5 |
TDS |
TSS |
|
R |
0.927 |
|
|
|
|
|
R2 |
0.859 |
|
|
|
|
|
Value (F) |
15.185 |
|
|
|
|
|
Significance (F) |
0.0002 |
|
|
|
|
|
B(coefficient) |
97.01 |
-0.009 |
-0.231 |
-0.0151 |
-0.4163 |
|
t |
8.732 |
-2.612 |
-4.361 |
-4.013 |
-3.538 |
|
p-value |
0 |
0.025 |
0.0014 |
0.0024 |
0.0053 |
|
VIF |
|
1.83 |
1.845 |
2.666 |
2.605 |
The results of the regression model showed that the model is significant through the value of F test of (15.185) in terms of (0.0002) less than the level of significance (0.01), and the results explain that variables explain (85.9%) of the variance in (SO4, BOD5, TSS, and TDS) with a value of (0.927), which is statistically significant as it can be deduced from the value of (t) and its associated significance.
According to the suggestion, p-values that are less than 0.05 are considered to be adequate. In this regard, all forecasts should be considered essential. Since it is impossible to ignore the impact that an increase in the concentrations of these have on the quality of the water, the model predicts that there is an inverse relationship between the water quality index (WQI) and each of the variables (SO4, BOD5, TSS, and TDS). This relationship is demonstrated by the fact that the WQI decreases when the concentrations of the variables (SO4, BOD5, TSS, and TDS) all increase.
Table 6. Correlation coefficient matrix for storm sewer
|
Parameter |
WQI |
SO4 |
BOD5 |
TDS |
TSS |
|
WQI |
1.000 |
|
|
|
|
|
SO4 |
-.706- |
1.000 |
|
|
|
|
BOD5 |
-.238- |
-.117- |
1.000 |
|
|
|
TDS |
.033 |
-.058- |
-.632- |
1.000 |
|
|
TSS |
-.619- |
.608 |
.110 |
-.505- |
1.000 |
The results of the study show that the degree of linear correlation between any two of the storm water quality coefficients and (WQI) measured by the correlation coefficient (R) are presented in Table 6. It was found that the (WQI) is highly significant with SO4 and TSS with values of 70.6% and 61.9%, respectively, and that a significant decrease correlated with TDS and BOD5.
The regression equation can be written as follows:
WQI = 97.01 – 0.009*SO4 – 0.231*BOD5 – 0.0151*TDS – 0.4163*TSS
[1] Pitt, R., Field, R., Lalor, M., Brown, M. (1995). Urban stormwater toxic pollutants: assessment, sources, and treatability. Water Environment Research, 67(3): 260-275. https://doi.org/10.2175/106143095X131466
[2] Ahyerre, M., Chebbo, G., Saad, M. (2000). Sources and erosion of organic solids in a combined sewer. Urban Water, 2(4): 305-315. http://dx.doi.org/10.1016/S1462-0758(01)00012-7
[3] Nawrot, N., Wojciechowska, E. (2017). Review on the quality of sediments from the stormwater drainage system in the urban area. In E3S Web of Conferences, 17: 00064. http://dx.doi.org/10.1051/e3sconf/20171700064
[4] Greenway, M., Jenkins, G. (2004). A comparative study of the effectiveness of wetlands and ponds in the treatment of stormwater in subtropical Australia. In 9Th IWA Conference on Wetland Systems for Water Pollution Control, 1-12. https://citeseerx.ist.psu.edu/viewdoc/download?doi=10.1.1.460.8121&rep=rep1&type=pdf.
[5] Ashley, R.M., Bertrand-Krajewski, J.L., Hvitved Jacobsen, T., Verbanck, M. (2004). Solids in Sewers. IWA Publishing. https://doi.org/10.2166/wst.2005.0063
[6] Mohammed, M.H., Zwain, H.M., Hassan, W.H. (2022). Modeling the quality of sewage during the leaking of stormwater surface runoff to the sanitary sewer system using SWMM: a case study. AQUA-Water Infrastructure, Ecosystems and Society, 71(1): 86-99. http://dx.doi.org/10.2166/aqua.2021.227
[7] Yu, X. (2008). Use of low quality water: An integrated approach to urban stormwater management (USM) in the Greater Metropolitan Region of Sydney (GMRS). International Journal of Environmental Studies, 65(1): 119-137. https://doi.org/10.1080/00207230701846648
[8] Hao, R.X., Zhou, Y.W., Liang, P., Wang, M.M., Zhao, S.Q., Ding, Y.Y. (2006). Quality and stability analysis for the rainfall water and surface runoff water in southeast region of Beijing Municipality. Journal of Environmental Science and Health, Part A, 41(7): 1293-1302. https://doi.org/10.1080/10934520600656901
[9] Zare Abyaneh, H. (2014). Evaluation of multivariate linear regression and artificial neural networks in prediction of water quality parameters. Journal of Environmental Health Science and Engineering, 12(1): 1-8. http://dx.doi.org/10.1186/2052-336X-12-40
[10] Al-obaidi, B.H. (2020). Predicting municipal sewage effluent quality index using mathematical models in the al-rustamiya sewage treatment planT. Journal of Engineering Science and Technology, 15(6): 3571-3587.
[11] Valentini, M., dos Santos, G.B., Muller Vieira, B. (2021). Multiple linear regression analysis (MLR) applied for modeling a new WQI equation for monitoring the water quality of Mirim Lagoon, in the state of Rio Grande do Sul—Brazil. SN Applied Sciences, 3(1): 1-11. http://dx.doi.org/10.1007/s42452-020-04005-1
[12] Gasperi, J., Gromaire, M.C., Kafi, M., Moilleron, R., Chebbo, G. (2010). Contributions of wastewater, runoff and sewer deposit erosion to wet weather pollutant loads in combined sewer systems. Water Research, 44(20): 5875-5886. https://doi.org/10.1016/j.watres.2010.07.008
[13] Chabuk, A., Hammood, Z.A., Al-Ansari, N., Abed, S.A., Laue, J. (2021). Classification maps for TDS concentrations in the GIS along Euphrates river, Iraq. Water, Air, & Soil Pollution, 232(8): 1-15. http://dx.doi.org/10.1007/s11270-021-05236-7
[14] Al-Bahrani, H.S. (2014). Spatial prediction and classification of water quality parameters for irrigation use in the Euphrates River (Iraq) using GIS and satellite image analyses. International Journal of Sustainable Development and Planning, 9(3): 389-399. http://dx.doi.org/10.2495/SDP-V9-N3-389-399
[15] Abdulrahman, M.F., Yosif, Y.M., Saod, W.M., Al-Heety, E.A. (2021). Effect of discharge on water quality in Euphrates River between Hit and Ramadi, Iraq. The Iraqi Geological Journal, 101-111. https://doi.org/10.46717/igj.54.2B.9Ms-2021-08-29
[16] Saod, W.M., Al-Heety, E.A.M.S., Mohammed, M.M. (2020). Spatial and temporal variation of water quality index of Euphrates River in Anbar Governorate, Iraq. In AIP Conference Proceedings, 2213(1): 020042. https://doi.org/10.1063/5.0000190
[17] Thoe, W., Lee, J.H. (2014). Daily forecasting of Hong Kong beach water quality by multiple linear regression models. Journal of Environmental Engineering, 140(2): 04013007. https://doi.org/10.1061/(ASCE)EE.1943-7870.0000800
[18] Al-Mayah, W.T., Mashaanrabee, A. (2009). Evaluation of water quality using water quality index (WQI) Method and GIS in Al-Gharraf river southren of Iraq. Water Quality Monitoring and Water Quality Assessment and River Water Pollution. https://doi.org/10.13140/RG.2.2.27768.88325
[19] Abood, R.A., Mustafa, A., Al Somaydaii, J. (2021). Assessment of groundwater quality at selected location of Three Wells and Al-Warrar Canal, Ramadi City, Iraq. Iraqi Journal of Civil Engineering, 15(2). https://doi.org/10.37650/ijce.2021.170714
[20] Aenab, A.M., Singh, S.K. (2012). Critical assessment of environmental quality of Baghdad, Iraq. Journal of Environmental Engineering, 138(5): 601. https://doi.org/10.1061/(ASCE)EE.1943-7870.0000501
[21] Al-Ani, R.R.A., Al-Obaidi, B.H.K. (2019). Prediction of sediment accumulation model for trunk sewer using multiple linear regression and neural network techniques. Civil Engineering Journal, 5(1): 82-92. https://doi.org/10.28991/cej-2019-03091227
[22] Seco, R.I. (2014). In-Sewer Organic Sediment Transport: Study of the Release of Sediments During Wet-Weather from Combined Sewer Systems in the Mediterranean Region in Spain. http://hdl.handle.net/2117/95534.
[23] Al‐Jaralla, R., Al‐Fares, R. (2009). Quality of stormwater runoff in the State of Kuwait, Al‐Asema governorate. International Journal of Environmental Studies, 66(2): 227-239. https://doi.org/10.1080/00207230902859838
[24] Deletic, A.B., Maksimovic, C.T. (1998). Evaluation of water quality factors in storm runoff from paved areas. Journal of Environmental Engineering, 124(9): 869-879. https://doi.org/10.1061/(ASCE)0733-9372(1998)124:9(869)
[25] World Health Organization. (2006). Air quality guidelines: global update 2005: Particulate matter, ozone, nitrogen dioxide, and sulfur dioxide. World Health Organization. https://apps.who.int/iris/handle/10665/107823.
[26] Taebi, A., Droste, R.L. (2004). Pollution loads in urban runoff and sanitary wastewater. Science of the total Environment, 327(1-3): 175-184. https://doi.org/10.1016/j.scitotenv.2003.11.015
[27] Gilbert, J.K., Clausen, J.C. (2006). Stormwater runoff quality and quantity from asphalt, paver, and crushed stone driveways in Connecticut. Water Research, 40(4): 826-832. https://doi.org/10.1016/j.watres.2005.12.006
[28] Pallant, J. (2020). SPSS Survival Manual: A Step by Step Guide to Data Analysis Using IBM SPSS. Routledge. https://doi.org/10.4324/9781003117452