Akeem Ganiyu Rabiu | Olutayo Israel Falodun* | Dayo Amos Adegboyega
© 2022 IIETA. This article is published by IIETA and is licensed under the CC BY 4.0 license (http://creativecommons.org/licenses/by/4.0/).
OPEN ACCESS
The purpose of the study is to assess the levels of some physicochemical parameters and heavy metals in water sources and quantify their possible impact. Household water samples that include well water (n = 80) and treated municipal water (n = 3) collected from March 2019 to March 2020 were analysed for 11 physicochemical properties using instrumentation and classical methods. The estimated water parameters were first compared with standard values for drinking water and then analysed spatially using Inverse Distance Weighting (IDW) interpolation in ArcGIS software. Water quality indices were also computed as function of the potability of the water sampled. Through this study, it was found that the well water samples were slightly acidic (pH 6.7+0.61) while the concentration of nitrate (59.38 mg/L), sulphate (294.06 mg/L), cadmium (0.03 mg/L) and lead (0.13 mg/L) were above permissible limits in drinking water - 50 mg/L, 100 mg/L, 0.003 mg/L and 0.01 mg/L, respectively. The results indicates that more than 92% of the well water samples were unfit for drinking due to elevated concentrations of nitrate, sulphate, cadmium and lead. Findings from this study suggest prioritisation of clean water provision to residents in the affected communities to avert public health emergency.
groundwater, physicochemical parameters, heavy metals, geographic positioning system, inverse distance weighting, water quality index
Groundwater is one of the finest water resources suitable for drinking and domestic purposes when free from biological and physicochemical contamination [1]. For the most part, in the rural Sub-Saharan Africa, municipal treated water is usually in short supply and this makes groundwater an excellent alternative source of water supply for domestic purposes [2-5]. While anthropogenic activities can affect the quality of groundwater, natural processes such as anoxia in the aquifers, geological processes and interactions between the rocks and water can also compromise the safety of groundwater [6-8]. Groundwater intended for domestic purposes are required to be assessed for physicochemical parameters and trace metals [5] since concentrations of chemical contaminants above regulatory limits can lead to serious health complications [9, 10].
In order to gain insight into the quality of water sources, Water Quality Index (WQI) is recommended because of its use of raw water quality data to produce specific information on the potability of water source [8]. The WQI provides an aggregate number that represent the overall water quality at a specific location and time, and thus permits comparison between different sampling sites. Furthermore, the WQI simplifies compound data into easily intelligible and usable information. Moreover, the classification of water quality used in computing WQI empirically informs the extent of water pollution, if any, and whether the water is suitable for domestic purposes or otherwise. Overall, the WQI aggregate value derivable from estimated parameters yields valid and explainable information about water quality [11], even though modification to the WQI has been reported [12].
Thus, the Canadian Council of Ministers of the Environment (CCME) developed a gold WQI standard based on comparison of estimated concentrations of water quality parameters to guidelines [13]. However, the spatial discernment of how groundwater sources get contaminated can become clearer when WQI data is contextualised using Geographical Information Systems (GIS) [5]. This study therefore explored the use of WQI and GIS to get a comprehensible picture of the effect of seasonal variations on groundwater quality and highlight the possible source(s) of contamination.
The distribution of treated municipal water is slanted to the advantage of Ibadan metropolis because the two public water treatment plants (Asejire and Eleyele) constructed to supply water to residents do not perform optimally [14]. This has led the residents of sub-urban Ibadan, particularly in Akinyele and Lagelu regions, hitherto un-connected to municipal water works, to consume water from well water sources, some of which are acquiescent to fecal contamination during rainfall [15].
Meanwhile, in few well water sources at Akinyele and Lagelu region that were free from biological contamination, little is known of their physicochemical qualities before being certified safe for drinking and domestic purposes. Despite the prioritization of access to clean water at national levels in Nigeria, no recent study has examined the impact of seasonal changes on the groundwater physicochemical qualities in these communities. The current study therefore aims to assess the quality of the well water sources in the sub-urban Ibadan communities to understand how seasonal changes could alter the groundwater quality, outline the possible source(s) of water contamination and their impacts while proffering immediate and remote remedy.
2.1 Research design and study area
Analysis of well water samples for physicochemical parameters and heavy metals is part of a study on the status of household water in sub-urban Ibadan, Southwest Nigeria. The current study is a longitudinal investigation of household water sources in Akinyele and Lagelu regions of Ibadan (Figure 1) out of the six administrative areas with sub-urban status in Ibadan [16]. Ibadan is the third largest city in Nigeria with a population of 3, 552, 000 [17] located between the latitude (3°49`E and 3°57`E) and longitude (7°20`N and 7°27`N) [16, 18]. As a result of urban renewal, the Akinyele and Lagelu regions were re-demarcated in the course of this study into six sub-administrative units. Overall, these locations were selected based on their sub-urban attribute and non-connectivity to the municipal water supply [19]. Forty sub-urban households were randomly included in the study where well water samples (n = 80; 40 samples per season) and treated municipal water (n = 3) were collected. The water samples collected from March 2019 through March, 2020 were analysed for 11 physicochemical parameters that include pH, temperature, conductivity, Total Dissolved Solids (TDS), Total Suspended Solids (TSS), Total Solids (TS), Sulphate (SO4), Nitrate (NO3), cadmium (Cd), chromium (Cr) and lead (Pb).
2.2 Sample collection
The well water samples were collected into a clean one-L polyethylene bottle already pre-washed with deionised water. The experiment was controlled through collection of treated water samples from municipal water treatment plant at Asejire, Ibadan. The Asejire water treatment facility, though less operational, was designed to provide clean water to households in Akinyele communities and those at the fringes of the Lagelu region. After collection, the samples were placed on an ice park inside a dark container to avoid the effects of temperature and light.
2.3 Determination of physicochemical parameters and heavy metals
The water physicochemical parameters were measured using standard methods and guidelines of the American Public Health Association [20]. For each of the samples, duplicate readings of the parameters were taken and the average values of the readings were recorded. In carrying out the experiments, firstly, the probe used was rinsed with deionized water after each measurement to avoid cross contamination among the samples.
2.3.1 Instrumentation and sample analysis
The pH of the well water samples was taken by using a pH metre. Three standard solutions of pH 4.0, 7.0 and 10.0 were used to calibrate the pH metre before taking the readings. The pH probe was first immersed in the samples and held for a few minutes to achieve a stable reading. The temperature of the samples was taken at each sampling point using mercury thermometer, while the conductivity was measured by the conductivity metre. Standard solution of known conductivity was used to standardise the conductivity metre probe. After the calibration, the probe was immersed in the water sample and reading was taken. Using filtration method, the samples were analysed for TS, TSS and TDS following previously described standards and procedures [20-22].
2.3.2 Analysis of water samples for heavy metals
The water samples were analysed for three heavy metals - chromium (Cr), cadmium (Cd), and lead (Pb). Briefly, 50 mL of the filtered water sample was poured into a digestion flask and diluted with 10 mL of 68% HNO3. The mixture was heated for about 6 h at 80 °C until the resulting volume was approximately one-fifth of its original volume. The solution was allowed to cool and filtered with Whatman number 41 filter paper. Distilled water was used to dilute the filtrate to 100 mL [23]. The concentrations of Cd, Cr and Pb in the water samples were determined using Flame Atomic Absorption Spectrometer (FAAS).
2.4 Determination of water quality index
To calculate the WQI, the standard value of the estimated parameter (Si) was obtained from national [24] and international guidelines [25]. The inverse of each standard value of the estimated parameter was calculated and the cumulative value (Cv) for all the estimated parameters were performed in Eq. (1). The inverse of Cv was taken as constant of the proportionality, K in Eq. (2) [26]. The unit weight, Wi, of each parameter was calculated as K/Si in Eq. (3). The quality rating, Qi was computed using Eq. (4) where Ci = concentration of each parameter in mg/L except temperature, pH and electrical conductivity. The WQI was computed as ∑WiQi for all the estimated parameters since ∑Wi = 1 in Eq. 5. The water sources were then grouped where 0 ≤ WQI ≤ 50, 50 < WQI ≤ 100, 100 < WQI ≤ 200, 200 < WQI ≤ 300 and WQI > 300 respectively denotes excellent water, good water, poor water, very poor water and water unfit for drinking [27].
Cv = ∑(1/Si) (1)
where, Si is the standard value for ith parameter, Cv is the summation of inverse of the standard value for the estimated parameters.
K = 1/Cv (2)
K is the constant of the proportionality
Wi = K/Si (3)
Wi is the unit weight of each parameter
Qi = (Ci/Si) x 100 (4)
Qi is the quality rating for the ith water quality parameter
WQI = ∑WiQi (5)
WQI is the water quality index
2.5 Data analysis
The raw water data were analysed using descriptive statistics, while p value was preset at < 0.05. The minimum, maximum, mean and standard deviation of the estimated parameters were calculated in MS-Excel 2016. The variations observed in pH, temperature, NO3, SO4, Cd, Cr and Pb over seasonal changes were investigated using a box plot analysis. Computed WQI assigned to their corresponding households’ Geographic Positioning System (GPS) coordinates taken by GPS coordinates Version 4.56 (144) were drawn into maps using Inverse Distance Weighting (IDW) interpolation method in ArcGIS 10.3 software [28].
Figure 1. Map of the contiguous Akinyele and Lagelu regions of Ibadan showing sampling locations and associated features
3.1 Analysis of physicochemical parameters and heavy metals
The results of the physicochemical parameters and heavy metals are listed in Table 1. Little dissimilarity was noted in the values of temperature for the well water samples in the 2019 wet season (mean = 27.8℃) compared to what was obtained in 2020 dry season and the treated municipal water (28.5℃). Minor variations were also observed in the pH values recorded in the 2019 wet season (pH mean value = 6.8) as against the 2020 dry season (pH mean value = 6.7). The conductivity of the well water during the wet season (503.7 µS/cm) compares with the dry period (492.1 µS/cm), though the conductivity of the treated water was much lower (109.7 µS/cm). In contrast to the values obtained for conductivity, slightly higher values were recorded for TDS between the wet season (252.03 mg/L) and the dry season (246.0 mg/L) though lower value was obtained in the treated water (71.6 mg/L). The values recorded for TSS were very negligible in the samplings; in effect, the TS values had a similar pattern with the TDS (Table 1). The nitrate concentration of 14.15 mg/L in the 2019 wet season was tripled in the succeeding dry season (59.38 mg/L), though it was much lower in the treated water (5.37 mg/L).
The average sulphate value in the dry sampling (294.05 mg/L) was more than ten times the value obtained in the wet season (25.85 mg/L). Again, the treated water had the lowest sulphate concentration of 2.77 mg/L. Analysis of the samples for heavy metals showed that Cd, Cr and Pb concentrations were below detectable concentrations in the treated water samples (Table 1). Moreover, there was little or no difference in the concentrations of Cd, Cr and Pb in the 2019 wet season (0.02 mg/L, 0.01 mg/L and 0.13 mg/L) relative to what was obtained in the 2020 dry season sampling (0.03 mg/L, 0.02 mg/L and 0.13 mg/L) (Table 1). A sum-up of the treated municipal water physicochemical properties showed that the values obtained fell below acceptable limits for drinking water.
3.2 An overview of the groundwater contamination
Simultaneous analysis of the results of the groundwater physicochemical parameters alongside with standards is presented in Table 2. The results of this study compared with the standards recommended for drinking water by National Standards for Drinking Water Quality [24] and World Health Organisation [25] was used as yardstick for the assessment of the level of chemical contamination of the water sources. The side by side comparison of the estimated and standard values clearly showed variations in the well water quality. Though pH, conductivity, TS, TDS, TSS and chromium were within the permissible level, other water quality parameters (temperature, nitrate, sulphate, cadmium and lead) were higher than the permissible levels. The recommended temperature of 25℃ for drinking water [24, 25] was exceeded by the well water and the treated municipal water (Table 2).
Table 1. The physicochemical and heavy metals concentrations of water sources from sub-urban Ibadan, Southwestern Nigeria
|
SAMPLINGS |
Wet season Well = 40 |
Treated Municipal Water = 3 |
Dry season Well = 40 |
|||||||||
|
Min |
Max |
Median |
Mean |
Min |
Max |
Median |
Mean |
Min |
Max |
Median |
Mean |
|
|
Temp. (℃) |
26.9 |
28.5 |
27.9 |
27.8 |
28.4 |
28.5 |
28.5 |
28.5 |
28.4 |
33.3 |
28.5 |
29.77 |
|
pH |
5.54 |
7.93 |
6.71 |
6.8 |
6.7 |
7.11 |
6.97 |
7.09 |
6 |
7.3 |
6.65 |
6.7 |
|
EC (${\mu}$S/cm) |
121 |
1895 |
404 |
503.7 |
106.5 |
120.5 |
112.2 |
109.7 |
161 |
1859 |
361 |
492.1 |
|
TDS (mg/L) |
61 |
951 |
202 |
252.03 |
69.8 |
79.1 |
73.5 |
71.6 |
81 |
929 |
180.5 |
246 |
|
TSS (mg/L) |
0 |
1.21 |
0.04 |
0.24 |
0 |
0 |
0 |
0 |
0 |
0.2 |
0 |
0.03 |
|
TS (mg/L) |
61 |
951 |
202.15 |
252.26 |
69.8 |
79.1 |
73.5 |
71.6 |
81.08 |
929.08 |
180.5 |
246.01 |
|
NO3 (mg/L) |
0 |
80.83 |
3.34 |
14.15 |
2.46 |
10.79 |
6.21 |
5.37 |
0 |
172.5 |
45.83 |
59.38 |
|
SO4 (mg/L) |
1.37 |
67.32 |
26.49 |
25.85 |
0.51 |
4.38 |
2.55 |
2.77 |
16.46 |
872.38 |
195.05 |
294.06 |
|
Cd (mg/L) |
0 |
0.1 |
0.02 |
0.02 |
0 |
0 |
0 |
0 |
0 |
0.12 |
0.02 |
0.03 |
|
Cr (mg/L) |
0 |
0.36 |
0 |
0.01 |
0 |
0 |
0 |
0 |
0 |
0.47 |
0 |
0.02 |
|
Pb (mg/L) |
0 |
0.95 |
0 |
0.13 |
0 |
0 |
0 |
0 |
0 |
0.83 |
0.02 |
0.13 |
Temperature,Temp.; potential hydrogen ion concentration, pH; Electrical Conductivity, EC; Total Dissolved Solids, TDS; Total Suspended Solids, TSS, Total Solids TS; Nitrate, NO3, Sulphate SO4, Cadmium, Cd; Chromium, Cr; Lead, Pb.
Table 2. The unit weight and comparison of data between the current study and drinking water guidelines
|
Parameters |
NSDWQ 2015 |
WHO 2011 |
Standards, Si |
1/Si |
K = 1/ ∑ (1/Si) |
Wi = K/Si |
Mean seasonal values |
||
|
Wella |
Wellb |
Municipal |
|||||||
|
Temp. (℃) |
- |
25 |
25 |
0.04 |
0.0022 |
0.000088 |
27.76 |
29.77 |
28.5 |
|
pH |
6.5-8.5 |
6.5-8.5 |
7.5 |
0.133 |
0.0022 |
0.000294 |
6.8 |
6.7 |
7.09 |
|
EC ($\boldsymbol{\mu}$S/cm) |
1000 |
1000 |
1000 |
0.001 |
0.0022 |
0.000002 |
503.73 |
492.08 |
109.7 |
|
TDS (mg/L) |
500 |
500 |
500 |
0.002 |
0.0022 |
0.000004 |
252.03 |
245.98 |
71.6 |
|
TSS (mg/L) |
25 |
- |
25 |
0.04 |
0.0022 |
0.000088 |
0.24 |
0.03 |
0 |
|
TS (mg/L) |
- |
- |
- |
- |
- |
- |
252.26 |
246.01 |
71.6 |
|
NO3 (mg/L) |
50 |
50 |
50 |
0.02 |
0.0022 |
0.000044 |
14.15 |
59.38 |
5.37 |
|
SO4 (mg/L) |
100 |
100 |
100 |
0.01 |
0.0022 |
0.000022 |
25.85 |
294.06 |
2.77 |
|
Cd (mg/L) |
0.003 |
0.003 |
0.003 |
333.3 |
0.0022 |
0.734895 |
0.02 |
0.03 |
0 |
|
Cr (mg/L) |
0.05 |
0.05 |
0.05 |
20 |
0.0022 |
0.044094 |
0.01 |
0.02 |
0 |
|
Pb (mg/L) |
0.01 |
0.01 |
0.01 |
100 |
0.0022 |
0.220468 |
0.13 |
0.13 |
0 |
|
|
∑ |
|
|
|
|
1 |
|
|
|
Temperature, Temp.; potential hydrogen ion concentration, pH; Electrical Conductivity, EC; Total Dissolved Solids, TDS; Total Suspended Solids, TSS, Total Solids TS; Nitrate, NO3, Sulphate SO4, Cadmium, Cd; Chromium, Cr; Lead, Pb.
a = values obtained for the 2019 wet season; b = values obtained in the well water sources during the 2020 wet season
Table 3. Overall seasonal rating of well water quality in the sub-urban Ibadan households
|
Range of WQI |
Water quality |
No. in each category |
|
0 ≤ WQI ≤ 50 |
Excellent water |
3 |
|
50 < WQI ≤ 100 |
Good water |
0 |
|
100 < WQI ≤ 200 |
Poor water |
1 |
|
200 < WQI ≤ 300 |
Very poor water |
5 |
|
WQI > 300 |
Unfit for drinking |
31 |
WQI = Water Quality Index
The elevated NO3 and SO4 concentration in the samples was above the regulatory limit in the dry sampling as did Cd and Pb in the same period (Table 2). The pH values of 5.54 - 6.0 suggest that the well water was slightly acidic as about two-third of the water samples had pH value below the acceptable limit of 6.5 - 8.5 [24, 25]. Regarding sulphate concentration in the well water samples, more than two-third of the samples analysed in the dry season were above the acceptable limits.
3.3 Spatial analysis of the water quality indices
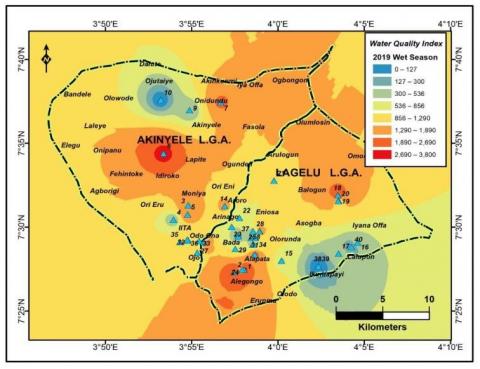
Figure 2. Spatial distribution of well water quality using IDW interpolation in the study area during wet season
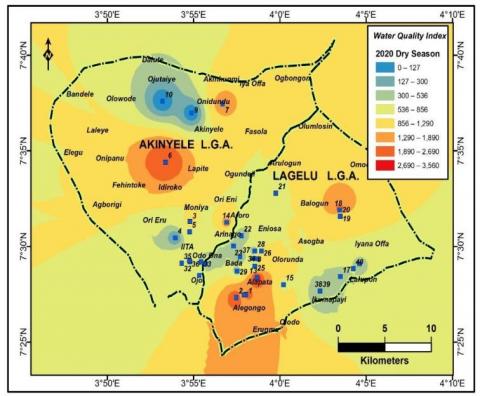
Figure 3. Spatial distribution of well water quality using IDW interpolation in the study area during dry season.
The WQI values varied from 0 - 3, 795 (2019 wet season) and 0 - 3, 564 (2020 dry season) though comparable yet there were inherent dissimilarities in the WQI across the seasons. Progressively, the number of well water sources that deserved potability in the 2019 wet season (n = 8) were halved in the succeeding dry season (n = 4). Overall, only three (7.5%) out of the 40 water samples were suitable for drinking whereas one (2.5%) was poor, five (12.5%) were very poor and 31 (77.5%) of the well water sources were unfit for consumption (Table 3). The spatial analysis of the WQI showed that the water points deteriorated during the wet season compared side by side with the dry season (Figure 2 and 3). The IDW revealed that the quality of the well water sources in the 2019 wet season was poor (Figure 2) as against similar locations in the 2020 dry season (Figure 3) though these locations permeate Lagelu and Akinyele communities.
3.4 Variability of water quality parameters over seasonal changes
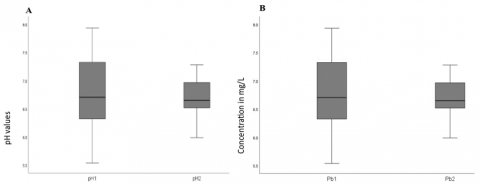
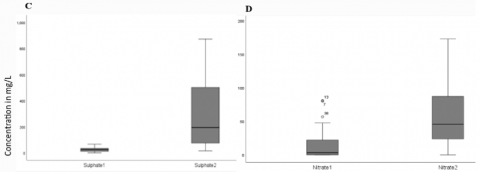
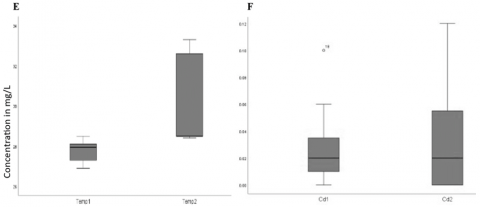
The spread and variability of physicochemical parameters investigated using box plot analysis showed greater variability in pH (Figure 4 (A)) and Pb (Figure 4 (B)) in the wet season compared to the dry season. The degree of sulphate and nitrate concentration examined across the seasons on the other hand showed that sulphate (Figure 4 (C)) and nitrate (Figure 4 (D)) had lower spread in the dry season compared to wet season. This pattern was also the same pattern noted for temperature (Figure 4 (E)) and cadmium (Figure 4 (F)).
Figure 4. Box plot analysis showing variability and spread of the estimated parameters over seasonal changes
(A) shows box plot analysis for pH values; pH1 corresponds to 2019 wet season while pH2 corresponds to 2020 dry season; (B) shows box plot analysis of Lead values; Pb1 corresponds to 2019 wet season while Pb2 corresponds to 2020 dry season; (C) shows box plot analysis of sulphate values; sulphate1 corresponds to the 2019 wet season while sulphate2 corresponds to the 2020 dry season; (D) shows box plot analysis of nitrate values; nitrate1 corresponds to the 2019 wet season while nitrate2 corresponds to the 2020 dry season; (E) shows box plot analysis of temperature values; Temp1 corresponds to the 2019 wet season while Temp2 corresponds to the 2020 dry season; (F) shows box plot analysis of cadmium (Cd) values; Cd1 corresponds to the 2019 wet season while Cd2 corresponds to the 2020 dry season.The way that section titles and other headings are displayed in these instructions, is meant to be followed in your paper.
The need for continuous assessment of household water quality is to guarantee public safety while ensuring that water-related illnesses are quickly detected. This becomes particularly pertinent in sub-urban communities disproportionately affected by clean water supply in Sub-Sahara Africa [19] where there is dearth of municipal water supply infrastructure. The current longitudinal study was therefore conducted in the sub-urban Ibadan locales to assess the drinking water quality using WQI that provides composite information on the effect of chemical contamination of water. In order to ascertain the level of chemical quality of the well water sources and the suitability of the water sources for drinking, the results obtained were compared with the national [24] and international standards [25].
The impact of seasonal variations on well water quality is rarely a subject of scrutiny in Ibadan informal communities, thus this study reported slightly acidic water as against a highly acidic water reported from borehole examination with pH of 4.8 in southeastern part of Nigeria [26]. The pH of water is usually influenced by several factors that include interactions between rock, soil, organic and chemical materials [29]. Acidic water is generally known to be corrosive, able to solubilise rock materials and change the water-chemical imbalance [29]. The water temperatures were above national and international standards and is in agreement with the recent report of Nta and colleagues [30] where elevated temperature of groundwater was indicated as function of the water sources’ microbiological quality. The ability of water to carry electric current depends on the presence of dissolved solids such as calcium, potassium, magnesium and sodium in water [22]. Still, conductivity does not have a direct negative impact on human health except for its effect on water aesthetic value [24].
The longitudinal analysis showed contemporaneous higher NO3 and SO4 concentration in the dry season compared to the wet period since fewer wells in the wet season (n = 3) had nitrate concentration above the allowable limits compared to the number of wells in the dry season (n = 19). Overall, the current study reported more than ten-fold nitrate concentration of 59.38 mg/L compared side by side with 5.49 mg/L reported from hand-dug well in Kafta Humera, Ethiopia where 85% of the water source were used for domestic purpose [31].
Furthermore, the nitrate concentration obtained from the present study is far higher, and were not in agreement with the report of studies carried out on borehole water samples in south-southern Nigeria and in Limpopo, South Africa, where the nitrate concentration of 1.58 mg/L and 4.99 mg/L, respectively were reported [5, 26]. This discrepancy could be due to the well water acidity and elevated water temperature that probably supported solubilisation of rock minerals. High nitrate concentration in water is detrimental because consumption of water contaminated with nitrate in the midwestern United States of America was associated with methemoglobinemia, otherwise called blue baby syndrome [32]. Methemoglobinemia occurs during nitrate-induced oxidation of hemoglobin that inhibits usual oxygen binding thus resulting in reduced oxygen tension [32, 33].
The pattern shown by NO3 and SO4 in this study probably indicates that they are likely from similar sources. In the urban informal settings of the low and middle-income countries, poor sanitation and unhygienic practices largely predispose residents to acquisition of bacterial infections from fecal materials entering water supply systems [34]. The observation that sulphate and nitrate varied widely in the dry season may have supported bacterial growth and proliferation [27] thus increasing the temperature of the well water thus facilitating rock materials solubilisation.
It is hypothesised that during the wet season, the amount of rainfall can sufficiently raise the water table, thus increase the amount of water in the wells which probably diluted the nitrate and sulphate concentration. The impact of anthropogenic activities on groundwater quality, for instance, the higher sulphate concentration in water sources, has been traced to entry of agricultural runoff carrying unused sulphate [5] and leaching of sewage effluent into water systems [35]. This awareness could be applicable in this study because many of the wells were mostly shallow and hand-dug. Moreover, farming and livestock rearing are the agricultural lifeline of the residents of Akinyele and Lagelu communities. The subsequent high concentration of sulphate and nitrate in the well water sources may be resultant of the intensive farming activities where fertilisers containing either sulphate or nitrates or both were applied in the farm field.
One of the critical findings of this study is the detection of trace elements [Cd (0.12+0.03 mg/L) and Pb (0.83+0.23 mg/L)] that were above the permissible limits of 0.003 mg/L and 0.01 mg/L, respectively. It was further found that 21 (52.5%) of the well samples concurrently contained Cd, Cr and Pb during the dry season compared to 7 (17.5%) of the wells that contained the three heavy metals during the wet season. Overall, this observation is at variance with the low values of Cd and Pb (0.001 mg/L each) reported in a similar study carried out on boreholes sources in south-southern Nigeria [26]. However, the observation from the present study is in agreement with previous report [12] conducted in southeastern Nigeria that reported higher Cd values (1.03+0.16 mg/L) from borehole water samples.
Hydro-geochemical formations in the form of rock-water interactions may have also accounted for the presence of heavy metals in the well water sources [6-8]. Cadmium is found in rocks and soils, where it enters water when solubilised either by groundwater or surface water [5, 23]. Higher concentrations of heavy metals above safe limits are pertinent concerns because of their harmful effects on human health. Lead and cadmium are very toxic, even in small concentrations as they are capable of accumulating in the body tissue to cause diseases such as cancer, kidney failure and brain damage [30].
Overall, the quality of the well water sources found suitable for drinking were observed only at two points in Akinyele municipal area (Ojutaiye and Ori Eru) and at one point in Lagelu regions of Ibadan (Olorunda). The modest concentration of the estimated parameters in these three locations suggest that these water sources were fit for drinking and domestic purposes. However, in other regions, the situation was completely different as none of the sampled well water met the potability criteria using WQI.
The use of WQI through GIS to assess the quality of groundwater sources in the sub-urban Ibadan, Nigeria showed that more than 90% of the examined water sources were unfit for human consumption. The study indicates that greater percentage of the well water sources were not only acidic but also contained disproportionate amounts of NO3, SO4 and trace elements. The high amount of NO3, SO4 and even Cd pointed at natural phenomenon i.e. underground rock solubilisation and anthropogenic activities such as infiltration of fecal materials and agricultural runoffs as prime sources of these chemical contaminants in the water sources. The persistent deterioration of the water quality despite seasonal changes is a clarion call for prioritisation of clean water provision to residents in the affected settings without which sicknesses due to consumption of contaminated water may occur. Summarily, this study outline a situation report of the quality of groundwater in communities that rely on these sources for domestic purposes due to their non-connectivity to treated municipal water. A critical limitation of the study is the few number of well water samples that were examined in the course of the investigation. However, this study is considered cogent enough to inform public policy on provision of clean water to the residents while scaling up the investigation to include multiple physicochemical parameters.
This work was conducted as part of Akeem Ganiyu Rabiu’s PhD which benefited a Small Research Grant from the Thomas-Bassir Biomedical Foundation, University of Ibadan, Ibadan, Nigeria. We also thank Joseph Olumoyegun of the Cartography unit, Department of Geography, University of Ibadan for providing assistance in drawing the maps.
[1] Nazeer, S., Hashmi, M.Z., Malik, R.N. (2014). Heavy metals distribution, risk assessment and water quality characterization by water quality index of the River Soan, Pakistan. Ecological Indicators, 43: 262-270. https://doi.org/10.1016/j.ecolind.2014.03.010
[2] Aboh, E.A., Giwa, F.J., Giwa, A. (2015). Microbiological assessment of well waters in Samaru, Zaria, Kaduna State, Nigeria. Annals of African Medicine. https://doi.org/10.4103/1596-3519.148732
[3] Adesoji, A.T., Ogunjobi, A.A. (2016). Detection of extended spectrum β-lactamases resistance genes among bacteria isolated from selected drinking water distribution channels in southwestern Nigeria. BioMed Research International. http://dx.doi.org/10.1155/2016/7149295
[4] Kaplan, B.E.M., Jothikumar, N., Routh, J., Gómez, G.A., Mintz, E.D., Hill, V.R. (2017). Environmental survey of drinking water sources in Kampala, Uganda, during a typhoid fever outbreak. Applied and Environmental Microbiology, 83(23): 1706-1717. https://doi.org/10.1128/aem.01706-17
[5] Molekoa, M.D., Avtar, R., Kumar, P., Thu-Minh, H.V., Kurniawan, T.A. (2019). Hydrogeochemical assessment of groundwater quality of Mokopane area, Limpopo, South Africa using a statistical approach. Water, 1891(9). https://doi.org/10.3390/w11091891
[6] Avtar, R., Kumar, P., Surjan, A., Gupta, L., Roychowdhury, K. (2013). Geochemical processes regulating groundwater chemistry with special reference to nitrate and fluoride enrichment in Chhatarpur area, Madhya Pradesh, India. Environment and Earth Sciences, 70(4): 1699-1708. https://doi.org/10.1007/s12665-013-2257-7
[7] Kumar, P., Ram, A. (2013). Integrating major ion chemistry with statistical analysis for geochemical assessment of groundwater quality in the coastal aquifer of Saijo plain, Ehime prefecture, Japan. In: Water Quality: Indicators, Human Impact and Environmental Health, Nova Publication, Haryana, India, 99-108. https://doi.org/10.1016/j.desal.2011.11.017
[8] Minh, H.V.T., Avtar, R., Kumar, P., Tran, D.Q., Ty, T.V., Behera, H.C., Kurasaki, M. (2019). Groundwater quality assessment using Fuzzy-AHP in the Giang Province of Vietnam. Geosciences, 9(8): 330. https://doi.org/10.3390/geosciences9080330
[9] World Health Organisation, WHO (2006). Guidelines for Drinking-Water Quality, 3rd ed., Geneva, Switzerland.
[10] Momodu, M. A., Anyakora, C. A. (2010). Heavy metal contamination of groundwater: the Surulere case study. Environmental and Earth Sciences Research Journal, 2(1): 39-43.
[11] Alabi, A.A., Popoola, O.I., Olurin, O.T., Ogungbe, A.S., Ogunkoya, O.A., Okediji, S.O. (2020). Assessment of groundwater potential and quality using geophysical and physicochemical methods in the basement terrain of Southwestern, Nigeria. Environmental Earth Sciences, 79(14): 364. https://doi.org/10.1007/s12665-020-09107-y
[12] Nnorom, I.C., Ugochukwu, E., Sunday, O.E. (2019). Multivariate statistical approach and water quality assessment of natural springs and other drinking water sources in Southeastern Nigeria. Heliyon. https://doi.org/10.1016/j.heliyon.2019.e01123
[13] Canadian Council of Ministers of the Environment, CCME (2001). Canadian Water Quality Guidelines for the Protection of Aquatic Life: CCME Water Quality Index 1.0, User’s Manual. Winnipeg, Manitoba,Canada. https://doi.org/10.1016/j.watres.2012.03.061
[14] Ojelabi, S.A., Agbede, O.A., Wahab, B.A., Aiyelokun, O.A., Ojelabi, O.A. (2018). Water quality assessment of Eleyele Dam, Ibadan, South-Western, Nigeria. Civil and Environmental Research, 10: 52-59.
[15] Rabiu, A.G., Falodun, O.I., Fagade, O.E., Dada, R.A., Okeke, I.N. (2022). Potentially pathogenic Escherichia coli from household water in peri-urban Ibadan, Nigeria. Journal of water and health, 20(7): 1137-1149. https://doi.org/10.2166/wh.2022.117
[16] Tomori, M.A. (2008). Ibadan metropolitan area and the challenges to sustainable development.
[17] Ibadan population. (2020). World population review. https://worldpopulationreview.com/world-cities/ibadan-population, accessed on 10 September 2020.
[18] Areola, O. (1994). The spatial growth of Ibadan city and its impact on the rural hinterland. In: Filani, M.O., Akintola, F.O., Ikporukpo, C.O., eds., Ibadan Region, Rex Charles Publication, Ibadan, 72-84.
[19] United Nation Economic and Social Council, UNESC. (2017). Progress towards the Sustainable Development Goals: Report of the Secretary-General.
[20] American Public Health Association, APHA. (2005). Standard Methods for the Examination of Water and Wastewater, Washington DC, USA.
[21] Sawyer, C.N., McCarty, P.L., Parkin, C.F. (1994). Chemistry for Environmental Engineering. McGraw-Hill Inc., New York, USA.
[22] Rahmanian, N., Ali, S.H.B., Homayoonfard, M., Ali, N.J., Rehan, M., Sadef, Y., Nizami, A.S. (2015). Analysis of physicochemical parameters to evaluate the drinking water quality in the State of Perak, Malaysia. Journal of Chemistry. https://doi.org/10.1155/2015/716125
[23] Inoti, K.J., Kawaka, F., Orinda, G., Okemo, P. (2012). Assessment of heavy metal concentrations in urban grown vegetables in Thika Town, Kenya. African Journal of Food Sciences, 6: 41-46. https://doi.org/10.5897/ajfs10.072
[24] Nigerian Standard for Drinking Water Quality, NSDWQ. (2015). Standard Organisation of Nigeria: Nigerian Industrial Standard NIS, 554:1-28.
[25] World Health Organisation, WHO. (2011). Guidelines for Drinking Water Quality, 4th edition, Geneva, Switzerland.
[26] Emeka, C., Nweke, B., Osere, J., Ihunwo, C.K. (2020). Water quality index for the assessment of selected borehole water quality in Rivers State. Eur. Journal of Environmental Science, 1: 1-4. https://doi.org/10.24018/ejgeo.2020.1.6.101
[27] Meng, Q., Zhang, J., Zhang, Z., Wu, T. (2016). Geochemistry of dissolved trace elements and heavy metals in the Dan River Drainage (China): distribution, sources and water quality assessment. Environmental Science and Pollution Research, 23(8): 8091-8103. https://doi.org/10.1007/s11356-016-6074-x
[28] Bartier, P.M., Keller, C.P. (1996). Multivariate interpolation to incorporate thematic surface data using inverse distance weighting (IDW). Computers and Geosciences, 22: 795-799. https://doi.org/10.1016/0098-3004(96)00021-0
[29] Akter, N., Ishak, M.I.S., Ahmad, M.I., Umar, K., Yusuff, M.S., Anees, M.T., Qadir, A., Ali-Almanasir, Y.K. (2021). Modification of the water quality index (WQI) process for simple calculation using the Multi-Criteria Decision-Making (MCDM) Method: A Review. Water. https://doi.org/10.3390/w13070905
[30] Nta, S.A., Ayotamuno, M.J., Igoni. A.H., Okparanma, R.N., Udo, S.O. (2020). Determination of water quality index for the assessment of groundwater quality around Uyo refuse dump site. Umudike Journal of Engineering and Technology, 6: 49-54. https://doi.org/10.33922/j.ujet_v6i1_5
[31] Gebreselassie, K.G., Berhe, G.G., Tesfay, A.H., Gebre, S.E. (2021). Assessment of some physicochemical parameters and heavy metals in hand-dug well water samples of Kafta Humera Woreda, Tigray, Ethiopia. International Journal of Analytical Chemistry, (3): 1-9. https://doi.org/10.1155/2021/8867507
[32] Avery, A.A. (1999). Infantile methemoglobinemia: Reexamining the role of drinking water nitrates. Environmental Health Perspectives, 107: 583-586. https://doi.org/10.1289/ehp.99107583
[33] Guillette, L.J., Edwards, T.M. (2005). Is nitrate an ecologically relevant endocrine disruptor in vertebrates? Integrative and Comparative Biology, 45: 19-27. https://doi.org/10.1093/icb/45.1.19
[34] Nadimpalli, M.L., Marks, S.J., Montealegre, M.C., Gilman, R.H., Pajuelo, M.J., Saito, M., Tsukayama, P., Njenga, S.M., Kiiru, J., Swarthout, J., Islam, M.A., Julian, T.R., Pickering, A.J. (2020). Urban informal settlements as hotspots of antimicrobial resistance and the need to curb environmental transmission. Nature Microbiology, 5: 779-787. https://doi.org/10.1038/s41564-020-0722-0
[35] Adefisoye, M.A., Okoh, A.I. (2016). Identification and antimicrobial resistance prevalence of pathogenic Escherichia coli strains from treated wastewater effluents in Eastern Cape, South Africa. Open Microbiology, 5(1): 143-151. https://doi.org/10.1002/mbo3.319