Peng Lei | Qingyang Yu* | Boyu Du | Ziwei Xiong | Sibo Jia
© 2022 IIETA. This article is published by IIETA and is licensed under the CC BY 4.0 license (http://creativecommons.org/licenses/by/4.0/).
OPEN ACCESS
After subject to freeze and thaw cycles, tunnels will be damaged. To figure out such damage and its mechanism, this study carried out freeze-thaw cycle test to simulate the natural environment of tunnels, and took the physical properties of granite rocks sampled from the granite tunnels as the test parameters. In the test, the macroscopic changes of the rock samples before and after freeze-thaw cycles were observed, and the internal damages of the rock samples were analyzed. Then, this paper regarded freeze-thaw cycles as a type of low-cycle fatigue, and defined a damage variable based on the dynamic modulus of elasticity to study the fatigue damage model established for granite tunnels. At last, the comparison of the model simulation results and test results of granite tunnels proved the effectiveness of the proposed model in engineering practice.
tunnel, granite, freeze-thaw cycles, dynamic modulus of elasticity, fatigue damage
Frozen earth covers a vast area in north China, wherein seasonal frozen earth accounts for 54% and it will undergo freezing and thawing when the surface layer contains water, which brings more challenges to the maintenance and operation works of tunnels located in these areas [1]. Moreover, in some seasonal frozen earth areas, the severe environmental changes can exacerbate the mechanical functions of rock mass, thereby damaging the engineering materials and the structures. To cope with this problem, this paper aims to study the evolution law and mechanism of freeze-thaw damages of granite tunnels and build a freeze-thaw fatigue damage model for the said problem, thereby providing references for the design, construction, and maintenance of tunnel projects.
Rock damage refers to the process in which the properties of the rock gradually degrade under the impact of loads or external environment, the freeze-thaw damages of the rocks are caused by the repeated action of the internal stress of the rocks, and the representation of such damages is the expansion and development of micro cracks inside the rocks. Some fatigue damages occurred in rock samples can be explained by theories of damage concepts summarized in fatigue damage mechanics [2]. In theories about fracture and fatigue [3], materials are prone to brittle fracture when subjected to repeated cyclic stress, because there’re microcracks in the brittle materials themselves. Some scholars regard rocks as brittle materials and pointed out that the damages of rocks in seasonal frozen areas are essentially the fatigue damage, the freeze-thaw damage is the evolution process of internal fatigue damages caused by the development of internal micro cracks in rocks under different mechanisms [4]. Yang et al. [5] analyzed and defined the damages of rocks from macroscopic, microscopic, and mesoscopic perspectives, and clarified the mechanisms of damage mechanics from different angles. Zhang and Yang [6] employed the mesoscopic theories of damage mechanics to construct a model for rocks under repeated loads, defined a damage variable based on mechanics from a macroscopic point of view, and derived the damage equations; the results simulated by the proposed model were compared with the actual results, and the data were in good agreement. Zhou et al. [7] applied and removed loads repeatedly in the test and studied peak strength and other items of the curves attained in the test, and employed fracture mechanics to conclude that rocks are a kind of non-ductile brittle material, its macroscopic mechanical properties exhibited in the mesoscale test are the compaction and expansion process of cracks in the rocks. Field scholars in the world also discovered in their studies that [8-13], the temperature, temperature difference, and change speed of water-ice phase transition, the number of experienced freeze-thaw cycles, and the water content of rock surface all have significant impact on the material properties of the rock. The focus of current research on freeze-thaw damages of rocks is the deterioration of rock damages after subjected to multiple freeze-thaw cycles, however, the evolution process of the fatigue inside the rocks after subjected to freeze-thaw cycles is still unclear to us.
To fill in the research gap mentioned above, this study performed freeze-thaw fatigue damage test on granite tunnels, measured the physical properties of granite rock samples, observed the appearance of rock samples under different numbers of freeze-thaw cycles, and analyzed the expansion state of pores and cracks. Based on the dynamic modulus of elasticity, this paper derived the fatigue evolution equation that describes the freeze-thaw damages of rocks and built a fatigue damage model for granite tunnels, in the hopes of offering useful evidences for the monitoring and maintenance of tunnel projects.
2.1 Freeze-thaw cycle test of granite tunnel
2.1.1 Test plan for granite samples
Referring to the Standard for Tests Method of Engineering Rock Masses (GB/T 50266-99) [14], a test plan was formulated to ensure that the indoor state of rocks is close to the situation on spot as much as possible, details are given below:
(1) Select rock samples: the selected granite rock samples were cylinders with Φ=50 mm and h=100 mm as shown in Figure 1. (2) Dry rock samples: rock samples were placed in a drying oven at 120°C for 12 hours, the weights were measured every hour until the samples were dried to constant weight. (3) Saturate rock samples with water: screened rock samples were placed in a vacuum saturation machine to let rocks soak with water until saturated, the operation was lasted 4 hours until rock samples reached constant weight. (4) Perform indoor simulation test: temperature was set at -25°C to simulate average outdoor temperature in winter at the original site of the tunnels, the freeze-thaw cycle was set to 4h, after the temperature dropped to -25°C, the operation was lasted 2 hours; then, the temperature was increased to room temperature 20°C for a short time, the operation was lasted 2 hours as well, and this is called one cycle. (5) Measure physical parameters under different freeze-thaw cycles: after the cycle was repeated for 0, 5, 10, 20, 40, and 80 times, rock samples were observed; meanwhile the longitudinal wave velocity and porosity of the tested samples were measured as shown in Table 1, the test data were recorded in a table for analysis.
Figure 1. The selected rock samples
Table 1. Serial number of rock samples and use description
|
Number of freeze-thaw cycles |
Serial number of rock samples |
Description of processing and utilizing methods |
|
0 |
A00 |
No processing |
|
0 |
A01, A02, A03 |
Before and after subjected to specified numbers of freeze-thaw cycles, the mass, thermal conductivity, and longitudinal wave velocity were measured; each three samples were taken as a group to subject to the uniaxial test to get elastic modulus and other mechanical parameters. |
|
5 |
A11, A12, A13 |
|
|
10 |
A21, A22, A23 |
|
|
20 |
A31, A32, A33 |
|
|
40 |
A41, A42, A43 |
|
|
80 |
A51, A52, A53 |
|
|
0 |
A04 |
Before and after subjected to specified numbers of freeze-thaw cycles, the mass, thermal conductivity, and longitudinal wave velocity were measured; every sample was cut into 2 cylindrical samples with a diameter of 25 mm and a height of 40 mm, and their porosity and permeability were measured. |
|
5 |
A14 |
|
|
10 |
A24 |
|
|
20 |
A34 |
|
|
40 |
A44 |
|
|
80 |
A54 |
2.1.2 The appearance of rock samples before and after freeze-thaw cycles
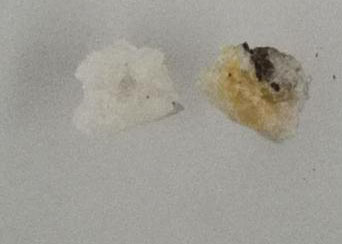
Before the test, the appearance of granite samples was observed and no abnormal state was found. After subjected to freeze-thaw cycles, part of the appearance of the granite samples was peeled off. Figure 2 shows the changes in the surface of granite rock samples. Figure 3 shows that the overall structure of the granite rock samples was severely damaged.
(a) Rock sample before the freeze-thaw test
(b) Rock debris peeled off after freeze-thaw cycles
(c) Rock particles fell off after freeze-thaw cycles
Figure 2. Photos of rock sample bottom before and after the freeze-thaw test
(a) Side view of rock sample before the test
(b) Rock particles fell off after freeze-thaw cycles
(c) Rock debris peeled off from the sample under freeze-thaw effect
(d) Rock particles fallen off from the sample under freeze-thaw effect
Figure 3. Rock debris and particles fallen off from the samples after freeze-thaw cycles
As can be seen from above photos, there’re rock debris and particles peeling off from the granite samples. The reason for this phenomenon is that as the ambient temperature of the rock decreases to the water-ice phase transition point, the volume of water increases during the freezing process, resulting in that the micro cracks inside the rock expand further.
2.2 The physical and mechanical properties of tunnel granite samples
The state of micro cracks inside the rock could be judged based on the longitudinal wave velocity, then the damage inside the rock and its development could be analyzed.
2.2.1 Longitudinal wave velocity of the rock
The data attained from the test are listed in Table 2, and Figure 4 shows the relationship between the number of freeze-thaw cycles and the longitudinal wave velocity.
The data belong to samples A51, A52, A53, and A54. After subjected to the required numbers of freeze-thaw cycles, in order to avoid test errors, the surface of the rock samples was kept clean, then the samples were placed in the same environment for 24h, and the values of the longitudinal wave velocity of the samples were measured.
According to the decreasing trend of the curve in Figure 4, it can be concluded that as the number of freeze-thaw cycles increases, the longitudinal wave velocity of the rock decreases.
Table 2. Test results of longitudinal wave velocity and number of freeze-thaw cycles of the rock
|
Number of freeze-thaw cycles |
0 |
5 |
10 |
20 |
40 |
80 |
|
Longitudinal wave velocity(m/s) |
4320 |
4110 |
4050 |
3910 |
3770 |
3560 |
Figure 4. The curve of longitudinal wave velocity of the rock
2.2.2 Porosity of the rock
This study adopted a gas method to measure the porosity of the tunnel granite samples [15], and the principles, equipment, and plan of the test were introduced. The rock porosity was represented by the ratio of the volume of pores in the rock to the volume of the rock surface, denoted as Φ.
To calculate rock porosity, at first, the rock volume Vf (cm3) should be measured; second, based on the attained data, calculate the volume of the rock skeleton Vg (cm3) using the Boyle's law; third, derive the equation of pore volume Vp (cm3) based on Vf and Vg:
$\varnothing=\frac{V_{p}}{V_{f}}=\frac{V_{f}-V_{g}}{V_{f}}=1-\frac{V_{g}}{V_{f}}$ (1)
According to the Boyle's law, under isothermal conditions, there are:
$V_{k} \times P_{k}=\mathrm{V} \times \mathrm{P}+V_{k} \times \mathrm{P}$ (2)
$\mathrm{V}=V_{k}\left(P_{k}-\mathrm{P}\right) / \mathrm{P}$ (3)
where, Vk (cm3) represents the volume of the measurement space; Pk (MPa) represents the pressure of the measurement space; V (cm3) represents unmeasured space volume; P (MPa) represents the balance pressure in the measurement space.
Under isothermal conditions, the volume of the low-pressure gas becomes larger:
$\mathrm{V}=V_{k}\left(\frac{P_{k}-P}{P}\right)+\left(\frac{P+P_{0}}{P}\right) \mathrm{G}\left(P_{k}-P\right)$ (4)
where, P0 (MPa) represents the atmospheric pressure where the tunnel project is located; G represents the pressure change parameter; when the data of Vk, G, and Pk are fixed, the volume to be measured can be calculated by measuring the value of P.
Similarly, the volume of rock skeleton can be determined with only two measurements. That is, the balance pressure P1(MPa) was attained when the rock sample cup was empty; the unmeasured space volume V1(cm3) is:
$V_{1}=V_{k}\left(\frac{P_{k}-P_{1}}{P_{1}}\right)+\left(\frac{P+P_{0}}{P_{1}}\right) \mathrm{G}\left(P_{k}-P\right)$ (5)
By subtracting Eq. (6) from Eq. (5), the volume of rock skeleton of the sample could be attained:
$V_{g}=V_{1}-V_{2}$ (6)
Different steel blocks with known volume were place into the rock sample cup, when measuring the balance pressure, the steel blocks were taken out from the cup, and their volume was denoted as Vsteel (cm3), then the volume of rock skeleton could be expressed as:
$V_{g}=V_{1}-V_{2}+V_{\text {steel }}$ (7)
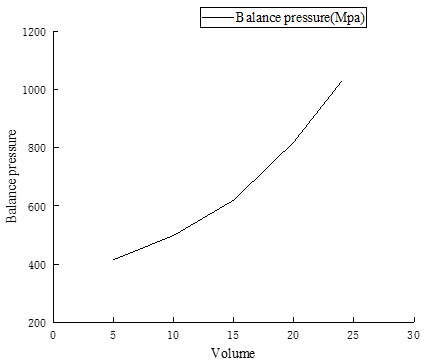
where, G and Vk could be attained from the curve shown in Figure 5, the curve was given by the test devices.
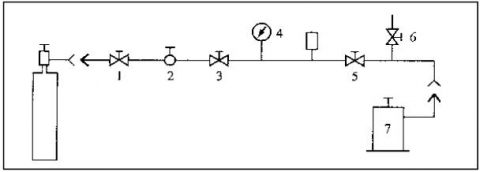
(1) Test devices
Helium cylinder; barometer; and gas porosity measuring instrument (shown in Figure 6).
The source rock samples are cut and renumbered as shown in Table 3. The porosity test results of the granite tunnel are shown in Table 4. The curve in Figure 7 gives the relationship between the number of freeze-thaw cycles and porosity.
Figure 5. The relationship between Balance pressure and Volume
Figure 6. Structure of the gas porosity measuring instrument
By analyzing the trend of the curve in Figure 7, we can see that as the freeze-thaw cycle continues, the porosity of granite samples grows gradually. The reasons for this increase in porosity are: (1) The water in pores inside the rock will gradually freeze, and the water-ice phase transition will generate a great stress which will make the pores and cracks develop; (2) When ice in pores melts into water, the migration of pore water will weaken the cementation effect between rock skeleton and the bonding force between particles, and aggravate the damages of the rock.
Table 3. Serial number of rock samples
|
Number of freeze-thaw cycles |
Serial number of original rock sample |
Serial number of rock sample after cutting |
|
0 |
A04 |
A0401 |
|
A0402 |
||
|
5 |
A14 |
A1401 |
|
A1402 |
||
|
10 |
A24 |
A2401 |
|
A2402 |
||
|
20 |
A34 |
A3401 |
|
A3402 |
||
|
40 |
A44 |
A4401 |
|
A4402 |
||
|
80 |
A54 |
A5401 |
|
A5402 |
Table 4. Porosity test results of granite tunnel
|
Serial number |
Volume (cm3) |
Balance pressure(kpa) |
Skeleton volume (cm3) |
Porosity (%) |
Average porosity (%) |
|
A0401 |
19.627 |
783.1 |
19.301 |
1.661 |
1.508 |
|
A0402 |
19.858 |
797.8 |
19.589 |
1.355 |
|
|
A1401 |
19.662 |
784.3 |
19.326 |
1.711 |
1.716 |
|
A1402 |
19.513 |
776.7 |
19.177 |
1.721 |
|
|
A2401 |
19.907 |
795.4 |
19.543 |
1.83 |
1.842 |
|
A2402 |
19.478 |
773.6 |
19.117 |
1.854 |
|
|
A3401 |
19.576 |
774.5 |
19.135 |
2.254 |
2.127 |
|
A3402 |
19.427 |
769.6 |
19.039 |
2.001 |
|
|
A4401 |
19.917 |
791.1 |
19.459 |
2.298 |
2.462 |
|
A4402 |
19.482 |
766.6 |
18.981 |
2.626 |
|
|
A5401 |
19.871 |
780.5 |
19.252 |
3.102 |
2.932 |
|
A5402 |
19.581 |
769.5 |
19.038 |
2.758 |
Figure 7. The Porosity of rock porosity
3.1 Rock freeze-thaw fatigue damage model
According to the relationship between physical parameters and the number of freeze-thaw cycles attained in the first chapter, the physical and mechanical parameters of rock samples all decreased with the increase of the number of freeze-thaw cycles. After subjected to 80 freeze-thaw cycles, it’s observed that the physical and mechanical parameters of the rock sample had decreased by more than 30% compared with those before the freeze-thaw cycles. Based on the relationship between the number of cyclic loadings experienced by the material before failure and the fatigue load stress, fatigue can be divided into low-cycle fatigue and high-cycle fatigue. In case of low-cycle fatigue, plastic deformation occurs to the material under each cyclic load, and in this process, the material’s yield stress is generally less than the cyclic load stress, and every freeze-thaw repetition will cause plastic deformation in the material. Thus, it’s concluded that in the freeze-thaw test, the repeated freeze-thaw cycles acted as a low-cycle fatigue effect on the granite.
3.1.1 Determination of damage variable
In order to make the results of the constructed fatigue damage model close to the on-site data, the damage variable was represented by the dynamic modulus of elasticity Ed (MPa), and the calculation equation of Ed is [16]:
$E_{d}=\frac{V_{\rho}^{2} \rho(1+\vartheta)(1-\vartheta)}{1-\vartheta}$ (8)
where, $\rho, V_{\rho}$, and $\vartheta$ respectively represent the density (kg/m3), the longitudinal wave velocity (m/s), and the Poisson's ratio of the rock samples.
Based on the dynamic modulus of elasticity of the rock, the damage variable could be expressed as:
$\mathrm{D}=1-\frac{E_{d}^{\prime}}{E_{d}}$ (9)
where, $E_{d}^{\prime}$ is the dynamic modulus of elasticity (MPa) after damage. Ignoring the changes of Poisson's ratio during the damage process, then by combining above equations, there is:
$\mathrm{D}=1-\frac{\vartheta}{v^{\prime}} \frac{V_{\rho}^{\prime 2}}{V_{\rho}^{2}}$ (10)
where, υ is the volume occupied by per unit mass of the rock under the initial state (m3). “ ’ ” represents the damage.
The increase of crack expansion inside the rock will increase the volume of the rock, then there are:
$v=v_{s}+v_{0}$ (11)
$v^{\prime}=v_{s}+v_{0}+\Delta v_{0}$ (12)
where, $v_{s}, v_{0}$, and $\Delta v_{0}$ are the mineral volume, crack volume, and crack volume change corresponding to per unit mass of the material, their units were all m3, then, the fracture degree $n_{0}$ before the damage process can be expressed as:
$n_{0}=\frac{v_{0}}{v}$ (13)
By combining Eqns. (10), (12), and (13), we can get:
$\mathrm{D}=1-\frac{1-n^{\prime}}{1-n_{0}} \frac{V_{\rho}^{\prime 2}}{V_{\rho}^{2}}$ (14)
According to Eq. (14), we can attain two parameters that are required for the calculation of the damage rate of the dynamic modulus of elasticity, namely the longitudinal wave velocity and the porosity.
3.1.2 The freeze-thaw fatigue evolution equation
To facilitate statistics, for the rock freeze-thaw fatigue damage model studied in this paper, the following assumptions were made:
(1) Under the action of freeze-thaw cycles, the freeze-thaw damages of granite are only caused by the frost-heave force;
(2) Under the action of freeze-thaw cycles, the freeze-thaw damages of granite distribute evenly inside the rock.
In the laboratory test, the expansion rate of damages in rock samples is:
$D^{\prime}=\left(\frac{Y}{X}\right)^{y} p^{\prime}$ (15)
where, $D^{\prime}, Y$, and $p^{\prime}$ respectively represent the rock fatigue damage expansion rate, the energy change rate, and the cumulative plastic strain rate; x and y are relevant parameters.
Under the condition that the force acts on one side, the free energy density φ of the material can be expressed as:
$\varphi=\frac{\sigma^{2}}{2 \rho E(1-D)}$ (16)
$\sigma$, ρ, and E respectively represent the axial stress (MPa), the density of the material (kg/m3), and the elastic modulus of the material (MPa).
Then the energy release rate of rock damages can be expressed as:
$\mathrm{Y}=\rho \frac{\partial \varphi}{\partial D}=\frac{1}{2 E}\left(\frac{\sigma}{1-\mathrm{D}}\right)$ (17)
When one freeze-thaw cycle is finished, the stress generated during the water-ice phase transition will promote the pores and cracks to develop, and meanwhile the water will enter the pores and cracks in the rock, the frost heave force generated in the water-ice phase transition process is greater, which will further expand the pores and cracks inside the rock, therefore, it can be concluded that granite has the feature of strain hardening.
The relationship between cumulative plastic strain and equivalent stress applied for one time is:
$\mathrm{p}=\left[\frac{\sigma}{\mathrm{J}(1-\mathrm{D})}\right]^{\gamma}$ (18)
where, e and E are parameters of the material.
The equation of cumulative plastic strain rate can be expressed as:
$p^{\prime}=e \frac{\sigma^{\prime} \sigma^{\gamma-1}}{J^{\gamma}(1-D)^{\gamma}}$ (19)
where, $\sigma^{\prime}$ represents the change rate of strain.
Then there is: $\Delta \sigma=\sigma_{\max }-\sigma_{\min }$.
As mentioned above, granite has the strain hardening property, so a hardening parameter h was introduced; N represents the number of freeze-thaw cycles; m and n are parameters of the material, then there is:
$\mathrm{h}=(\Delta \sigma)^{m} N^{n}$ (20)
After transformation, m, n, and λ are all material parameters, let J=hF and G=Fλ, then there is:
$p^{\prime}=\frac{e \sigma^{\prime} \sigma^{\gamma-1}}{G^{\gamma}(1-D)^{\gamma}(\Delta \sigma)^{m \gamma} N^{n \gamma}}$ (21)
Combining Eqns. (15), (17), and (21), there is:
$D^{\prime}=\frac{\sigma^{\prime} \sigma^{k-1}}{L(1-D)^{b}(\Delta \sigma)^{m \gamma_{N^{n \gamma}}}}$ (22)
where, k=e+2y, L$=\frac{G^{e}(2 E x)^{y}}{\theta}$.
$\int_{\mathrm{D}}^{\mathrm{D}+\frac{\delta \mathrm{D}}{\delta \mathrm{N}}} \mathrm{dD}=\int_{\sigma_{\min }}^{\sigma_{\mathrm{max}}} \frac{\sigma \sigma^{\mathrm{k}-1}}{\mathrm{LN}^{\mathrm{n} \gamma}(1-\mathrm{D})(\Delta \sigma)^{\mathrm{m} \gamma}} \mathrm{d} \sigma$, by integrating D, we can get:
$\int_{\mathrm{D}}^{\mathrm{D}+\frac{\delta \mathrm{D}}{\delta \mathrm{N}}} \mathrm{dD}=\int_{\sigma_{\min }}^{\sigma_{\max }} \frac{\sigma \sigma^{\mathrm{k}-1}}{\mathrm{LN}^{\mathrm{n} \gamma}(1-\mathrm{D})(\Delta \sigma)^{\mathrm{m} \gamma}} \mathrm{d \sigma}$ (23)
During the freeze-thaw cycles, the minimum value of frost-heave force is 0, namely $\sigma_{\min }$=0, through calculation and derivation, we can get:
$\frac{\mathrm{dD}}{\mathrm{dN}}=\frac{2 \sigma_{\mathrm{max}}^{\mathrm{k}}}{\operatorname{Lm} \alpha(\Delta \sigma)^{\mathrm{m} \gamma_{N^{\mathrm{n}} \gamma}(1-\mathrm{D})^{k}}}$ (24)
During the alternation of freezing and thawing, the frost-heave force didn’t change much, that is, $\sigma_{\max }$ didn’t change; meanwhile, the range of damage variable D could be expressed as:
$\mathrm{D}=\left\{\begin{array}{c}0(N=0) \\ 1\left(N=N_{d}\right)\end{array}\right.$ (25)
where, Nd represents the number of freeze-thaw cycles experienced by granite until its structure fails, then the equation of freeze-thaw fatigue evolution can be attained by introducing Nd and integrating:
$\mathrm{D}=1-\left[1-\left(\frac{N}{N_{d}}\right)^{1-n \gamma}\right]^{\frac{1}{k+1}}$ (26)
Then, the equation of the low-cycle evolution of the rock could be attained, if n$\gamma$=0, then it represents the equation of the high-cycle evolution of the rock.
3.2 The fatigue damage model of granite tunnel
This paper adopted a theoretical equation method for the value assignment of Nd [16, 17]. To judge the criterion of rock structure failure, this paper quoted the criterion that the rock structure is considered failed when the loss of dynamic modulus of elasticity of the concrete material reaches 40%. The linear interpolation method could attain the number of freeze-thaw cycles experienced by the rock when the rock structure fails. According to the physical parameters of tunnel granite shown in Table 5, when the rock had experienced 40 and 80 freeze-thaw cycles, $N_{d}$=130.
$D=1-\left[1-\left(\frac{N}{N_{d}}\right)^{1-n \gamma}\right]^{\frac{1}{k+1}}$
$=1-\frac{1-V_{\rho}^{12} n^{1}}{1-V_{\rho}^{2} n_{0}}$ (27)
Table 5. Physical parameters of granite tunnel
|
Number of freeze-thaw cycles |
Longitudinal wave velocity $\boldsymbol{V}_{\rho}$ (m/s) |
Porosity (%) |
Damage variable D |
|
0 |
4320 |
1.506 |
0 |
|
5 |
4110 |
1.715 |
0.078 |
|
10 |
4050 |
1.842 |
0.114 |
|
20 |
3910 |
2.216 |
0.177 |
|
40 |
3770 |
2.461 |
0.249 |
|
80 |
3560 |
2.932 |
0.318 |
Parameters to be determined are k and $n \gamma$. Let $\mu=1-\gamma$, fitting was performed, the data in Table 5 were substituted into Eq. (27), then there are:
${\left[1-\left(\frac{0}{130}\right)^{x}\right]^{y}=1.000 }$
${\left[1-\left(\frac{5}{130}\right)^{x}\right]^{y}=0.921 }$
${\left[1-\left(\frac{10}{130}\right)^{x}\right]^{y}=0.885 }$
${\left[1-\left(\frac{20}{130}\right)^{x}\right]^{y}=0.821 }$
$\left[1-\left(\frac{40}{130}\right)^{x}\right]^{y}=0.750$ (28)
$\left[1-\left(\frac{80}{130}\right)^{x}\right]^{y}=0.681$ (29)
Fitting was performed in MATLAB to attain the optimal solution, for the values of k and μ, there is:
$\mathrm{D}=1-\left[1-\left(\frac{N}{130}\right)^{0.4746}\right]^{1.0086}$ (30)
Through equation derivation, we can get:
The parameters k and nγ in Eq. (31) are related to the material; also, it is observed from Eq. (30) that the values of k and nγ are not related to $N_{d}$. By substituting different $N_{d}$ values, the fatigue damage evolution equation could be attained as:
$\mathrm{D}=1-\left[1-\left(\frac{N}{130}\right)^{0.4746}\right]^{1.0086}$
$\left(N_{d}=130\right)$ (31)
$\mathrm{D}=1-\left[1-\left(\frac{N}{130}\right)^{0.4746}\right]^{1.0086}$
$\left(N_{d}=145\right)$ (32)
$\mathrm{D}=1-\left[1-\left(\frac{N}{130}\right)^{0.4746}\right]^{1.0086}$
$\left(N_{d}=160\right)$ (33)
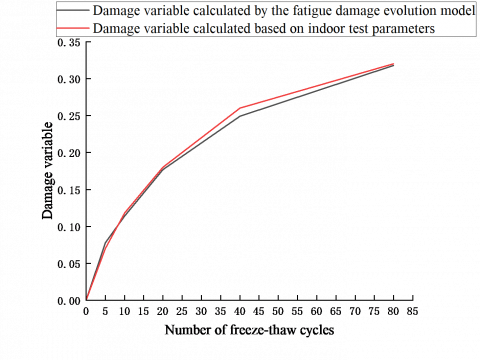
This is shown in Figure 8 comparison of model simulation results and actual results showed that they were in good agreement, which had verified the effectiveness of the proposed granite tunnel freeze-thaw fatigue damage model.
Figure 8. Comparison of model simulation results and test results
(1) In the freeze-thaw cycle test of granite rock samples, with the increase of the number of freeze-thaw cycles, peeled debris and particles were found in the observation of the appearance of rock samples; moreover, the longitudinal wave velocity gradually decreased, and the porosity gradually increased; analysis also showed that the damages inside the rock were aggravated gradually.
(2) By re-determining the damage variable and deriving the equation of freeze-thaw fatigue evolution of granite tunnel, the granite tunnel freeze-thaw fatigue damage model was attained. At last, the model simulation results of rock damage variable were found in good agreement with the results attained from indoor test, which had verified the correctness and practicability of the proposed model.
[1] Ma, W., Wang, D.Y. (2012). Studies on frozen soil mechanics in China in past 50 years and their prospect. Chinese Journal of Geotechnical Engineering, 34(4): 625-640.
[2] Lemaitre, J., Dufailly, J. (1987). Damage measurements. Engineering Fracture Mechanics, 28(5-6): 643-661. https://doi.org/10.1016/0013-7944(87)90059-2
[3] Cheng, Y.S., Huang, Y.B. (1988). Measurement of continuous damage parameter. Engineering Fracture Mechanics, 31(6): 985-992. https://doi.org/10.1016/0013-7944(88)90209-3
[4] Zhang, H.M., Xia, H.J., Yang, G.S., Zhang, M., Peng, C., Ye, W.J., Shen, Y.J. (2018). Experimental research of influences of freeze-thaw cycles and confining pressure on physical-mechanical characteristics of rocks. Journal of China Coal Society, 43(2): 441-448. https://doi.org/10.13225/j.cnki.jccs.2017.0098
[5] Yang, G., Shen, Y., Jia, H., Wei, R., Zhang, H., Liu, H. (2018). Research progress and tendency in characteristics of multi-scale damage mechanics of rock under freezing-thawing. Chin. J. Rock Mech. Eng., 37(3): 545-563. https://doi.org/10.13722/j.cnki.jrme.2017.1295
[6] Zhang, H.M., Yang, G.S. (2013). Experimental study of damage deterioration and mechanical properties for freezing thawing rock. Journal of China Coal Society, 38(10): 1756-1762.
[7] Zhou, J.W., Yang, X.G., Fu, W.X., Xu, J., Li, H.T., Zhou, H., Liu, J. (2010). Experimental test and fracture damage mechanical characteristics of brittle rock under uniaxial cyclic loading and unloading conditions. Chinese Journal of Rock Mechanics and Engineering, 29(6): 1172-1183.
[8] Yavuz, H., Altindag, R., Sarac, S., Ugur, I., Sengun, N. (2006). Estimating the index properties of deteriorated carbonate rocks due to freeze–thaw and thermal shock weathering. International Journal of Rock Mechanics and Mining Sciences, 43(5): 767-775. https://doi.org/10.1016/j.ijrmms.2005.12.004
[9] Momeni, A., Abdilor, Y., Khanlari, G.R., Heidari, M., Sepahi, A.A. (2016). The effect of freeze–thaw cycles on physical and mechanical properties of granitoid hard rocks. Bulletin of Engineering Geology and the Environment, 75(4): 1649-1656. https://doi.org/10.1007/s10064-015-0787-9
[10] Ghobadi, M.H., Babazadeh, R. (2015). Experimental studies on the effects of cyclic freezing-thawing, salt crystallization, and thermal shock on the physical and mechanical characteristics of selected sandstones. Rock Mechanics and Rock Engineering, 48(3): 1001-1016. https://doi.org/10.1007/s00603-014-0609-6
[11] Al-Omari, A., Brunetaud, X., Beck, K., Al-Mukhtar, M. (2014). Effect of thermal stress, condensation and freezing-thawing action on the degradation of stones on the Castle of Chambord, France. Environmental Earth Sciences, 71(9): 3977-3989. https://doi.org/10.1007/s12665-013-2782-4
[12] Zhou, Z., Xing, K., Yang, H., Wang, H. (2019). Damage mechanism of soil-rock mixture after freeze-thaw cycles. Journal of Central South University, 26(1): 13-24. https://doi.org/10.1007/s11771-019-3979-9
[13] Fang, W., Jiang, N., Luo, X. (2019). Establishment of damage statistical constitutive model of loaded rock and method for determining its parameters under freeze-thaw condition. Cold Regions Science and Technology, 160: 31-38. https://doi.org/10.1016/j.coldregions.2019.01.004
[14] Standard for Test Methods of Engineering Rock Mass GB/T 50266-2013. 2013.01.28.
[15] Liu, B., Yao, S.P., Hu, W.X., Cao, J., Xie, D.L. (2017). Application of nuclear magnetic resonance cryoporometry in unconventional reservoir rocks. Acta Petrolei Sinica, 38(12): 1401-1410. https://doi.org/10.7623/syxb201712007
[16] Liu, Q.S., Huang, S.B., Kang, Y.S., Hunag, X. (2015). Fatigue damage model and evaluation index for rock mass under freezing-thawing cycles. Chinese Journal of Rock Mechanics and Engineering, 34(6): 1116-1127. https://doi.org/10.13722/j.cnki.jrme.2014.1189
[17] Jia, H.L., Liu, Q.B., Xiang, W., Zhang, W., Lang, L. (2013). Damage evolution model of saturated sandstone under freeze-thaw cycles. Chinese Journal of Rock Mechanics and Engineering, 32(S2): 3049-3055.