Adeseko A. Adebowale* | Bolarinwa T. Anthony
© 2022 IIETA. This article is published by IIETA and is licensed under the CC BY 4.0 license (http://creativecommons.org/licenses/by/4.0/).
OPEN ACCESS
The aim of this study is to determine the source area weathering and provenance of a residual clay samples overlying Precambrian basement complex in Southwestern, Nigeria. Fifteen representative clay samples were collected from three pits dug in three locations across the study area. The mineralogy and chemical composition of samples was analyzed using X-ray diffractometer (XRD) and inductively coupled plasma-mass spectrometer (ICPMS) techniques respectively. The results of mineralogical analyses indicates that kaolinite (1.4%) and nontronite (2.77%) are the major clay minerals present while the non-clay minerals include quartz, orthoclase, labradorite and albite. Chemical indices of alteration (CIA) and weathering (CIW) values of 76.02% and 89.9% respectively, low alkali and alkaline earth elements content derived from the samples implies a comparatively intense source area. Furthermore, plots of TiO2/Al2O3 indicate provenance of predominantly acidic rocks and high concentrations of Rubidium (Rb) and Strotium (Sr) in the samples with values ranging from 113.4-138.2 ppm and 218.3-229.2 ppm respectively suggests ongoing chemical weathering of the clay body. The findings from this research through mineralogical composition, rare earth elemental normalized patterns, and ternary diagrams plotted implies that these samples are derived from felsic sources.
acidic rocks, chemical indices, clay body, mineralogy, ternary diagrams, source area
Clay mineralogy and concentration of chemical elements play a significant role in provenance studies [1-7]. Rare earth and trace element constituents in igneous and metamorphic rocks are employed both to predict the nature of the source materials, thereby providing information about their chemical and mineral composition [8-11]. Chemical make-up of various weathering products significantly depends on weathering rates which underscores numerous mobile elements during weathering, consequently evaluating prevailing chemical weathering conditions [12]. The elimination from solution of calcium (Ca), sodium (Na), and potassium (K) preferentially in the course of weathering because of their mobility means that these factors with respect to elements that are not easily removed provides a means in provenance to evaluating the level of chemical weathering [13].
Weathering profiles on natural rocks have been recommended by some authors such as chemical index of alteration (CIA) proposed by Nesbitt and Young [14] which is interpreted as a conversion degree indicator for some feldspar group of rock-forming minerals to clay minerals like kaolinite. Meanwhile, Harnois [15] proposed a modification on CIA which was known as chemical index of weathering (CIW) which removed completely K2O from the equation of chemical index of alteration.
Even though several researchers [16-22] have studied residual clay deposits especially in the Precambrian basement complex of Nigeria predominantly by evaluating their clay mineralogy, physicochemical properties as well as their geochemical characteristics for industrial suitability. However, there are limited publications on provenance studies and weathering history of these residual clay especially in the tropical forest belt area using rare earth and trace element geochemistry. This article aims to examine the major geochemistry, rare-earth and trace elements distribution of a residual clay in the basement complex rock of south western Nigeria in order to determine the weathering history and provenance.
The remainder of this paper is organized as follows: Section 2 introduces location and geological setting of the study area, Section 3 describes the sampling and the methods in this research, Section 4 presents the results conducted in the study, Section 5 discusses the analyses and implications of the results, and Section 5 entails the concluding part of the research and recommendations.
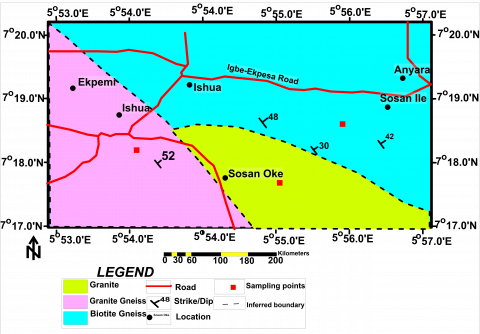
The study area lies within the Precambrian basement complex of Nigeria which is situated within the Pan-African mobile belt of West Africa and Congo Craton. This area falls between latitudes 7° 25´ N to 7° 32´ N and longitudes 5° 53´ E to 5° 58´ E and is accessible by roads and footpaths, Figure 1. The terrain is gently undulating and few areas of the landscape can be viewed at a glance because of thick vegetation. The three major lithologies mapped based on field observation consists of mixed suits of granites, granite gneisses and biotite gneisses. The biotite gneisses occupy the western part of the study area where they form ridges and undulating highland at the west end of the area. The granite gneisses occur as massive and extensive bodies trending from part of the north-west end and to the north-east end, representing about 50% of the entire study area. They outcropped as domes and high hills. They are leucocratic, medium-coarse grained and are partially weathered. Granites, on the other hand occurs as low lying bodies but partly buried with overburden and covers about 15% of the study area. This area is situated in the tropical rainforest belt of the country.
Figure 1. Geological map of the study area
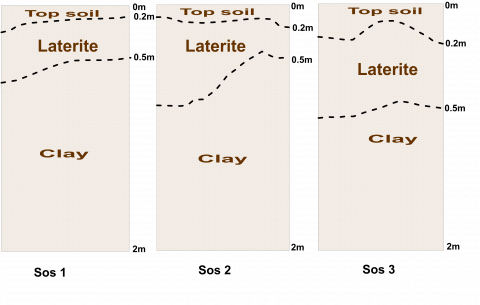
The fieldwork in this study entails collection of fifteen clay samples out of which twelve representative samples were subjected to analyses and test. The samples were collected from pits dug in three different locations across the study area of about 2-meter depth profile using point sampling method. Five clay samples were collected in each pit at 0.3 m sampling intervals and were put in sample bags and labeled appropriately in Figure 2. The scope and method of investigation include geological filed studies and collection of samples. The samples were subsequently air dried for several days after which they are disaggregated using a rubber headed pestle in an agate mortar. The pulverization of samples was done before being packaged and sent for clay mineralogy and chemical analysis. Clay mineralogy was undertaken using the x-ray diffraction technique (XRD). The XRD include those in the bulk analyses, the clay fraction, ethylene glycol and heat treated (600℃) clay fraction. Representative samples of the different locations were evaluated and interpreted through reference and comparison with standard powder data and diagnostic patterns of appropriate minerals. The data obtained were interpreted. This data was obtained from Joint Committee on Powder Diffraction Studies [23] (JCPDS), and the x-ray diffraction files by Chen [24]. Powder data files are tabulated in 2θ values (lattice spacing) expressed in Armstrong units (A) using reference conversion tables. The peak intensities were tabulated against the 2θ values. Powdered samples of the clay were analyzed using a Phillips-PW1800 model. Diffraction charts were recorded at a scanning rate of 1°2θ/min/cm, with a Ni-filtered Cu K-alpha radiation. Inductively coupled plasma spectrometer (ICP-MS) method was utilized to determine major and trace element composition. These two analyses were conducted in ACME analytical laboratory in Vancouver, Canada.
Figure 2. Sampling profile of clay samples from the study area
4.1 Mineralogical composition
Mineralogical composition of the clay samples studied are presented in Table 1. The Mineralogical data revealed Nontronite and Kaolinite as the major clay minerals present in the samples. The diffractograms indicated an abundance of quartz as the major non-clay mineral. Other non-clay minerals include orthoclase, labradorite and albite in lesser amounts Table 1.
Table 1. The mineralogical composition of Sosan clay
|
MINERALS |
Percentage (%) |
|
Kaolinite |
1.44 |
|
Nontronite |
2.77 |
|
Labradorite |
4.92 |
|
Quartz |
83.27 |
|
Orthoclase |
3.78 |
|
Albite |
2.81 |
4.2 Geochemical Composition
Major elements concentration of Sosan clay samples is presented in Table 2.
Table 2. Average chemical composition (weight %) of Sosan clay
|
Oxides (%) |
Mean (%) |
Range (%) |
|
SiO2 |
58.03 |
53.10-63.40 |
|
Al2O3 |
13.38 |
13.72-17.22 |
|
Fe2O3 |
7.66 |
7.15-8.00 |
|
MnO |
0.04 |
0.04-0.05 |
|
MgO |
0.83 |
0.55-1.12 |
|
Na2O |
0.70 |
0.67-0.72 |
|
K2O |
2.72 |
2.31-3.19 |
|
TiO2 |
1.50 |
1.35-1.67 |
|
P2O5 |
0.03 |
0.02-0.04 |
|
CaO |
0.80 |
0.66-0.92 |
|
LOI |
11.84 |
8.90-14.60 |
|
CIA |
79.43 |
73.5-81.1 |
|
CIW |
90.84 |
88.1-91.6 |
|
RBL |
2.65 |
2.45-3.40 |
|
(La/Yb)cn |
12.75 |
12.02-57.01 |
Major elements as weight percentage (wt.) % and Relative base loss (RBL) = Al2O3/CaO+MgO+NA2O+K2O and TIO2/Zn X 100
The results revealed predominance of SIO2, Al2O3 and Fe2O3, SiO2 values from (53.10-63.40%), Al2O3 (13.72-17.22%), Fe2O3 (7.15-8.00%), K2O (2.31-3.19), TiO2 (1.35-1.67%) while Na2O, CaO, MgO, P2O5 and Cr2O5 all have values less than 1%. The predominance of SiO2 and Al2O3 which constitute the bulk chemical composition of the Sosan clay is in line with its classification as hydrated aluminum silicates.
5.1 Mineralogy
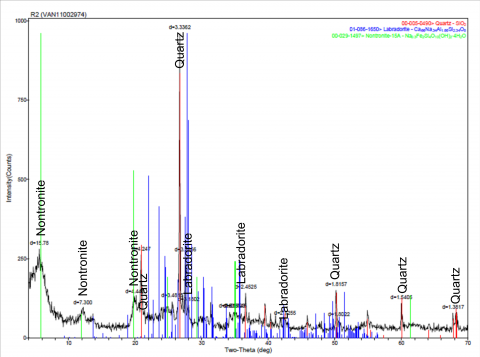
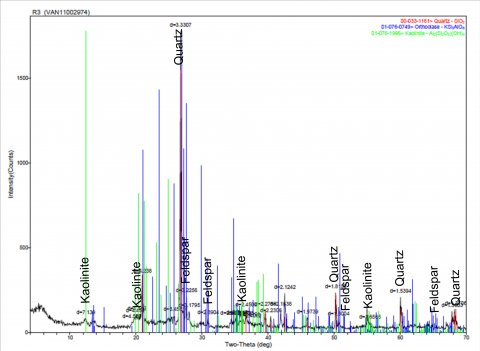
Conspicuous kaolinite and Nontronite peaks reflected at 7.13A and 15.76A respectively while Quartz peaks are identified at 4.2A, 3.33A and 1.81A in Figures 3, 4 and 5 respectively.
Figure 3. Diffractogram of the clay sample of SOS 1
Figure 4. Diffractogram of the clay sample of SOS 2
Figure 5. Diffractogram of the clay sample of SOS 3
The mineralogical data of the whole sample using the peak height ratio analysis indicate that the sample is composed of about 83.27% Quartz, 1.4% kaolinite and 2.77% nontronite and iron-rich montmorillonite clay of the smectite group, as showing Table 1.
5.2 Whole rock geochemistry
Major element abundances of calculated average values for SiO2 (58.03%), Al2O3 (13.38%) and Fe2O3 (7.66%) represents more than 70% of the bulk chemical compositions (Table 2) while CaO, MgO, Na2O, K2O, MnO, TiO2 and P2O5 have lower values. The high value of Fe2O3 (7.66%) is in likelihood due to tropical weathering and the lateritic horizon overlying the clay samples (Figure 2). the K2O average composition of 2.72% indicates that feldspar has not been intensely weathered. The CIA and CIW values of 76.02% and 89.9% respectively suggests a felsic source and also implies a recycling process [17]. These indexes value indicates high (intensive) weathering of the source rocks as reported in the studies [25, 26] that values of weathering indices more than 70% indicates weathering that is intensively high either at the source or during transportation before deposition.
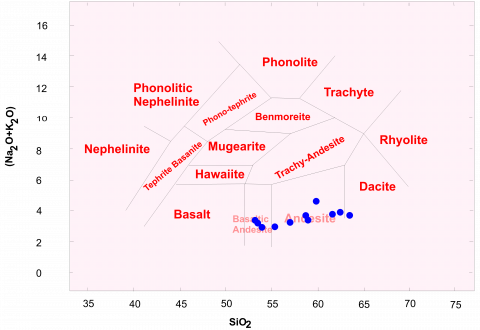
Figure 6. Discrimination diagram of the clay samples
Figure 7. Relationship between SiO2 and K2O content
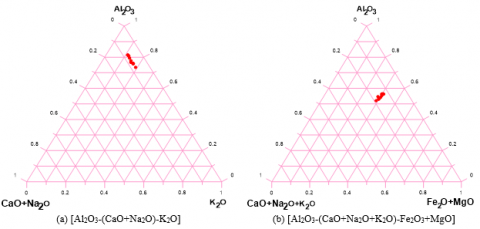
The plots of SiO2 against K2O + Na2O revealed the rock from where the clay weathered falls within the zone of basaltic andesites and andesites rocks (Figure 6). The plot of SiO2 and K2O variations which was based on the classification by Wronkiewicz and Condie [27] indicated that the clay samples/minerals fall within the zone of high-K Calc-Alkaline series (Figure 7). The presence of detrital orthoclase feldspar, albite and labradorite (rock-forming minerals) as revealed in the mineralogical data suggests that the clay samples has not yet reach maturity. Moderate chemical conditions are favorable for smectite mineral generation as it is evident in the low kaoloinite and smectite clay minerals present in the study area. However, high abundant quartz and presence of kaolinite probably suggests that the clay samples derived from felsic sources. The moderately low base loss (RBL) value (2.65%) in the clay samples is attributed to its siliceous nature because such mobile cations loss and enrichment of clay is characteristic of clays that form in tropical and sub-tropical environments. The high concentrations of rubidium (Rb) and Strontium (Sr) in the clay samples with values ranging from 113.4-138.2 ppm and 218.3-229.2 ppm respectively suggests ongoing chemical weathering. Major elements, trace and rare earth elemental composition of the studied clay samples are presented on Tables 2, 3 and 4 respectively. There exists some sort of relationship between alkaline and alkali earth elements like calcium, sodium, potassium and magnesium during alteration of igneous rocks in the course of weathering. They both tend to deplete which leads to the enrichment of Al2O3 [14]. The clay samples plot in a region close to high Al2O3 contents in Figures 8a, b which indicates a comparatively high intensity. It seems that weathering has progressed to a significant stage by the removal of alkaline and alkali earth elements from the sediments.
Figure 8. Ternary plot of the studied clay samples
Table 3. Composition of elements from clay samples in Sosan, Southwestern, Nigeria
|
Elements (ppm) |
SOS 1 |
SOS 2 |
SOS 3 |
SOS 4 |
SOS 5 |
SOS 6 |
SOS 7 |
SOS 8 |
SOS 9 |
SOS 10 |
SOS 11 |
SOS 12 |
|
Ba |
1023 |
1180 |
1012 |
863 |
842 |
1117 |
1115 |
1192 |
938 |
1019 |
1154 |
979 |
|
Co |
10.6 |
9.4 |
17.3 |
17.0 |
17.5 |
12.2 |
12.5 |
10 |
17.2 |
14.9 |
11.3 |
16.1 |
|
Ce |
53.8 |
55.4 |
594.7 |
200.8 |
199.8 |
93.6 |
85.4 |
54.6 |
397.4 |
146.7 |
70 |
272.1 |
|
Ga |
19.7 |
18.5 |
28.5 |
24.5 |
23.7 |
21.6 |
21.7 |
19.1 |
26.5 |
22.7 |
21.7 |
20.4 |
|
Hf |
21.5 |
18.5 |
12.5 |
18.3 |
10.8 |
20.2 |
18.5 |
20.1 |
15.4 |
15.5 |
19.3 |
15.5 |
|
Nb |
33.6 |
33.8 |
34.4 |
30.9 |
28.6 |
34.7 |
32.9 |
33.7 |
32.7 |
31.7 |
33.3 |
32.2 |
|
Yb |
1.88 |
1.76 |
9.03 |
4.07 |
3.92 |
2.39 |
2.20 |
1.82 |
6.55 |
3.16 |
2.10 |
4.86 |
|
Pr |
6.49 |
6.51 |
196.2 |
32.33 |
32.10 |
13.16 |
12.11 |
6.50 |
114.27 |
22.63 |
9.31 |
68.45 |
|
Rb |
123.2 |
113.4 |
138.2 |
135.0 |
127.6 |
125.3 |
126.1 |
118.3 |
136.6 |
126.5 |
122.2 |
131.6 |
|
Sc |
9 |
9 |
14 |
14 |
13 |
11 |
10 |
14 |
9 |
12 |
10 |
11 |
|
Sr |
222.5 |
218.3 |
229.2 |
198.7 |
192.2 |
229.5 |
221.1 |
221.9 |
213.9 |
210.9 |
221.5 |
212.4 |
|
Th |
18.9 |
16.9 |
28.4 |
26.7 |
27.1 |
23.8 |
26.2 |
17.9 |
27.6 |
25.5 |
22.1 |
26.6 |
|
U |
4.4 |
4.1 |
3.3 |
3.2 |
3.5 |
4.7 |
5.2 |
4.3 |
3.3 |
4.1 |
4.8 |
3.7 |
|
V |
113 |
102 |
118 |
108 |
92 |
91 |
86 |
108 |
113 |
92 |
97 |
103 |
|
Nd |
21.3 |
20.9 |
701.7 |
117.7 |
112.2 |
44.1 |
39.7 |
21.1 |
406.7 |
78.2 |
30.4 |
242.5 |
|
Zr |
902.9 |
752.3 |
468.0 |
780.3 |
410.5 |
804.1 |
760.6 |
827.6 |
624.2 |
607.3 |
794.1 |
615.8 |
|
Cs |
1.8 |
1.7 |
2.7 |
2.3 |
2.4 |
2.2 |
2.1 |
1.8 |
2.5 |
2.3 |
1.9 |
2.4 |
|
La |
33.5 |
33.9 |
763.6 |
143.5 |
144.6 |
63.0 |
61.8 |
33.7 |
453.6 |
103.8 |
47.8 |
278.7 |
|
Sm |
3.52 |
3.37 |
113.7 |
17.93 |
18.25 |
7.18 |
6.58 |
3.45 |
65.82 |
12.72 |
5.02 |
39.27 |
|
Y |
15.7 |
13.4 |
182.8 |
51.8 |
52.9 |
24.0 |
23.3 |
14.6 |
117.3 |
38.5 |
18.9 |
77.9 |
|
La/Sc |
3.72 |
3.77 |
54.54 |
10.25 |
11.12 |
5.73 |
6.18 |
2.41 |
50.4 |
8.65 |
4.78 |
25.34 |
|
La/Th |
1.77 |
2.01 |
26.89 |
5.37 |
5.34 |
2.65 |
2.36 |
1.88 |
16.43 |
4.07 |
2.16 |
10.48 |
|
Th/sc |
2.1 |
1.88 |
2.03 |
1.91 |
2.08 |
2.16 |
2.62 |
1.28 |
3.07 |
2.13 |
2.21 |
2.42 |
|
La/Yb |
17.82 |
19.26 |
84.96 |
35.26 |
36.89 |
26.36 |
28.09 |
18.52 |
69.25 |
34.85 |
22.76 |
57.35 |
|
Eu/Eu* |
0.82 |
0.84 |
0.80 |
0.77 |
1.17 |
0.83 |
0.78 |
0.83 |
0.80 |
0.75 |
0.80 |
0.79 |
|
(La/Yb)cn |
12.02 |
12.98 |
57.01 |
23.77 |
24.87 |
17.77 |
18.94 |
12.49 |
46.7 |
22.16 |
15.35 |
38.66 |
Table 4. Clay element ratio ranges in this study in comparison with related fractions resulting from mafic, felsic rocks and UCC
|
Elemental ratios |
Sosan Akoko Claya |
Range of sedimentsb Felsic rocks Mafic rocks |
Upper continental crust (UCC)c |
Post-Archean average shalec (PASS) |
|
|
Th/Sc |
1.28-3.07 |
0.84-20.5 |
0.05-0.22 |
0.79 |
0.9 |
|
Th/Co |
1.55-2.09 |
0.67-19.4 |
0.04-1 |
0.63 |
0.63 |
|
La/Sc |
2.41-11.12 |
2.5-16.3 |
0.43-0.86 |
2.21 |
2.4 |
Note: a This study; b [28], [29]; c [30].
5.3 Trace element geochemistry
Figure 9. UCC normalized for trace elements of clay samples from the study area
Source: modified after [31]
Table 5. Average trace element chemical composition (in ppm) in comparison with some world standards
|
Elements (ppm) |
Sosan Clay |
PASS |
NASC |
UC |
|
As |
- |
- |
- |
- |
|
Ba |
1036.16 |
650.00 |
636.00 |
550 |
|
Sr |
216.01 |
200.00 |
142.00 |
350 |
|
Ni |
- |
55.00 |
58.00 |
- |
|
Co |
13.83 |
23.00 |
25.7 |
10 |
|
Cu |
- |
50.00 |
- |
- |
|
Zn |
39.17 |
85.00 |
- |
71 |
|
V |
101.92 |
150.00 |
130.00 |
60 |
|
Zr |
695.64 |
210.00 |
200.00 |
190 |
|
Mo |
- |
- |
- |
- |
|
Nb |
32.71 |
1.90 |
13 |
25 |
|
Pb |
10.95 |
20.00 |
- |
15.0 |
|
Rb |
127 |
160.00 |
125 |
110.2 |
|
Th |
23.98 |
14.60 |
12.3 |
10.7 |
|
U |
4.04 |
3.10 |
2.66 |
2.8 |
The clay samples revealed that Co, Nb, Rb, Th, Sr, Zr and Ba contents are similar to and in some cases higher compared to Average North America shale (NASC), Post-archean average shale (PASS) and Upper continental crust (UCC) values (Table 5). However, the contents of Pb, V and Zn in the samples have low values compared to NASC, PASS and UCC. The low values of these elements even though they are commonly associated with clay minerals could be ascribed to the high contents of quartz mineral as well as the parent rock, (Tables 1, 2 and 3). This corroborates with the submissions of [17, 32] and [33] of the selective leaching of small cations like sodium, calcium, and strontium from weathering sequence, while cations with comparatively large ion radii such as potassium, Cesium, Rubidium and Barium may be fixed by preferential interchange and clay absorption. Consequently, the conditions of weathering were more intense essentially before sedimentation occurs in the source area. There exists a significant difference in ratios of La/Sc, Th/Sc and Th/Co present in felsic and basic rocks and thus developing limitations on normal provenance composition [28, 29]. Therefore, this study made a comparison of Th/Co, Th/Sc and La/Sc ratios of clay samples to basic and felsic rock derived from sediment (fine fraction) of upper continental crust (UCC) (Table 4). Trace elements concentration derived from the clay samples evaluated were normalized to average values for UCC [30]. The clay samples studied normalized to the UCC normalized pattern, indicates that Sr is lower but Ba higher in comparison to the values of UCC, Figure 9. This may be ascribed to mobile elements during high hydration energies and the process of weathering [31].
5.4 Rare earth elements (REEs) geochemistry
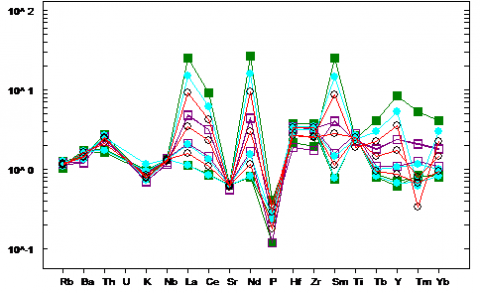
The REEs analysis are summarized in Table 6. The clay samples have similar REEs concentrations. The samples have pronounced negative Europium (Eu) anomalies (Eu/Eu*), ranging from 0.77 to 1.17. The Eu anomaly parallels the depletion in Na2O and CaO, providing a clue that it must have been occasioned at least in response to partial weathering of plagioclase feldspar which serves as host for most of the Eu. LREE enrichment and negative Eu anomaly reveals their crustal abundance, while HREE depletion is because of their capacity to form complexes that are soluble in sea water. The Eu anomaly in sedimentary rocks is usually interpreted as being from igneous source rocks [30-33]. The clay samples studied indicates similar patterns with the NASC but the HREE content differs in comparison to UCC, Figure 10. High ratios of LREE/HREE (Tables 6 and 7) and negative anomalies of Europium are consistent with sediments of felsic provenance whereas, mafic rocks have lower LREE/HREE and none or small Eu anomalies [34]. Chondrite-normalized ratio of La/Yb varies from 12.02 to 38.66 (Table 3), with most sediments having values that are higher than those of PASS and UCC. The relative abundance in the HREEs in comparison to LREEs may be as a result of high concentration of heavy minerals like Zircon (Zr) having values ranging from 168.0 ppm to 752.3 ppm in clay samples which is highly resistant to weathering.
Figure 10. Plots of Chondrite-normalized rare earth elements for the studied clay samples
Source: modified after [31]
Table 6. Average rare earth elements chemical composition (in ppm) compared with some world averages
|
Element (ppm) |
Sosan Clay |
NASC |
UC |
PASS |
|
La |
180.13 |
31.1 |
30.64 |
38.20 |
|
Ce |
185.36 |
64 |
67.05 |
79.60 |
|
Pr |
43.34 |
- |
7.1 |
8.83 |
|
Nd |
153.04 |
30.4 |
26 |
33.90 |
|
Sm |
24.74 |
5.98 |
4.5 |
5.53 |
|
Eu |
5.26 |
1.24 |
0.88 |
1.08 |
|
Gd |
16.57 |
5.5 |
3.8 |
4.66 |
|
Tb |
23.98 |
0.85 |
0.64 |
0.74 |
|
Dy |
10.59 |
5.54 |
3.5 |
4.68 |
|
Ho |
1.87 |
- |
0.8 |
0.99 |
|
Er |
4.62 |
3.27 |
2.3 |
2.85 |
|
Tm |
0.65 |
3.11 |
2.2 |
0.41 |
|
Lu |
0.53 |
1.46 |
1.43 |
0.43 |
|
Y |
52.59 |
35 |
22 |
- |
|
Sc |
11.33 |
14.9 |
11 |
- |
5.5 Provenance
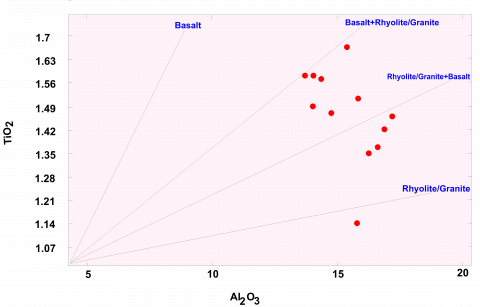
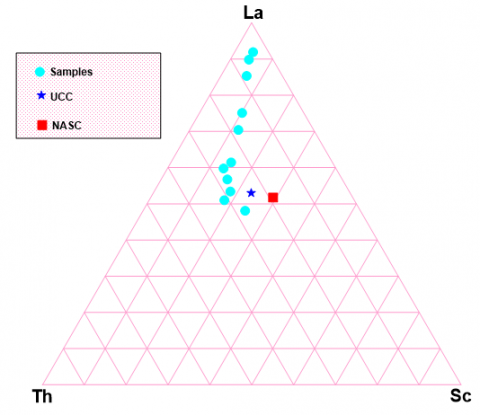
Clay mineralogy indicates that kaolinite and nontronite of the smectite group are the major clay minerals in the studied clay with abundant quartz. This implies that the clay sample is derived mainly from felsic sources of granitic basement rocks [35]. The plots of TiO2 against Al2O3 indicated provenance of the studied clay samples from predominantly acidic rocks where samples plotted in the zones between granite/rhyolite+basalt and granite/rhyolite, Figure 11. The chemical indices of alteration (CIA) and weathering (CIW), which varies from 73.5% to 81.1% and 88.1% to 91.6% respectively point toward a felsic source and probably suggests sediment recycling process [17]. The REE distribution patterns in the sediments slightly have a high ratio value of 25.23% (La/Yb) and negative Eu anomaly. These characteristics indicates the original source area was felsic and the negative Eu anomaly (0.83%) is regarded as evidence for a differentiated source similar to granite [36]. The plot of chondrite-normalized REEs and the ratios of LREE/HREE in Table 7 and Figure 7 revealed the enrichment of the clay samples with LREE and negative Eu anomalies. This is consistent with sediments that is associated with felsic provenance. Th/Sc ratios range from 1.28-3.07 ppm and La/Th from 1.77-26.89 ppm and therefore, suggests a combined sources of sediments. The La-Th-Sc illustration in Figure 12, adopted principally in this study to differentiate sources between basic and felsic rocks of the fine grained sediments [37, 38]. This plot revealed that the plotted data fall in the region which implies that the source is primarily felsic but does not exclude a possible combined sources between basic and felsic rocks. The plotted data are clustered between La-Th but at a point nearer to La than to Th and some of the plotted data close to UCC and NASC values. This indicates the removal of La, Th, and Sc from the weathered profiles. Hence, clay mineralogy, major oxides, rare earth and trace elements indicates the studied clay samples were predominantly derivatives of felsic sources.
Figure 11. TiO2/Al2O3 binary plot of studied clay samples
Figure 12. La-Th-Sc ternary plot of the clay samples
Source: modified after [38]
Table 7. Composition rare earth elements of Sosan clay samples from southwestern Nigeria
|
LREE (ppm) |
SOS1 |
SOS2 |
SOS3 |
SOS4 |
SOS5 |
SOS6 |
SOS7 |
SOS8 |
SOS9 |
SOS10 |
SOS11 |
SOS12 |
|
Ce |
53.8 |
55.4 |
594.7 |
200.8 |
199.8 |
93.6 |
85.4 |
54.6 |
397.4 |
146.7 |
70.1 |
272.1 |
|
Nd |
21.3 |
20.9 |
701.7 |
117.7 |
112.2 |
44.1 |
39.7 |
21.1 |
406.7 |
78.2 |
30.4 |
242.5 |
|
La |
33.5 |
33.9 |
763.6 |
143.5 |
144.6 |
63 |
61.8 |
33.7 |
453.6 |
103.8 |
47.8 |
278.7 |
|
Sm |
3.52 |
3.37 |
113.7 |
17.93 |
18.25 |
7.18 |
6.58 |
3.45 |
65.82 |
12.72 |
5.02 |
39.27 |
|
HREE (ppm) |
||||||||||||
|
Sc |
9 |
9 |
14 |
14 |
13 |
11 |
10 |
14 |
9 |
12 |
10 |
11 |
|
Y |
15.7 |
13.4 |
182.8 |
51.8 |
52.9 |
24 |
23.3 |
14.6 |
117.3 |
38.5 |
18.9 |
77.9 |
|
LREE/HREE Ratios (ppm) |
||||||||||||
|
Ce/Sc |
5.98 |
6.16 |
42.48 |
14.34 |
15.37 |
8.51 |
8.54 |
3.9 |
44.16 |
12.23 |
7.1 |
24.74 |
|
Ce/Y |
3.43 |
4.13 |
3.25 |
3.88 |
3.78 |
3.9 |
3.67 |
3.74 |
3.39 |
3.81 |
3.70 |
3.49 |
|
La/Y |
2.13 |
2.53 |
4.18 |
2.77 |
2.73 |
2.62 |
2.65 |
2.31 |
3.87 |
2.69 |
2.53 |
3.58 |
Clay samples from southwestern Nigeria was evaluated for its mineralogical, major geochemistry and behavior of rare earth elements (REEs) and trace elements. This was done to determine weathering history and provenance. Fifteen clay samples were collected from the study area and thereafter subjected to mineralogical and chemical analyses. Field evidences revealed that the clay samples are products of insitu weathering of granite, granite gneiss and biotite gneiss. Mineralogical composition based on X-ray diffraction studies indicate that the clay is dominated by nontronite and kaolinite whereas quartz is the major non-clay mineral. Orthoclase, labradorite and albite are present in minor amounts. The chemical index of alteration (CIA) varies from 73.5% to 81.1% and chemical index of weathering (CIW) values ranging from 88.1% to 91.6% implies more of felsic sources. The presence of detrital orthoclase feldspar, albite and labradorite (rock-forming minerals) as revealed in the mineralogical results implies that the clay sample has not yet reached maturity. Moderate chemical weathering conditions are the most conducive to smectite mineral generation as it is evidenced in the low kaolinite and smectite (nontronite) clay minerals present in the samples. However, high abundant quartz and presence of kaolinite probably indicates that the sediments are derivatives of felsic sources. The relative high concentrations of Rb and Sr in the clay samples with values ranging from 113.4-138.2 ppm and 218.3-229.2 ppm respectively suggest ongoing chemical weathering. The chondrite-normalized REE plot further infers that the LREE/HREE ratios are enriched in LREE, with negative Eu (0.83%) anomalies consistent with sediments of felsic provenance. In addition, La-Th-Sc diagram implies that the region where the plotted data of the clay samples falls were mostly felsic source. Based on the interpretation of results in this study, it is recommended that major, immobile trace and rare-earth element geochemistry with appropriate discriminatory diagrams can be adapted for provenance, weathering signatures and history as well as to determine the tectonic settings of clay bodies.
The authors would like to thank Acme Laboratory in Vancouver Canada for mineralogical and geochemical analysis. Thanks are due to the editor and also to the anonymous reviewers.
[1] Roddaz, M., Viers, J., Brusset, S., Baby, P., Boucayrand, C., Hérail, G. (2006). Controls on weathering and provenance in the Amazonian foreland basin: insights from major and trace element geochemistry of Neogene Amazonian sediments. Chemical Geology, 226(1-2): 31-65. http://dx.doi.org/10.1016/j.chemgeo.2005.08.010
[2] Borges, J.B., Huh, Y., Moon, S., Noh, H. (2008). Provenance and weathering control on river bed sediments of the eastern Tibetan Plateau and the Russian Far East. Chemical Geology, 254(1-2): 52-72. http://dx.doi.org/10.1016/j.chemgeo.2008.06.002
[3] Singh, P. (2009). Major, trace and REE geochemistry of the Ganga River sediments: influence of provenance and sedimentary processes. Chemical Geology, 266(3-4): 242-255. http://dx.doi.org/10.1016/j.chemgeo.2009.06.013
[4] Noh, H., Huh, Y., Qin, J., Ellis, A. (2009). Chemical weathering in the Three Rivers region of Eastern Tibet. Geochimica et Cosmochimica Acta, 73(7): 1857-1877. https://doi.org/10.1016/j.gca.2009.01.005
[5] Shao, J., Yang, S., Li, C. (2012). Chemical indices (CIA and WIP) as proxies for integrated chemical weathering in China: inferences from analysis of fluvial sediments. Sedimentary Geology, 265: 110-120. http://dx.doi.org/10.1016/j.sedgeo.2012.03.020
[6] Garzanti, E., Padoan, M., Setti, M., López-Galindo, A., Villa, I.M. (2014). Provenance versus weathering control on the composition of tropical river mud (southern Africa). Chemical Geology, 366: 61-74. http://dx.doi.org/10.1016/j.chemgeo.2013.12.016
[7] Garzanti, E., Resentini, A. (2016). Provenance control on chemical indices of weathering (Taiwan river sands). Sedimentary Geology, 336: 81-95. http://dx.doi.org/10.1016/j.sedgeo.2015.06.013
[8] Allegre, C.J., Minster, J.F. (1978). Quantitative models of trace element behavior in magmatic processes. Earth and Planetary Science Letters, 38(1): 1-25. http://dx.doi.org/10.1016/0012-821X(78)90123-1
[9] Hanson, G.N. (1978). The application of trace elements to the petrogenesis of igneous rocks of granitic composition. Earth and Planetary Science Letters, 38(1): 26-43. http://dx.doi.org/10.1146/annurev.ea.08.050180.002103
[10] Hanson, G.N. (1980). Rare earth elements in petrogenetic studies of igneous systems. Annual Review of Earth and Planetary Sciences, 8: 371-406. http://dx.doi.org/10.1146/annurev.ea.08.050180.002103
[11] Haskin, L.A. (1984). Petrogenetic modelling-use of rare earth elements. Developments in Geochemistry, 2: 115-152. http://dx.doi.org/10.1016/B978-0-444-42148-7.50009-5
[12] Singh, M., Sharma, M., Tobschall, H.J. (2005). Weathering of the Ganga alluvial plain, northern India: implications from fluvial geochemistry of the Gomati River. Applied Geochemistry, 20(1): 1-21. http://dx.doi.org/10.1016/j.apgeochem.2004.07.005
[13] Nesbitt, H.W., Markovics, G. (1980). Chemical processes affecting alkalis and alkaline earths during continental weathering. Geochimica et Cosmochimica Acta, 44(11): 1659-1666. http://dx.doi.org/10.1016/0016-7037(80)90218-5
[14] Nesbitt, H., Young, G.M. (1982). Early Proterozoic climates and plate motions inferred from major element chemistry of lutites. Nature, 299(5885): 715-717. http://dx.doi.org/10.1038/299715a0
[15] Harnois, L. (1988). The CIW index: A new chemical index of weathering. Sedimentary Geology, 55(3): 319-322. http://dx.doi.org/10.1016/0037-0738(88)90137-6
[16] Ajayi, J.O., Agagu, O.K. (1981). Mineralogy of primary clay deposits in the basement complex areas of Nigeria. J. Min. Geol, 18(1): 27-30.
[17] Elueze, A.A., Bolarinwa, A.T. (2001). Appraisal of the residual and sedimentary clays in part of Abeokuta area, Southwestern Nigeria. Journal Mining and Geology, 37(1): 7-14.
[18] Fasuba, O.A., Egunlae, O., Jimoh, B. (2001). Metallurgical analysis of Orin-Ekiti alumina clay deposit for use as a refractory. Journal of Engineering Technology and Industrial Applications, 1(4): 67-71.
[19] Ehinola, O.A., Oladunjoye, M.A., Gbadamosi, T.O. (2009). Chemical composition, geophysical mapping and reserve estimation of clay deposit from parts of Southwestern Nigeria. Journal of Geology and Mining Research, 1(3): 057-066. https://doi.org/10.5897/JGMR.9000010
[20] OlaOlorun, O., Oyinloye, A. (2010). Geology and geotechnical appraisal of some clay deposits around Ijero-Ekiti Southwestern Nigeria: implication for industrial uses. Biological Sciences-PJSIR, 53(3): 127-135.
[21] Akinola, O.O., Obasi, R.A. (2014). Compositional characteristics and industrial potential of the lateritic clay deposit in Ara-Ijero areas, Southwestern Nigeria. International Journal of Scientific and Technology Research, 3(8): 305-311.
[22] Onyeobi, T.U.S., Imeokparia, E.G., Ilegieuno, O.A., Egbuniwe, I.G. (2013). Compositional, geotechnical and industrial characteristics of some clay bodies in Southern Nigeria. Journal of Geography and Geology, 5(2): 73-84.
[23] JCPDS. (1974). Joint committee on powder diffraction standards. Selected powder diffraction data for mineral. 1st Edition In: L.G. Berry (ed.) Philadelphia, p. 833.
[24] Chen, P.Y. (1977). Table of key lines in X-ray powder diffraction patterns of minerals in clays and associated rocks: Indiana Geological Survey Occasional Paper 21, p. 67.
[25] Fedo, C.M., Wayne Nesbitt, H., Young, G.M. (1995). Unraveling the effects of potassium metasomatism in sedimentary rocks and paleosols, with implications for paleoweathering conditions and provenance. Geology, 23(10): 921-924. https://doi.org/10.1130/0091-7613(1995)023%3C0921:UTEOPM%3E2.3.CO;2
[26] Böning, P., Brumsack, H.J., Böttcher, M.E., Schnetger, B., Kriete, C., Kallmeyer, J., Borchers, S.L. (2004). Geochemistry of Peruvian near-surface sediments. Geochimica et Cosmochimica Acta, 68(21): 4429-4451. http://dx.doi.org/10.1016/j.gca.2004.04.027
[27] Wronkiewicz, D.J., Condie, K.C. (1987). Geochemistry of Archean shales from the Witwatersrand Supergroup, South Africa: source-area weathering and provenance. Geochimica et Cosmochimica Acta, 51(9): 2401-2416. https://doi.org/10.1016/0016-7037(87)90293-6
[28] Cullers, R.L. (1994). The controls on the major and trace element variation of shales, siltstones, and sandstones of Pennsylvanian-Permian age from uplifted continental blocks in Colorado to platform sediment in Kansas, USA. Geochimica et Cosmochimica Acta, 58(22): 4955-4972. http://dx.doi.org/10.1016/0016-7037(94)90224-0
[29] Cullers, R.L., Basu, A., Suttner, L.J. (1988). Geochemical signature of provenance in sand-size material in soils and stream sediments near the Tobacco Root batholith, Montana, USA. Chemical Geology, 70(4): 335-348. http://dx.doi.org/10.1016/0009-2541(88)90123-4
[30] Cullers, R.L. (1995). The chemical signature of source rocks in size fractions of Holocene stream sediment derived from metamorphic rocks in the wet mountains region, Colorado, USA. Chemical Geology, 113(3-4): 327-343. http://dx.doi.org/10.1016/0009-2541(94)90074-4
[31] Taylor, S.R., McLennan, S. M. (1985). The Continental Crust: Its Composition and Evolution. Blackwell, Oxford, p. 312. http://dx.doi.org/10.1017/CBO9780511575358.014
[32] Awwiller, D.N. (1994). Geochronology and mass transfer in Gulf Coast mudrocks (south-central Texas, USA): Rb Sr, Sm Nd and REE systematics. Chemical Geology, 116(1-2): 61-84. https://doi.org/10.1016/0009-2541(94)90158-9
[33] Compton, J.S., White, R.A., Smith, M. (2003). Rare earth element behavior in soils and salt pan sediments of a semi-arid granitic terrain in the Western Cape, South Africa. Chemical Geology, 201(3-4): 239-255. http://dx.doi.org/10.1016/S0009-2541(03)00239-0
[34] Cullers, R.L. (1995). The controls on the major-and trace-element evolution of shales, siltstones and sandstones of Ordovician to Tertiary age in the Wet Mountains region, Colorado, USA. Chemical Geology, 123(1-4): 107-131. http://dx.doi.org/10.1016/0009-2541(95)00050-V
[35] McLennan, S.M. (1993). Weathering and global denudation. The Journal of Geology, 101(2): 295-303. http://dx.doi.org/10.1086/648222
[36] Taylor, S.R., McLennan, S.M. (1981). The composition and evolution of the continental crust: rare earth element evidence from sedimentary rocks. Philosophical Transactions of the Royal Society of London. Series A, Mathematical and Physical Sciences, 301(1461): 381-399. https://doi.org/10.1098/rsta.1981.0119
[37] Mclennan, S. (1989). Rare earth elements in sedimentary rocks: influence of provenance and sedimentary processes. Reviews in Mineralogy and Geochemistry, 21: 169-200. http://dx.doi.org/10.1515/9781501509032-010
[38] Ekosse, G. (2001). Provenance of the Kgwakgwa kaolin deposit in southeastern Botswana and its possible utilization. Applied Clay Sci., 20(3): 137-152. https://doi.org/10.1016/S0169-1317(01)00064-3