Min Zhang | Shaolong Zhang | Shiwei Shen* | Weilong Zhang
© 2021 IIETA. This article is published by IIETA and is licensed under the CC BY 4.0 license (http://creativecommons.org/licenses/by/4.0/).
OPEN ACCESS
Soil–rock mixture is a special geological material between homogeneous soil masses and fractured rock masses. In this study, the shear characteristics, movement and failure characteristics of particles and the evolution law of cracks were studied by direct shear tests and particle flow numerical simulations. The results show that the shear stress-shear displacement curves of the soil–rock mixture can be roughly classified into three stages: elastic stage, plastic stage and strain softening stage, and there was a "jump" phenomenon. The higher the rock content was, the more obvious the phenomenon. The shear strength and its indices of the soil–rock mixture did not increase with increasing rock content, but there was an "optimal rock content". According to the experimental and simulation results, particle breakage can be divided into three types: slight failure, partial failure and complete failure. The crack propagation characteristics can be divided into three stages, and the crack propagation depth increases with increasing shear displacement. It increases with increasing vertical stress and decreases with increasing block rock content.
soil–rock mixture, numerical simulation, failure characteristics, crack propagation
In the field of geological engineering and geotechnical engineering, a kind of special engineering geological body that was between homogeneous soil and cataclastic rock mass was often encountered, which was composed of high strength block rock and low strength fine soil. Many scholars have studied this special engineering geological body, Medley [1] named it bimsoils (block in matrixsoil), while Chinese scholar You Xinhua named it “soil–rock mixture”.
Scholars at home and abroad have mainly used indoor and large-scale in-situ tests and numerical simulations to explore the geometric and mechanical properties of soil–rock mixture. For example, Zhang et al. [2] studied the nonlinear relationship between the shear strength of the soil–rock mixture and the rock content, and an empirical formula predicting the shear strength of mixtures consisted of strong rocks and a weak soil matrix was proposed. Zhao et al. [3] used 5 types of composite soil samples to perform uniaxial compression tests and found that the rock content exceeding a certain threshold would cause the integrity of the sample to be disturbed and the unconfined compressive strength to decrease. Gao et al. [4] found through a large number of direct shear tests that when the rock content is 25% to 70%, an increase in the rock content can increase the strength of the entire material and improve its mechanical properties.
In terms of numerical simulation, Xu et al. [5] used discrete element numerical simulation to study the deformation and failure mechanism and mechanical behavior of soil–rock mixture. Based on the Voronoi cell, a method representing volume strain at particle scale is proposed. Results show that there is close contact between macro mechanical behavior and deformation localization of the sample. Graziani et al. [6] analyzed the mechanical properties of the soil–rock mixture by biaxial test particle discrete element simulation. The relationship between the overall constitutive parameters and micromechanical properties. Xu et al. [7] further developed the random generation technology of rock particles in soil–rock mixture based on random convex polygons and extended it to particle discrete elements, and proposed a discrete element modeling method that can build broken rock particles. At the same time, a two-dimensional meso-structure model of the soil–rock mixture was established to study the mechanical properties and failure mechanism of the soil-rock mixture under different confining pressures.
However, there were still few studies on the breaking law and crack propagation law of the sample during the shearing process of irregular blocks.
In summary, this paper analyzes the influence of the meso-structure characteristics of the soil-rock mixture on the macro-mechanical properties through direct shear test and particle flow numerical simulation methods, and studies the movement and failure characteristics of particles and the evolution of cracks during the shearing process.
This test was a direct shear test of a reshaped soil–rock mixture, using a coarse-grained soil direct shear tester. The test materials were collected from the accumulation of soil–rock mixture in the Jingyuetan area, Changchun City, China. The coarse-grained rock was mainly limestone, and the fine-grained soil was silty clay. In this direct shear test of coarse-grained soil, 5 mm was used as the limit value of soil and rock particles. For large-diameter boulders, manual hammering is used to remove them, and the rock content was divided into 6 groups, namely 20%, 30%, 40%, 50%, 60%, and 70%. The samples with the same rock content were subjected to direct shear tests under four conditions of vertical stress of 200 kPa, 400 kPa, 600 kPa, and 800 kPa. The composition of each particle size of the prepared soil–rock mixture sample is shown in Table 1.
Table 1. Mass percentage of the soil–rock mixture with different particle size groups
|
Rock content /% |
Mass fraction of each particle size group /% |
||||||||
|
<0.25mm |
0.25⁓0.5mm |
0.5⁓0.75mm |
0.75⁓1mm |
1⁓2mm |
2⁓5mm |
5⁓10mm |
10⁓20mm |
20⁓40mm |
|
|
20 |
6 |
8 |
8 |
10 |
20 |
28 |
6 |
10 |
4 |
|
30 |
5 |
7 |
7 |
9 |
17 |
25 |
8 |
17 |
5 |
|
40 |
5 |
6 |
6 |
7 |
14 |
22 |
12 |
22 |
6 |
|
50 |
3 |
4 |
5 |
6 |
13 |
19 |
15 |
26 |
9 |
|
60 |
3 |
3 |
4 |
4 |
7 |
19 |
15 |
30 |
15 |
|
70 |
2 |
2 |
3 |
4 |
7 |
12 |
20 |
32 |
18 |
To conveniently observe the particles after shear failure, when the rock content was 20%, 40% and 60%, and the vertical stress was 600 kPa, the sieving particles were dyed with pink, white and green paint near the shear plane, and placed under, in and above the shear plane respectively. After the cutting box was placed in the cutting position, four vertical displacement meters and one horizontal displacement meter were respectively set on the cutting box to monitor the displacement changes. The shear rate was set to 1mm/min. Stop the test when the horizontal displacement of the sample reaches 1/10 of the sample diameter or the shear stress was stable.
3.1 Shear stress-shear displacement relationship
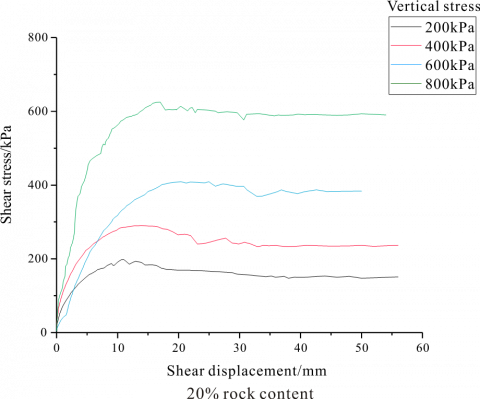
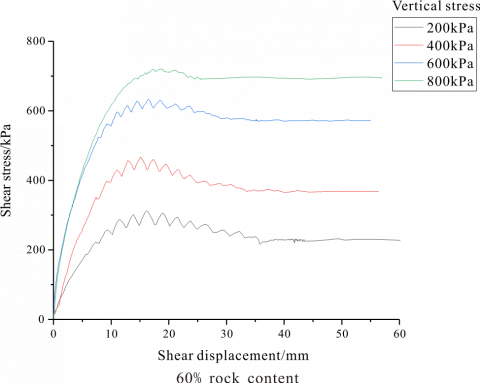
Figure 1. Shear stress–shear displacement curves at 20%, 40%, and 60% rock contents
Factors such as rock content and vertical stress will affect the strength of the soil–rock mixture. Figure 1 shows the shear stress-shear displacement curves when the rock content is 20%, 40% and 60%. Figure 1 shows that the shear stress curve can be roughly summarized into three stages: elastic stage, plastic stage and strain softening stage. In addition, there was a "jumping" phenomenon on the shear stress curve.
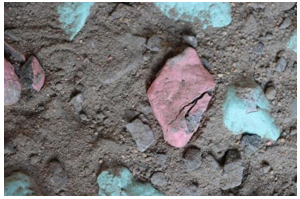
When the rock content was less than 20%, the curve characteristics were not obvious, and when the rock content reaches 40% and above, the shear stress curve characteristics were more obvious. In the elastic phase, the curve was basically straight, and the shear stress increases with the development of the shearing process. This was mainly due to the large gap between the soil and rock particles before the beginning of the shearing, which makes the whole body in a loose state. Under the action of an external load, the soil–rock mixture gradually changes from the loose state to the dense state, and the shear stress increases significantly. In the plastic phase, the curve gradually changes from steep to gentle, and as the pressure further increases, the curve begins to "jump" phenomenon. This was because in the dense state, the rocks contact and bite each other, and the bite force between the rocks improves the overall shear strength. When the external force was large enough, the internal rocks will overstep each other, roll, rearrange, and even break, causing the strain energy accumulated between the particles to be released suddenly, which in turn reduces the shear strength slightly. Therefore, there was a "jump" phenomenon in the shear stress curve. Figure 2 shows that the three colors of rocks appear on the shear surface at the same time, indicating that the rocks near the shear surface have rolled, moved and rearranged. In the final stage, the curve shows a phenomenon of strain softening, which was mainly because the crushing of the rock particles also reduces the overall shear strength. At the same time, after several rearrangements and gradual compaction of the blocks, the curve tends to be stable, entering a state of residual strength, and the shear stress remains basically unchanged.
Figure 2. Distribution of blocks on the shear surface after the shearing was completed when the rock content was 40%
3.2 Vertical displacement-shear displacement relationship
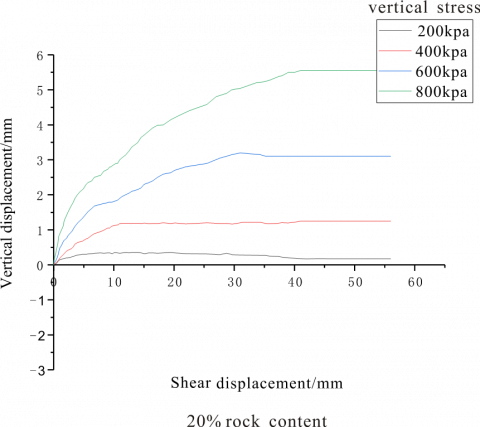
Figure 3. Vertical displacement-shear displacement graph
Shearing will cause the sample volume to change. When the sample volume shrinks, it was called shear shrinkage, and when the sample volume expands, it was called shear dilatancy. Shear shrinkage and dilatancy can be explored through the vertical displacement-shear displacement relationship curve. Figure 3 shows the vertical displacement-shear displacement curves when the rock content was 20%, 40% and 60%. When the rock content was 20%, the rocks were evenly distributed in the soil due to the small rock content, and there was no obvious contact between the rocks. The overall properties were still determined by the fine particles, and the vertical stress was between 200 kPa and 800 kPa, showing shear shrinkage; When the rock content reaches 40% and the vertical stress was 200 kPa, the soil–rock mixture sample will undergo dilatancy, which was mainly due to the rolling, occluding and intersecting of the rock particles, which leads to the dilatancy deformation of the sample. When the vertical stress was greater than 400 kPa, shear shrinkage occurs, and the amount of shear shrinkage increases with increasing vertical stress. The main reason was that, on the one hand, the particle movement in the shear zone of the soil–rock mixture was restricted under high vertical stress, on the other hand, because the particles were more easily broken under high vertical stress, the broken particles were constantly being filled into the voids of the sample. The shear shrinkage characteristics of the soil–rock mixture were further enhanced. The greater the vertical stress is, the more obvious the shear shrinkage characteristics. The test results were consistent with the characteristics of low-pressure dilatancy and high-pressure shrinkage of coarse-grained materials. The difference in dilatancy of samples with different rock contents was mainly reflected in the maximum dilatancy or shrinkage. The specific values were shown in Table 2. As the rock content increases, the maximum dilatancy gradually increases, while the maximum shrinkage tends to decrease; that is, the greater the rock content is, the more obvious the dilatancy characteristics. This further illustrates that the increase in the content of block rocks strengthens the dilatancy characteristics of the soil–rock mixture.
Table 2. The maximum shear shrinkage and dilatancy of specimens with different rock contents
|
Rock content /% |
Vertical stress/kPa |
|||
|
200kPa |
400kPa |
600kPa |
800kPa |
|
|
20 |
0.31 |
1.43 |
3.34 |
5.83 |
|
30 |
0.3(-0.38) |
1.05 |
2.92 |
4.26 |
|
40 |
0.2(-0.99) |
0.32 |
1.88 |
2.79 |
|
50 |
0.18(-1.34) |
0.25 |
1.21 |
2.25 |
|
60 |
0.15(-1.48) |
0.19 |
1.06 |
2.12 |
|
70 |
0.1(-2.18) |
0.15 |
0.98 |
1.76 |
Anotation: The dilatancy is negative, the dilatancy is positive, and the maximum dilatancy is in parenthese
3.3 Shear strength and its parameters
According to the test results, the shear strength of the soil–rock mixture under different rock contents was obtained. The relationship between rock content and shear strength is shown in Figure 4.
Figure 4. Correlation between rock contents and shear strength
It can be concluded that when the rock content was between 30% and 50%, the shear strength of the soil–rock mixture increases significantly. This was because the increase in the content of block rocks makes the block rocks gradually play a role in the overall structure. The mutual contact between the blocks provides a strong bite force for the soil–rock mixture, resulting in a significant increase in its shear strength. When the rock content was 60%, the rock and the rock contact and bite to form a hard skeleton structure, while the remaining 40% of the fine particles fully fill the gaps between the rocks, so that the compactness of the skeleton structure of the soil–rock mixture was maximized. Therefore, the shear strength also reaches the maximum value. When the rock content exceeds 60%, the internal pores cannot be filled, some fine particles were even in a suspended state, the internal contact was reduced, the structural integrity was poor, and the shear strength was reduced.
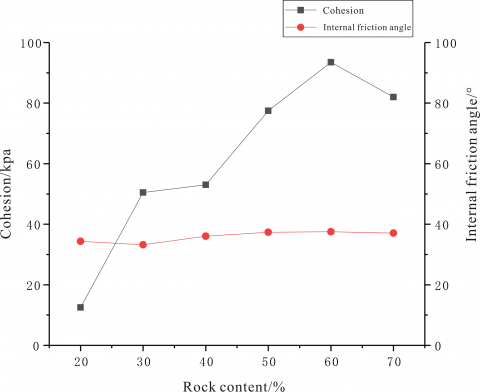
Figure 5. The relationship between rock content and shear strength index
Figure 5 shows that the cohesion first increases and then decreases with increasing rock content. When the optimal rock content was 60%, the cohesion C also reaches the maximum value. The fitting result of the friction strength $\varphi$ was approximately 37°. It can be considered that the value of $\varphi$ has nothing to do with the particle size and rock content of the soil–rock mixture, and depends on the physical and mechanical properties of the "soil" and "rock" used in the test.
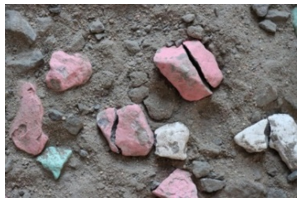
When the rock content was 20%, 40% and 60%, and the vertical stress was 600 kPa, the upper shear box was removed after shear failure, and the shear plane was cleaned slowly, to observe the morphology of the shear plane and the fragmentation of the block rock. By observing Figure 6, it was found that the fragmentation of some rocks on the shear surface can be summarized into three categories: (1) slight damage (2) partial damage (3) complete crushing.
(1) slight damage
(2) partial damage
(3) complete crushing
Figure 6. Types of shear failure
To further explore the changes in internal particles and shear failure characteristics of the soil–rock mixture during the shearing process, PFC2D particle flow numerical simulation was used to carry out the numerical simulation. The size of the model was consistent with the large-scale indoor direct shear test sample. The built-in cluster (breakable) command stream of the PFC program was used to bond multiple spherical particle units together in a certain combination to simulate block rock particles. Then, the Monte Carlo method was used to randomly generate the clusters of boulder particles established by the numerical model. Figure 7 shows the cluster model generation process of block stone particles.
(1) HD digital image; (2) binarized image; (3) border contour image; (4) cluster numerical model
Figure 7. The generation process of the cluster model of block rock particles
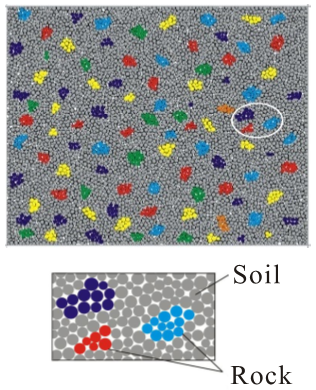
According to the above modeling method, the mesostructure model of soil–rock mixture with different block content was established. Figure 8 shows the mesostructure model of the soil–rock mixture when the rock content is 40%.
Figure 8. Mesostructure model and partial enlarged view of soil–rock mixture with rock content of 40%
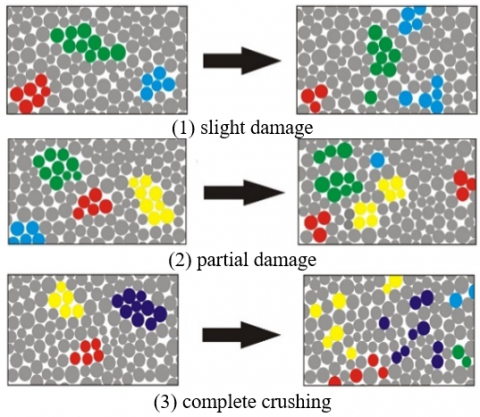
Through the comparison before and after the simulated shearing of the block rock particles, it was found that the block rock particles were broken, and the damage was consistent with the results of the indoor direct shear test. It can also be divided into three types: slight damage, partial damage and complete crushing. Figure 9 shows these three different forms of destruction. In Figure 9 (1), the blue and green block rocks were destroyed after shearing. The block rock particles were broken into a particle unit, but most of the units were only flipped. This was called "slight failure"; the green and yellow boulder particles in Figure 9 (2) were more severely damaged. One large boulder was completely broken into two small boulder particles. This was called "local damage"; The purple and yellow rock particles in Figure 9 (3) have been destroyed to a large extent and were completely broken down into several small particles. This was called "completely broken".
Figure 9. Simulation comparison before and after shear failure
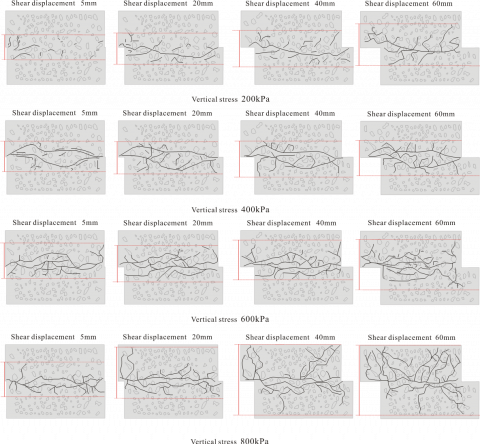
During the shearing process, the development of internal cracks in the soil–rock mixture sample can reflect its shear failure characteristics. By monitoring and recording the location of the crack during the shearing process, the evolution law of the crack was obtained. Figures 10 and 11 respectively show the crack growth of the soil-rock mixture samples with 40% and 60% block rock content during the shearing process.
According to the three stages divided by the shear stress curve and the characteristics of crack growth, the process of crack growth can be described as the following stages. (1) In the compaction stage (corresponding to the elastic stage), cracks begin to form at the interface between the soil and the boulder particles near the shear box. This was stage mainly occurs during volume compression and void reduction, and the shear band was only formed at the initial stage. (2) The local deformation stage (corresponding to the plastic stage). In this was stage, many small cracks formed when the shear zone was first formed, staggered and extended along the interface between the soil and the rock particles, forming a local failure area. (3) In the shear failure stage (corresponding to the strain softening stage), with the development of shear displacement, the cracks continue to expand, extend, connect and interlock to form a complete and continuous shear zone, which ultimately leads to the failure of the specimen. Figure 11 shows that when the shear displacement was 5 mm, only a few sporadic cracks appear near the shear zone. When the shear displacement increases to 20mm, a through crack was formed. With the increase in the shear displacement, crack growth begins to appear on both sides of the through crack, and the shear band becomes thicker. With the increase in the vertical stress, the number of internal cracks in the sample increased significantly, forming two through cracks, and they interlaced with each other and gradually surrounded the rock particles in the shear zone. As the shear displacement increases, the cracks continue to expand in the horizontal and vertical directions.
Through monitoring and recording of cracks in the shearing process, the crack propagation depths of soil–rock mixture samples with different rock contents were obtained, as shown in Table 3.
Figure 10. When the rock content was 40%, the crack propagation situation
Figure 11. When the rock content was 60%, the crack propagation situation
According to the data in Table 3, the relationship between the crack propagation depth and the shear displacement of the soil–rock mixture under different vertical stress was obtained. When the content of nuggets was the same, with increasing vertical stress, the depth of crack propagation increases. The main reason was that with increasing the vertical stress, the particles inside the sample were compressed and denser, and the particles were tightly occluded together. With the development of the shearing process, the particles located near the shear zone disturb the particles farther away to slide, which makes the propagation depth of the cracks increase. When the vertical stress was the same, the crack propagation depth decreases with increasing the block rock content. This was mainly because the larger the content of block rock is, the smaller the number of particles generated inside the soil–rock mixture sample. Then, the contact between the particles was relatively small, so the disturbance effect between the particles was weak during the shearing process, which in turn leads to a decrease in the propagation depth of the crack.
Table 3. Crack propagation depth of soil–rock mixture samples with different rock contents
|
Rock content /% |
Vertical stress /kPa |
Crack growth depth /mm |
|||
|
5mm |
20mm |
40mm |
60mm |
||
|
40 |
200 |
129.04 |
176.39 |
186.23 |
213.25 |
|
400 |
158.73 |
208.19 |
219.21 |
247.46 |
|
|
600 |
176.64 |
226.37 |
257.32 |
326.79 |
|
|
800 |
197.61 |
288.43 |
387.28 |
394.51 |
|
|
50 |
200 |
116.28 |
165.18 |
179.33 |
201.16 |
|
400 |
147.45 |
198.64 |
203.78 |
228.56 |
|
|
600 |
171.53 |
206.75 |
246.65 |
301.42 |
|
|
800 |
189.46 |
259.61 |
356.41 |
379.59 |
|
|
60 |
200 |
98.15 |
134.43 |
162.29 |
184.65 |
|
400 |
126.63 |
173.34 |
189.21 |
211.98 |
|
|
600 |
154.32 |
191.25 |
229.34 |
278.86 |
|
|
800 |
173.24 |
231.13 |
324.57 |
362.68 |
|
|
70 |
200 |
81.26 |
123.43 |
146.19 |
165.58 |
|
400 |
108.81 |
152.31 |
174.17 |
192.23 |
|
|
600 |
139.96 |
178.45 |
201.72 |
256.35 |
|
|
800 |
151.34 |
213.67 |
299.05 |
336.09 |
|
In this study, the indoor direct shear test was carried out by using a soil–rock mixture reconfigured with silty clay and block rocks to explore its shear characteristics and shear failure rules, and the conclusions are as follows:
(1) The shear stress-shear displacement curve of soil–rock mixture can be roughly summarized into three phases: the elastic phase, plastic phase and strain softening phase, and there was a "jumping" phenomenon. The higher the rock content is, the more obvious the phenomenon.
(2) The rock content was in the range of 20% to 60%, and the shear strength and index of the soil–rock mixture increase with increasing the rock content. When the rock content was 60%, the internal skeleton structure of the soil–rock mixture reaches the maximum compactness, the shear strength reaches the maximum, and the cohesion also reaches the maximum. The rock content continues to increase, and the shear strength and its indicators begin to decline. However, the change in the internal friction angle was not obvious. The fitting result was approximately 37°. It can be considered that the value of φ has nothing to do with the particle size and rock content of the soil–rock mixture. The internal friction angle depends on the physical and mechanical properties of the "soil" and "rock" used in the test.
(3) During the shearing process, the block rock particles inside the soil–rock mixture sample squeeze, roll, and rearrange each other, and the block rock particles will be broken to different degrees under occlusion. Through the analysis of the block rock particles after the direct shear test and the results of numerical simulation, it can be seen that the particles can be divided into three types: slight damage, partial damage and complete crushing according to the crushing characteristics of the particles.
(4) According to the shear stress curve, the crack growth characteristics can also be divided into three stages. At the same time, as the shear displacement of the soil–rock mixture sample increases during the shearing process, the crack propagation depth increases. With increasing vertical stress, the depth of crack propagation increases; with increasing block rock content, the depth of crack propagation decreases.
The word was supported by the Science and Technology Development Project of Jinlin Province, China (Grant No.20180520073JH), the National Science Foundation of China (Grant No.41502322), and the China Postdoctoral Science Foundation (Grant No.2014M551453).
|
C |
Cohesion, kPa |
|
Greek symbols |
|
|
$\varphi$ |
friction strength, ° |
[1] Medley, E.W. (1994). The engineering characterization of melanges and similar block-in-matrix rocks (bimrocks) (Doctoral dissertation, University of California, Berkeley), 9529422.
[2] Zhang, Z., Sheng, Q., Fu, X., Zhou, Y., Huang, J., Du, Y. (2019). An approach to predicting the shear strength of soil-rock mixture based on rock block proportion. Bulletin of Engineering Geology and the Environment, 1-15. https://doi.org/10.1007/s10064-019-01658-0
[3] Zhao, Y., Gao, Y., Zhang, Y., Wang, Y. (2016). Effect of fines on the mechanical properties of composite soil stabilizer-stabilized gravel soil. Construction and Building Materials, 126: 701-710. https://doi.org/10.1016/j.conbuildmat.2016.09.082
[4] Gao, W., Hu, R., Oyediran, I.A., Li, Z., Zhang, X. (2014). Geomechanical characterization of Zhangmu soil-rock mixture deposit. Geotechnical and Geological Engineering, 32(5): 1329-1338. https://doi.org/10.1007/s10706-014-9808-x
[5] Xu, W.J., Wang, S., Zhang, H.Y., Zhang, Z.L. (2016). Discrete element modelling of a soil-rock mixture used in an embankment dam. International Journal of Rock Mechanics and Mining Sciences, 86: 141-156. https://doi.org/10.1016/j.ijrmms.2016.04.004
[6] Graziani, A., Rossini, C., Rotonda, T. (2012). Characterization and DEM modeling of shear zones at a large dam foundation. International Journal of Geomechanics, 12(6): 648-664.
[7] Xu, W.J., Yue, Z.Q., Hu, R.L. (2008). Study on the mesostructure and mesomechanical characteristics of the soil–rock mixture using digital image processing based finite element method. International Journal of Rock Mechanics and Mining Sciences, 45(5): 749-762. https://doi.org/10.1016/j.ijrmms.2007.09.003