Wondimu Tadiwos Hailesilassie* | Tenalem Ayenew | Sirak Tekleab
© 2021 IIETA. This article is published by IIETA and is licensed under the CC BY 4.0 license (http://creativecommons.org/licenses/by/4.0/).
OPEN ACCESS
This study aims to investigate trends and spatiotemporal variability of precipitation during the period of 1980-2015 in the Main Central Ethiopian Rift Valley Lakes Basin. Mann-Kendall (MK) and Sen’s Slope (SS) estimation were used to detect the trends and magnitudes respectively. The Inverse Distance Weighting method was employed for spatial interpolations. The results revealed that the rainfalls had experienced less concentrated and highly variable in the central rift floor. The trend analysis showed that out of 21 stations, 4 stations (Koshe, Bulbula, Kofole and Shashamane) in annual; six stations (Koshe, Bulbula, Tora, Wulberg, Wondogenet, and Shashamane) in spring; and only one station (Shashamane) in summer showed significantly decreasing trends with -4.5 to -15.59 mm/year range. All stations in spring rainfall revealed no positive trends. Conversely, in both annual and summer rainfall statistically significant increasing trends exhibited for Ejersalelle and Adamitulu with 6.4 to 7.94mm/year range. In monthly time scales, the significant decreasing and increasing trends were also investigated for a few stations. Increasing trends could lead to an increase in potential for water resources whereas variability and decreasing trends could boost over-exploitation of water resources. This study would be provided useful information for management of water resources in the study area.
main central rift lakes, precipitations, spatio-temporal variability, trends
Precipitation is the primary source of surface water and groundwater, the changes in rainfall directly affect the total amount of water resources, and it is of considerable significance to analyze and study the characteristics and rules of changes of precipitation to improve the utilization of water resources [1]. Moreover, Barua et al. [2] noted that rainfall trend analysis studies have become important as observational and historical rainfall data are generally used for planning and design of water resource projects.
East Africa is one of the most meteorological complex parts of Africa due to the interaction of highly variable topography, large inland water bodies and maritime influence with several convergence zones, resulting in climate patterns that change over short distances [3]. Rainfall data analysis can provide information to assess climate risks, potential impacts, and better target attendant interventions in the Great Rift Valley of East Africa [4].
Ethiopian Rift Lakes are suffering from overexploitation of water and environmental changes; however, climatic changes play important role in changing the lake level [5, 6]. The floor of the Ethiopian rift is occupied by a series of lakes fed by large perennial rivers originating from the highlands. The main source of water to the rift lakes and rivers is the rainfall in the eastern and western highlands [7].
In the Main Central Ethiopian Rift Lakes Basin, studies have focused on the temporal variability and trends of precipitations while paying little attention to the spatial variability of the rainfall across the basin [8-10]. The Central Rift Valley (CRV) is one of the environmentally very vulnerable areas in Ethiopia [5]. Hence, a detailed assessment of the spatial and temporal variation of precipitation in the basin is indispensable. Further analysing rainfall in this basin is required for improving the strategies on water resource management.
The previous studies by Legesse et al. [5] and Seyoum et al. [8] noted that human abstraction (industrial and agricultural) from the lakes and the tributaries in the Ethiopia Central Rift Valley started in the early 1980s and have increased with time. Therefore, the overall aim of the present study is to analyse the variability and trends of rainfall at monthly, seasonal, and annual time scale in the period of 1980-2015 (36 years). Additionally, the spatial distribution through interpolation mapping was made using Geographic Information Systems (GIS). An understanding of trends and variability of precipitation entering the catchments would be provided useful information for the planning, development, and management of water resources in the study area.
2.1 Description of the study area
2.1.1 Geographical location and topographic feature
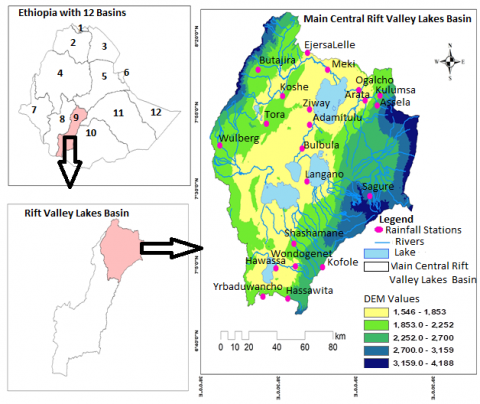
As indicated in Figure 1, this study focused on Main Central Rift Valley Lakes Basin. It consists of five lakes (Ziway, Abijata, Langano, Shalla, and Hawassa). It is found in the Ethiopian Rift Valley Lakes Basin (RVLB) which is one of 12 basins in the country (Fig.1) (MoWR, 2010). The study area is located geographically 38.22°-E & 39.31°-E longitude and 6.75°-N & 8.47°-N latitude and having a total geographical area of approximately 15, 880km2 [11].
The catchments of Main Central Rift Valley lakes have three physiographic regions: the rift floor, escarpment, and highland [12]. As shown in Figure 1, the Shuttle Radar Topography Mission Digital Elevation Model (SRTM DEM) with 30m resolution (obtained from https://www.usgs.gov/) analysed the topographic features of the study area which are in the range of 4188 and 1546 m (a.s.l) maximum and minimum heights respectively (Figure 1). The highest points are located in the Eastern Arsi and Western Gurage Mountains respectively whereas the lowest point is in the rift floor close where the lakes are situated. From Figure 1, we can also observe that the highlands are the sources of the main rivers which are flowing into the lakes.
Figure 1. Location map showing the main central rift valley lakes basin with the five lakes and their catchments, rainfall stations, and rivers
2.2 Data and methodology
2.2.1 Datasets
Meteorological and hydrological time series data were sampled from the National Meteorological Agency (NMA). The spatial distribution of the rainfall stations indicated in Figure 1. In developing countries hydrometric networks are limited [13]. For instance, in Ethiopia, the existing meteorological stations are unevenly distributed with most of the stations located in cities and towns along the main roads [14]. Therefore, the rain gauges are sparsely and unevenly distributed primarily over the study area and there are missing values for the available collected the long-term rainfall records (1980-2015) at 21 measuring stations. In this paper, February-May is considered as the spring rainfall locally called the Belg season whereas June-September is considered as summer which is locally called as Kiremt season.
Most of the rainfall stations are ranging from 0.26% and 11.89% of missing values. But only two stations (Adamitulu and Langano) are with the missing values of less than 16%. In this paper, the missing values have been estimated by using Correlation Coefficient Weighting (CCW) [15]. In this approach, missing data from target station are determined from the values observed in neighbouring stations weighted by the Pearson’s correlation coefficient between the target and the neighbouring stations.
The missing value Yj in a given month at the target station m is completed as:
$Y_{j(m)}=\frac{\sum_{i=1}^{n} r_{m i} \cdot x_{j(i)}}{\sum_{i=1}^{n} r_{m i}}$ (1)
where, $r_{m i}$ is the Pearson’s correlation coefficient between the precipitation series of the neighboring station i and the incomplete series of the target station m, $x_{j(i)}$ is the rainfall value observed at station i.
2.2.2 Trend analysis
Mann–Kendall (MK) test. The non-parametric Mann–Kendall is a useful nonparametric technique to analyse the significance of monotonic trends in hydro-meteorological variables [16, 17]. It is the most common trend analysis and applicable in studies such as Tesemma et al. [18] and Tekleab et al. [19]. Therefore, in this study, the MK test was employed to investigate the presence of significant trends for meteorological variable i.e., precipitation.
The MK test checks the null hypothesis of no trend versus the alternative hypothesis of the existence of increasing or decreasing trend. The null hypothesis H0 is that a sample of data $\left\{X_{i}, i=1,2 \ldots n\right\}$ is independent and identically distributed. The alternative hypothesis H1 is that a monotonic trend exists in X.
The Mann–Kendall test statistics S is calculated from the following equation:
$S=\sum_{k=1}^{n-1} \sum_{j=k+1}^{n} \operatorname{sgn}\left(X_{j}-X_{k}\right)$
where
$\operatorname{sgn}\left(X_{j}-X_{k}\right)=\left\{\begin{array}{c}+1 \text { if }\left(X_{j}-X_{k}\right)>0 \\ 0 \text { if }\left(X_{j}-X_{k}\right)=0 \\ -1 \text { if }\left(X_{j}-X_{k}\right)<0\end{array}\right.$ (2)
where, n is the number of observations. For independent and randomly ordered data for large n, the S statistics approximate a normal distribution with mean E(S) =0 and a variance, V(S) is calculated as:
$V(S)=\frac{n(n-1)(2 n+5)-\sum_{m=1}^{n} t_{m} m(m-1)(2 m+5)}{18}$ (3)
$Z=\left\{\begin{array}{l}\frac{S-1}{\sqrt{\operatorname{var}(s)}} \text { if } S>0 \\ 0 \quad \text { if } S=0 \\ \frac{S+1}{\sqrt{\operatorname{var}(S)}} \text { if } S<0\end{array}\right.$ (4)
In Eq. (4), positive values of Z statistics indicate a positive trend (an increasing trend), while negative Z values indicate a decreasing trend. If the standardized statistic |Z| > 2.58, the trend is significant at the 99% confidence level; if the standardized statistic |Z| > 1.96, the trend is significant at the 95% confidence level, and vice versa [20]. For example, the null hypothesis of no-trend is rejected, and alternative hypothesis of significant trend is accepted, if it is tested at 95% confidence level. It means that the trend is statistically significant at α =95% when the absolute value of Z is higher than 1.96.
Sen’s Slope (SS) Estimator. In addition to trend detection, it is essential to estimate the trend magnitude. Therefore, The slope of rainfall (i.e., change in rainfall over time) was estimated by using Sen’s Slope Estimator developed by Sen [21] which was applied in studies such as Khattak et al. [22]; Abiyot and Dwarkish[23].
Sen’s slope (SS) is estimated as follows:
$\beta=\operatorname{median}\left(\frac{x_{i}-x_{j}}{i-j}\right), \forall_{j<i}$ (5)
where, β is the estimate of the slope of the trend and where xi is the value of data at time step i and xj at time step j. An upward trend is represented by a positive value of β and a downward trend is represented by a negative value of β.
2.2.3 Coefficient of Variability (CV)
Coefficient of variation (CV) is a measure of how the individual data points vary about the mean. The spatial analysis method is able to account for both spatial and temporal variability in time series data [24]. Hence, in this study the coefficient of variation (CV) was calculated for the annual and seasonal rainfalls in order to see how variable they are. A greater value of CV is the indicator of larger variability, and vice versa.
According a study conducted by the then [25], CV is used to classify the degree of variability of rainfall events as less, moderate and high. When CV < 20% it is less variable, CV from 20% to 30% is moderately variable, and CV > 30% is highly variable. Areas with CV > 30% are said to be vulnerable to drought. Therefore, in this study CV was used to identify the variations in annual and seasonal rainfall. It is estimated by the Eq. (6).
$C V=\frac{S}{\mu} \times 100$ (6)
where, CV is the coefficient of variability, S is standard deviation and µ is mean.
2.2.4 Interpolation analysis
Most meteorological data in Ethiopia is inconsistent, unrecorded, or missing, leading to more discrete and unreliable datasets for analysis, this request for use of data reconstruction through interpolation methods [26]. Therefore, in this paper, the spatial interpolation was required to provide information for all catchments of the lakes by mapping the spatial annual to seasonal variability of precipitation based on 21 monitoring stations. This was analysed by using the Inverse Distance Weighting (IDW) interpolation. The computation was made by using ArcGIS software.
Lu and Wong [27] noted that the IDW method was used to interpolate spatial distribution of rainfall. It is based on the assumption that the weighted average of known values within the neighbourhood is used to estimate the value of a non-sampled point. Moreover, Zannat et al. [28] also pointed out that IDW is a very flexible spatial interpolation method. It is easy to use to interpolate spatial distribution. IDM takes a higher weighting factor for target locations closer to the measurement locations.
3.1 The spatial distributions of the mean rainfall
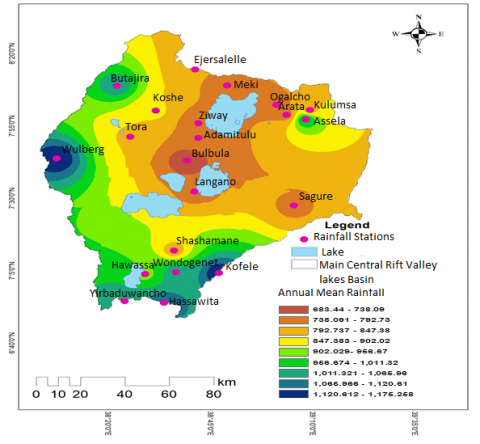
In Figure 2, the spatial distributions of the mean annual rainfall map exhibits large inter-annual variability ranging between 683.44 mm and 1,176.44 mm. The rainfall is mainly concentrated in the southern and western region of the basin. It is less concentrated in the eastern and central rift floor (low land areas) where the rift lakes are located (Figure 2).
Figure 2. Spatial distribution of the mean Annual rainfall during time period of 1980-2015
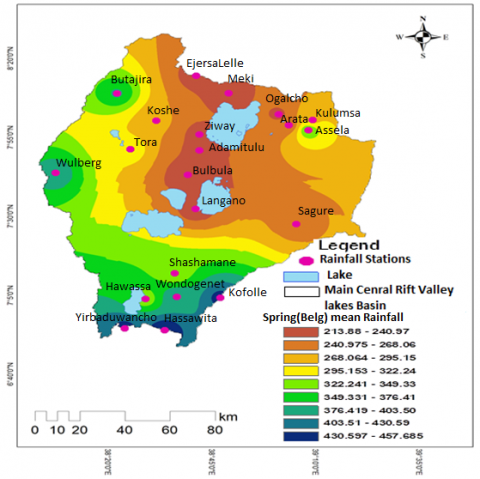
The study area also shows a higher intra-annual variability (seasonal variability), for instance the spring rainfall (FMAM) (Figure 3) is ranging between 213.88 mm and 457.65 mm. The highest average precipitation is concentrated in the western and southern region (corresponding to Lake Hwassaa). The lowest is concentrated in central region where the rift floor of lakes Ziway, Abijata, Langano and Shala. Hence, in spring the spatial pattern of distribution of rainfall is relatively similar to that observed during the annual rainfall on those areas of higher and lower precipitation concentration(Figure 2 and Figure 3).
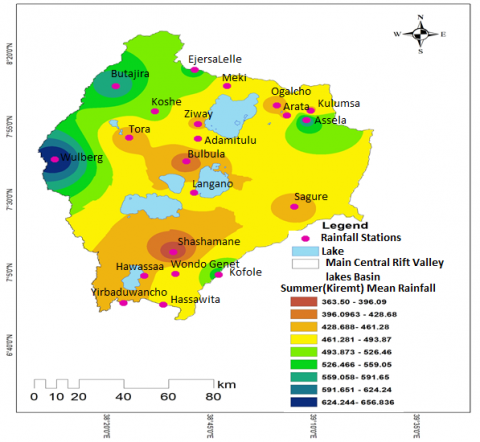
According to Figure 4, the mean rainfall for the long rainy season (JJAS) is ranging between 363.60 mm and 656.836 mm. The highest average precipitation is mainly concentrated in the western and north western region of the basin. But the lowest average summer rainfall is less concentrated in the central or rift floor.
In general, the annual and seasonal rainfall distributions are less concentrated in central rift floor mainly close to the lakes Ziway, Abijata, Langano and Shalla. But the catchment of Hawassa Lake is relatively high concentrated at annual and spring rainfall. The spatial distribution of precipitation may be attributed to the topographical features of the study area.
Figure 3. Spatial distribution of the mean spring (Belg) rainfall during time period of 1980-2015
Figure 4. Spatial distribution of the mean summer (Kiremt) rainfall during time period of 1980-2015
3.2 Analysis of spatial rainfall variability based on the coefficient of variation (CV)
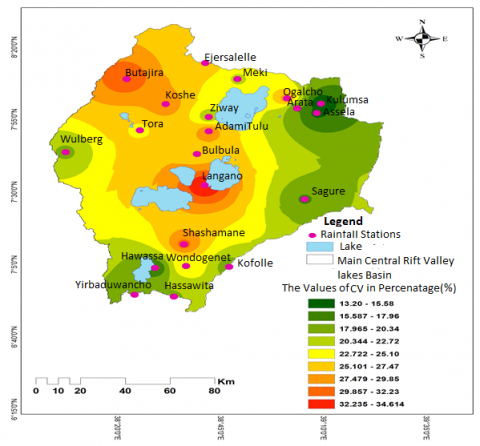
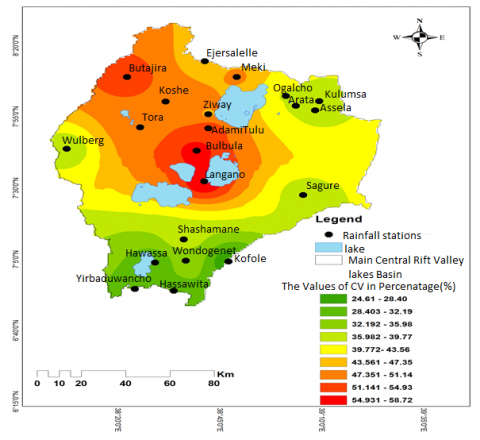
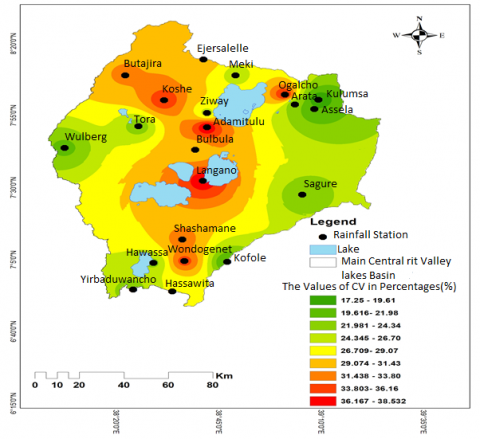
In Figure 5, the percentage in coefficient of variability (CV) for annual rainfall is ranging from 13.20% to 34.61% per year whereas in spring rainfall (Figure 6), it is ranging from 24.61% to 58.72% per year. Moreover, in summer rainfall (Figure 7), the CV is ranging from 17.19% to 38.53% per year. Hence, based on the values of CV, the spring rainfall showed highly variable in the central to north western region of the basin (Figure 6). The pattern of annual rainfall variability is similar to the spring rainfall (Figure 5 and Figure 6). This implies that much of the inter-annual variability originates from the spring rain (Short Rains).
In Figure 6, it can be seen that the largest portions of variability are accounted for the short rainfall season (spring) since most rainfall stations in the spring season (Belg) are highly variable with the maximum amount of CV. This result is in agreed with the previous studies such as Suryabhagavan [26], Seleshi and Zank [29], and Diro et al. [30]. They concluded that the spring rainfall is highly variable in the country, Ethiopia.
Figure 5. The spatial annual rainfall variability based on the values of Coefficient of Variability (CV)
Figure 6. The spatial Belg(Spring) rainfall variability based on the values of Coefficient of Variability (CV)
Figure 7. The spatial Kiremt(Summer) rainfall variability based on the values of Coefficient of Variability (CV)
3.3 Analyzing trends and temporal variability of annual and seasonal rainfall
Table 1 displays Mann-Kendall (MK) and Sen’s slope (SS) tests for detecting the significance of the trends and magnitudes of slopes respectively. The tests were considered as two-sided hypothesis at a 1%, and 5% level of statistical significance. As indicated in Table 1, it can be summarized that most rainfall stations had experienced non-significant trends during the past decades. This analysis is also agreed with the previous studies [8, 9].
In Table 1, the values of MK and SS showed that out of 21 stations, 4 stations (Koshe, Bulbula, Kofole and Shashamane) observed significantly decreasing trends in annual whereas only Shashamane station showed significantly decreasing in summer. Regarding the spring rainfall, six stations (Koshe, Bulbula, Tora, Wulberg, Wondogenet, and Shashamane) showed significantly decreasing trends. The magnitude of trends for significant decreasing trends is ranging from -4.5 to -15.59 mm/year. All stations in spring rainfall revealed no positive trends. Conversely, in both annual and summer rainfall statistically significant increasing trends exhibited for two stations (Ejersalelle and Adamitulu) with 6.4 to 7.94mm/year range.
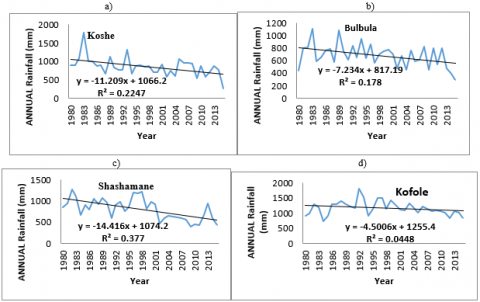
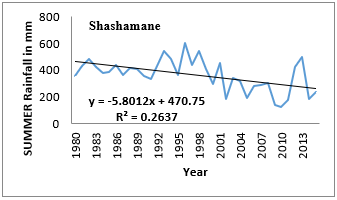
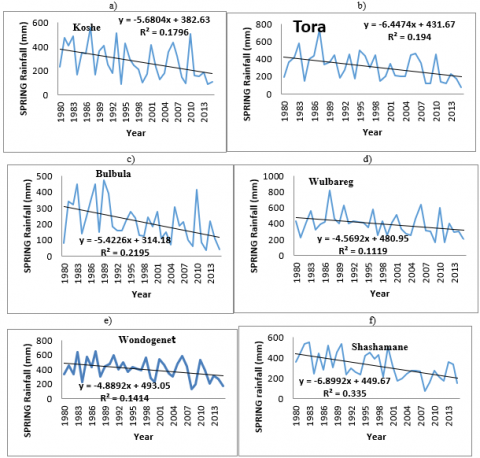
Figure 8(a-d), Figure 9, and Figure 10(a-f) represent the graphical representation of the temporal analysis that showed statistically significant decreasing trends (Table 2) in annual, summer and spring rainfall respectively. In Figure 8(a-d), it can be observed that, in annual rainfall, the sharp falling trends were started in the year 1987 for Koshe and Bulbula whereas in the years 1982 and 1992 for Shashamane and Kofole stations respectively. In Figure 10(a-f), in spring rainfall, it can also be observed that four stations (Koshe, Tora, Wulbareg, and Wondogenet) showed sharply decreasing(falling) trends after 1987 but Shashamane and Bulbula stations showed decreasing(falling) trends after 1983 and 1989 respectively. In summer rainfall only Shashamane station showed significantly decreasing trend during 1980-2015 (Table 1), but it showed a fluctuating trend with increasing from 1980-1996 and a decreasing in the recent past i.e., 1997-2015 which is clearly seen in Figure 9.
The rapid decreasing or falling shows more drying conditions (drought) within the basin that makes the area more prone to drought conditions whereas the rapid increasing or rising of the trends suggests vulnerability of the basin for floods events. In general, the consistent reduction in most of the rainfall stations could lead to an increase in the high abstractions of water for irrigation practice from the water resources (surface and ground water) whereas the increasing trends suggest that the increasing importance of freshwater storage in the lakes and feeder rivers across the basin.
Table 1. Mann-Kendall (MK) and Sen’s slope (SS) trend tests for annual, spring and summer rainfall in the period of 1980- 2015
|
Station Name
|
Annual |
Spring(FMAM) |
Summer(JJAS) |
|||
|
MK |
SS |
MK |
SS |
MK |
SS |
|
|
Butajira |
0.07 |
0.19 |
-1.54 |
-5.12 |
1.49 |
4.44 |
|
Meki |
-0.56 |
-1.53 |
-1.49 |
-2.62 |
-1.13 |
-1.95 |
|
Ziway |
0.61 |
1.84 |
-1.21 |
-2.58 |
1.29 |
2.27 |
|
Kulumsa |
-0.18 |
-0.57 |
-1.43 |
-2.19 |
0.85 |
0.92 |
|
Koshe |
-2.55* |
-9.22 |
-2.57* |
-6.13 |
-1.54 |
-4.10 |
|
Sagure |
-1.10 |
-2.95 |
-0.61 |
-1.16 |
1.02 |
1.28 |
|
Bulbula |
-2.28* |
-7.01 |
-2.90** |
-5.76 |
-1.10 |
-2.21 |
|
Arata |
0.12 |
0.46 |
-1.40 |
-2.23 |
0.40 |
0.83 |
|
Assela |
-0.48 |
-1.23 |
-0.56 |
-1.02 |
-0.04 |
-0.11 |
|
Tora |
-1.89 |
-6.68 |
-2.30** |
-7.00 |
0.12 |
0.20 |
|
Ogalcho |
-0.40 |
-0.95 |
-0.97 |
-1.51 |
-0.26 |
-0.56 |
|
Ejersalelle |
2.38 |
7.94 |
0.26 |
0.60 |
2.60 |
6.40 |
|
Wulberg |
-1.27 |
-6.32 |
-2.14 |
-4.57 |
0.37 |
0.80 |
|
AdamiTulu |
2.06 |
7.87 |
-0.97 |
-1.86 |
2.38 |
7.08 |
|
Langano |
1.08 |
4.79 |
-1.38 |
-2.64 |
1.65 |
4.34 |
|
Hawassa |
-0.23 |
-0.67 |
-0.64 |
-1.51 |
0.31 |
0.56 |
|
WondGenet |
-1.21 |
-4.30 |
-2.14 |
-5.02 |
-0.75 |
-1.35 |
|
Hassawita |
-0.01 |
-0.10 |
-1.02 |
-3.07 |
0.61 |
1.16 |
|
Shashamane |
-3.69** |
-15.60 |
-3.39** |
-6.60 |
-2.90** |
-6.05 |
|
YirbaDuwancho |
-0.59 |
-2.29 |
-1.63 |
-3.35 |
-0.29 |
-0.47 |
|
Koflle |
-2.00* |
-6.72 |
-1.10 |
-2.23 |
-1.78 |
-2.38 |
Mann-Kendall (MK) statistic Siginificant at P<0.05* and P<0.01** (*, **, indicate at 5%, and 1%, significant levels respectively) and Sen‟s slope (SS) (mm/year).
Figure 8. Temporal variation in annual rainfall (statistically significance decreasing trends) for stations (a) Koshe, (b) Bulbula, (c) Shashamane, and (d) Kofole
Figure 9. Temporal variation of Shashamane station that show statistically significance decreasing trends in Kiremt(Summer) rainfall
Figure 10. Temporal variation in the spring rainfall (statistically significance decreasing trends) for stations (a) Koshe(a), (b) Tora, (c) Bulbula, (d) Wulbareg, (e) Wondogenet, and (f) Shashamane
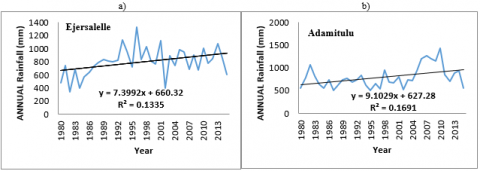
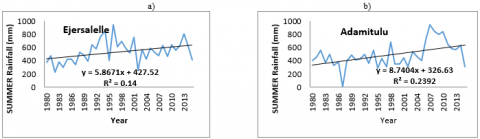
Figure 11(a-b) and Figure 12(a-b) represent the graphical representation of the temporal analysis that showed statistically significant increasing trends (Table 2) in annual, and summer rainfall data respectively. In both figures, we can observe that the two stations (Ejersalelle and Adamitulu) showed increasing trend in annual and summer rainfall. This may have siginificant role for the water level rises.
Figure 11(a-b). The rainfall stations that show statistically significance increasing trends in annual rainfall: Ejersalelle(a), and Adamitulu(b)
Figure 12. The rainfall stations that show statistically significance increasing trends in kiremt(Summer) rainfall: Ejersalelle(a), Adamitulu(b)
Table 2. Monthly MK trends tests for detecting the significance of the trends for the period of 1980-2015 (36 years)
|
Stations Name |
Feb |
Mar |
Apr |
May |
Jun |
Jul |
Aug |
Sep |
|
Butajira |
-1.89 |
-1.04 |
-1.43 |
0.00 |
0.89 |
1.49 |
-0.07 |
-0.50 |
|
Meki |
-1.47 |
1.20 |
-1.19 |
-0.80 |
0.74 |
-0.64 |
-1.73 |
0.07 |
|
Ziway |
-1.61 |
-0.48 |
-0.31 |
0.53 |
1.84 |
2.17** |
-0.67 |
0.91 |
|
Kulumsa |
-1.42 |
-0.46 |
-1.24 |
0.95 |
0.25 |
-0.15 |
-0.37 |
0.75 |
|
Koshe |
-2.18* |
-0.26 |
-1.66 |
-1.35 |
-0.99 |
-0.18 |
-2.22* |
-1.27 |
|
Sagure |
-2.73** |
0.00 |
-0.68 |
0.86 |
1.92 |
-0.04 |
-1.43 |
-0.20 |
|
Bulbula |
-1.86 |
-1.37 |
-1.74 |
-1.40 |
0.40 |
-1.62 |
-1.92 |
0.45 |
|
Arata |
-1.44 |
-0.53 |
-1.06 |
0.53 |
0.67 |
0.70 |
-0.31 |
-0.67 |
|
Assela |
-1.25 |
-0.23 |
-0.56 |
0.94 |
-1.38 |
1.10 |
-0.04 |
-0.64 |
|
Tora |
-1.44 |
-0.18 |
-2.63** |
-0.70 |
0.31 |
0.50 |
-0.86 |
-1.13 |
|
Ogalcho |
-1.47 |
-0.64 |
0.19 |
-0.26 |
0.30 |
-0.82 |
0.08 |
0.40 |
|
Hawassa |
-1.02 |
0.26 |
-1.29 |
0.34 |
-0.01 |
0.20 |
0.33 |
0.42 |
|
WondoGent |
-1.54 |
-0.42 |
-1.78 |
-1.21 |
-1.64 |
-1.80 |
1.08 |
-0.50 |
|
Hassawita |
-1.42 |
-0.10 |
-1.68 |
1.13 |
-0.07 |
0.80 |
0.67 |
-0.18 |
|
Shashamane |
-1.89 |
-1.87 |
-2.66** |
-0.61 |
-1.98 |
-2.63** |
-2.55* |
-2.08* |
|
YirbaDuwancho |
-1.19 |
-0.37 |
-0.40 |
-0.15 |
-1.62 |
0.07 |
0.83 |
-0.91 |
|
Kofelle |
-1.46 |
1.05 |
-1.81 |
-0.20 |
-0.45 |
-2.15** |
0.20 |
-0.91 |
|
Ejersalelle |
-1.64 |
1.32 |
-0.79 |
1.10 |
2.63** |
0.91 |
1.32 |
1.24 |
|
Wulberg |
-1.24 |
-0.71 |
-1.32 |
-0.72 |
0.00 |
0.56 |
-1.19 |
0.61 |
|
Adamitulu |
-1.33 |
-0.03 |
-0.95 |
0.16 |
1.98 |
2.57* |
0.75 |
1.62 |
|
Langano |
-1.90 |
-0.26 |
-0.67 |
-0.18 |
0.76 |
2.03* |
1.54 |
0.72 |
Mann-Kendall (MK) statistic Siginificant at P<0.05* and P<0.01** (*, **, indicate at 5%, and 1%, significant levels respectively)
3.4 Analyzing monthly rainfall trends
Monthly trend analysis has also paramount important roles in order to assess water resources implications and management. In this paper, the trends were analysed for eight months (February-September) which are classified into spring rainfall (February-May) and the summer rainfall (June-September). As discussed in previous section, all stations in spring season revealed negative trends. Hence, in Table 2, we can also observe that the negative (decreasing trends) are highly dominated in the months of spring season (February-May). In February, two stations (Koshe and Sagure) showed decreasing trends at 1% and 5% significant level respectively. Additionally, significantly decreasing trends were also recorded in April for two stations (Tora and Shashamane) at 1% and 5% significant level respectively. Adamitulu and Langano stations showed significantly increasing trends at 5% significant level in July (Table 2).
The water level of Ziway Lake is increasing trend in the past few decades [31], this may be attributed to the increasing trends of rainfall, for instance, in Table 2, it can be observed that two stations (Ejersalelle and Ziway) revealed statistically increasing trends in the months of long rains, June and July at 1% and 5% significant level respectively. These stations are located in the watershed of Ziway Lake.
In the month of July (Table 2), Shashamane and Kofole rainfall stations showed decreasing trends at 1% and 5% significant level respectively. Moreover, the decreasing trends were observed in three consecutive months (July, August and September) for Shashamane rainfall station. The decreasing trends in July-September may be evidence for drought occurrence, since summer rainfall is the long rainy season in Ethiopia. The study conducted by Korecha and Barnston [32] indicated that Kiremt rains during June–September (JJAS) account for high annual rainfall totals over the regions having high agricultural productivity and major water reservoirs. Thus, the most severe droughts are usually related to a failure of the JJAS rainfall to meet Ethiopia’s agricultural and water resources needs.
Due to the fact that the study area is under precipitation-driven hydrologic processes, it is very crucial to study and understand the rainfall trends and variability. The purpose of the present study is to analyse the variability and trends of rainfall at monthly, seasonal, and annual time scale in the period of 1980-2015. The Inverse Distance Weighting (IDW) method was employed for the spatial interpolations mapping. The Coefficient of Variation (CV) was used to identify the variations in rainfall. Moreover, the non-parametric Mann-Kendall (MK) and Sen’s Slope (SS) estimation were used to detect the trends and compute the magnitudes of slopes respectively. All tests for the trend analysiss were considered at a 1%, and 5% level of statistical significance.
The results showed that the spatial distributions of the mean rainfall had experienced less concentrated and highly variable in the central rift floor where the rift lakes are situated. Based on the values of CV, the spring rainfall showed highly variable in the central to north western region of the basin. The pattern of annual rainfall variability is similar to the spring rainfall. Hence, much of the inter-annual variability of the study area originates from the spring rain.
The MK test indicates that most of rainfall stations revealed no significant trends. However, there are stations that showed significant decreasing or increasing trends at annual and seasonal time scales, for instance, at annual time scale, Koshe, Bulbula, Shashamane, and Kofole showed significantly decreasing trends whereas Ejersalelle and Adamitulu stations showed significantly increasing trends. Moreover, Shashamane and Kofole stations showed significantly decreasing trends whereas Ejersalelle and Adamitulu stations showed increasing trends in summer rainfall. Regarding the spring rainfall, the result showed that all rainfall stations revealed negative trends. Meanwhile, Koshe, Bulbula, Tora, Wulberg, Wondogent, and Shashamane stations showed significantly decreasing trends in the spring rainfall.
Based on the magnitudes of slopes and graphical representation of the temporal analysis, the rapid decreasing or falling shows more drying conditions (drought) within the basin that makes the area more prone to drought conditions whereas the rapid increasing or rising of the trends suggest vulnerability the basin for floods events. In monthly rainfall trend analysis, significantly decreasing and increasing trends were also investigated for a few stations.
These findings may contribute to complement the understanding the roles of precipitations variability and trends for the deterioration of the lakes and their Feeder Rivers. This study is also helpful for planning and efficient use of water resources for socio-economic activities in relative to the rainfall variability and trends. Though this study did not pursue to determine any possible causes of rainfall variabiloty and trends, the future studies will have to address the possible causes of rainfall trends.
We ssincerly acknowledge the National Meteorologgical Agency (NMA) of Ethiopiafor providing the rainfall data for this study. The authors are very much thankful for the comments and suggestions from the anonymous reviewers and the editors which helped a lot in improving the quality of the paper.
[1] Yilinuer, A., Jilili, A., Balati, M., Bilal, E., Michael, G. (2020). Innovative trend analysis of precipitation in the lake issyk-kul basin. Kyrgyzstan. Atmosphere, 11: 332. https://doi.org/10.3390/atmos11040332
[2] Barua, S., Muttil, N., Ng, A.W.M., Perera, B.J.C. (2013). Rainfall trend and its implications for water resource management within the Yarra River catchment. Australia. Hydrological Processes, 27(12): 1727-1738 https://doi.org/10.1002/hyp.9311
[3] Nicholson, S. (1996). A review of dynamics and climate variability in Eastern Africa. In:Johnson TJ, Odada EO (eds), The Limnology, Climatology and Paleoclimatology of the Eastern African lakes. Gordon and Breach, Amsterdam, p. 25-56. https://doi.org/10.1201/9780203748978-2
[4] Wakachala, F.M., Shilenje, Z.W., Nguyo, J., Shaka, S., Apondo, W. (2015). Statistical patterns of rainfall variability in the great rift valley of Kenya. Journal of Environmental & Agricultural Sciences, 5: 17-26.
[5] Legess, D., Coulomb, C., Gasse, F. (2004). Analysis of the hydrologicalresponse of a tropical terminal lake, Lake Abiyata (Main Ethiopian Rift Valley) to changes in climate and human activities. J Hydrol Processes, 18: 487-504. https://doi.org/10.1002/hyp.1334
[6] Alemayehu, T., Ayenew, T., Kebede, S. (2006). Hydrogeochemical and lake level changes in the Ethiopian Rift. Journal of Hydrology, 316(1-4): 290-300. https://doi.org/10.1016/j.jhydrol.2005.04.024
[7] Ayenew, T. (2007). Water management problems in the Ethiopian rift: challenges for development. Journal of African Earth Sciences, 48(2-3): 222-236. https://doi.org/10.1016/j.jafrearsci.2006.05.010
[8] Seyoum, W.M., Milewski, A.M., Durham, M.C. (2015). Understanding the relative impacts of natural processes and human activities on the hydrology of the Central Rift Valley lakes, East Africa. Hydrol.Process.Department of Geology, University of Georgia, Athens, GA, USA. https://doi.org/10.1002/hyp.10490
[9] Takele, G., Maurice, N., Benedict, M., Fiseha, B. (2019). Comparative assessment of the effect of climate change and human activities on streamflow regimes in central rift valley basin, Ethiopia. American Journal of Water Resources, 7(1): 23-29. 10.12691/ajwr-7-1-4
[10] Ketema, A., Siddaramaiah, D.G. (2020). Trend and variability of hydrometeorolgical varaibles of tikur wuha watershed in Ethiopia. Arabian Journal of Geoscience, 13: 142. https://doi.org/10.1007/s12517-020-5139-9
[11] MoWR (The Federal Democratic Republic of Ethiopia Ministry of Water Resources). (2010). Rift Valley Lakes Basin Integrated Resources Development Master Plan Study Project. Halcrow Group Limited and Generation Integrated Rural Development (GIRD) Consultants. Addis Ababa.
[12] Ayenew, T. (2002). Recent changes in the level of Lake Abiyata, central main Ethiopian Rift. Hydrological Sciences Journal des Sciences Hydrologiques, 47(3): 439-503. https://doi.org/10.1080/02626660209492949
[13] Michael, K., Ida, W., Allan.R., Henry K. (2012). Estimating areal rainfall over Lake Victoria and its basin using ground-based and satellite data. Journal of Hydrology, 464-465: 401-411. https://doi.org/10.1016/j.jhydrol.2012.07.024
[14] Dinku, T. (2019). Challenges with availability and quality of climate data in Africa. Extreme Hydrology and Climate Variability, 71-80. https://doi.org/10.1016/B978-0-12-815998-9.00007-5
[15] Alonso, B., Guillermo, T., René, G. (2018). Alternative approaches for estimating missing climate data: Application to monthly precipitation records in South-Central Chile. Forest Ecosystems, 5: 28 https://doi.org/10.1186/s40663-018-0147-x
[16] Mann, H.B. (1945). Non-parametric test against trend. Econometrica, 13(3): 245-259. https://doi.org/10.2307/1907187
[17] Kendall, M.G. (1975). Rank Correlation Methods, 4th edition. Charles Griffin, London, U.K.
[18] Tesemma, Z.K., Mohamed, Y.A., Steenhuis, T.S. (2010). Trends in rainfall and runoff in the Blue Nile Basin: 1964-2003. Hydrol. Process, 24(25): 3747-3758. https://doi.org/10.1002/hyp.7893
[19] Tekleab, S., Mohamed, Y., Uhlenbrook, S. (2013). Hydro-climatic trends in the Abay/upper Blue Nile basin, Ethiopia. Physics and Chemistry of the Earth, Parts A/B/C, 61-62: 32-42. https://doi.org/10.1016/j.pce.2013.04.017
[20] Farlie, D.J.G. (1971). Rank correlation methods-Kendall. Mg. J. R. Stat. Soc. Ser. General, 134(4): 682. https://doi.org/10.2307/2343668
[21] Sen, P.K. (1968). Estimates of the regression coefficient based on Kendall's tau. J. Am. Stat. Assoc., 63: 1379-1389. https://doi.org/10.1080/01621459.1968.10480934
[22] Khattak, M.S., Babel, M.S., Sharif, M. (2011). Hydro-meteorological trends in the upper Indus River basin in Pakistan. Clim Res., 46: 103-119 https://doi.org/10.3354/cr00957
[23] Abiot, K., Dwarakish, G.S. (2020). Trend and variability of hydrometeorological variables of Tikur Wuha watershed in Ethiopia. Arabian Journal of Geosciences, 13: 142. https://doi.org/10.1007/s12517-020-5139-9
[24] Zannat, F., Islam, A.R.M., Rahman, M.A. (2019). Spatiotemporal variability of rainfall linked to ground water level under changing climate in northwestern region. Bangladesh, Eur. J. Geosc., 01(01): 35-56. https://doi.org/10.34154/2019-EJGS-0101-35-56/euraass
[25] Hare, F.K. (1983). Climate and Desertification. Revised analysis (WMO-UNDP). WCP-. Geneva, Switzerland, 44: 5-20.
[26] Suryabhagavan, K.V. (2017). GIS-based climate variability and drought characterization in Ethiopia over three decades School of Earth Sciences. Addis Ababa University, P.O. Box 1176, Addis Ababa, Ethiopia. Weather and Climate Extremes, 15: 11-23 http://dx.doi.org/10.1016/j.wace.2016.11.005
[27] Lu, G.Y., Wong, D.W. (2008). An adaptive inverse-distance weighting spatial interpolation technique. Comp. Geosc. J., 34(9): 1044-1055. https://doi.org/10.1016/j.cageo.2007.07.010
[28] Zannat, F., Islam, A.R.M., Rahman, M.A. (2019). Spatiotemporal variability of rainfall linked to ground water level under changing climate in northwestern region, Bangladesh. Eur. J. Geosc., 01(01): 35-56. https://doi.org/10.34154/2019-EJGS-0101-35-56/euraass
[29] Seleshi, Y., Zanke, U. (2004). Recent changes in rainfall and rainy days in Ethiopia. International Journal of Climatology, 24: 973-983. https://doi.org/10.1002/joc.1052
[30] Diro, G.T., Black, E., Grimes, D.I.F. (2008). Seasonal forecasting of Ethiopian Spring rains. Meteorol. Appl., 15: 73-83. https://doi.org/10.1002/met.63
[31] Belete, M., Bernd, D., Jackson, R. (2015). Characterization of water level variability of the main ethiopian rift valley lakes. Hydrology, 3(1): 1. https://doi.org/10.3390/hydrology3010001
[32] Korecha, D., Barnston, A.G. (2007). Predictability of june-september rainfall in Ethiopia. Monthly Weather Review, 135(2): 628-650. https://doi.org/10.1175/MWR3304.1