Olumuyiwa Olusola Falowo* | Olayemi Olajumoke Ojo | Abayomi Solomon Daramola
© 2020 IIETA. This article is published by IIETA and is licensed under the CC BY 4.0 license (http://creativecommons.org/licenses/by/4.0/).
OPEN ACCESS
The purpose of this study is to determine hydraulic properties of groundwater in central area of Ondo State using pumping test. The data obtained from area during pumping test sessions which lasted for a period of 7-12 hours for a total of 76 boreholes. The total depth of the drilled boreholes vary from 8.7 m to 50.0 m and an average depth of 27.9 m. The installation depths of the boreholes vary from 8.5 m to 49.7 m, with a mean depth of 26.8 m. The thickness of the aquifer units/screen length is between 2.3-26 m. The results indicate yield capacity (17.28-110.59 m³/d), hydraulic conductivity (0.1382-48.1210 m/d), transmissivity (2.4705-221.3568 m²/d), storage coefficient or storativity (0.000069 to 0.007496). All the determined hydraulic properties are generally uniform in the area. The generated groundwater potential map shows that most parts (60%) of the area are characterized by fair aquiferous units in terms of their properties. Consequently the result is suggestive of fair water bearing unit and capable of providing a reasonable satisfying and quantifiable amount of water for domestic uses. The findings of this research may serve as baseline information for groundwater exploitation and development in the area.
aquiferous units, boreholes, drilling, groundwater, prolific, pumping test, sustainability
Groundwater is a replenishable but finite resource [1]. It is a part of the water cycle. Groundwater resources in the aquifer gets seasonally recharged and discharged through rainfall and other sources which is reflected in the water level fluctuations. Below this zone of water level fluctuations, the aquifers remain perennially saturated. Excessive withdrawal of groundwater may lead to depletion of ground water storage which may have serious social, economic, and environmental consequences [2]. People’s lives and livelihoods depend on water. Demand for clean water increases continually in line with world population growth. People in many areas of the world lack the fresh, drinkable water essential to their survival; if they are to prosper, more secure and low cost water supplies are needed. Maintaining secure water supplies for drinking, industry and agriculture would be impossible without groundwater, the largest and most reliable of all freshwater resources [3].
In many areas most drinking water is groundwater - up to 80% in Europe and Russia, and even more in North Africa and the Middle East. Unlike other natural resources or raw materials, groundwater is present throughout the world [4]. Possibilities for its abstraction vary greatly from place to place, owing to rainfall conditions and the distribution of aquifers (rocks, sand layers and so on, in whose pore spaces the groundwater fills). Generally, groundwater is renewed only during a part of each year, but can be abstracted year-round. Provided that there is adequate replenishment, and that the source is protected from pollution, groundwater can be abstracted indefinitely [3]. Therefore, historically there has always been an attempt to define the exploitable quantity of groundwater resources i.e. the volume of groundwater which is authorized for withdrawal. Sustainable development and management of ground water resources necessitates assessment of availability of groundwater, and its hydraulic characteristics. Two prominent concepts developed to define the exploitable groundwater resources. These are safe yield and sustainable yield [5-8]. Historical perspective confirms that both safe yield and sustainable yield are evolving concepts. Lee [8] defined safe yield as the limit to the quantity of water which can be withdrawn regularly and permanently without dangerous depletion of the reserve. Todd [9] defines the safe yield as the amount of groundwater that can be withdrawn from a groundwater basin without producing an undesired result. Any withdrawal in excess of safe yield is an overdraft. Several other attempts have been made to define Safe Yield [3, 10]. This led to the emergence of the concept of sustainable yield. Sustainable yield reserves a fraction of safe yield for the benefit of the surface waters. Sustainability implies the attainment of a new dynamic equilibrium under conditions of widespread development [11]. For equilibrium to occur withdrawals from the aquifer must induce either additional recharge to the aquifer, reduced discharge from the aquifer, or both. This occurs by increasing the hydraulic gradient into the aquifer when the hydraulic head within the aquifer is decreased. These decreases will continue until changes in recharge and discharge balance withdrawals from the aquifer. The most direct evidence of this new balance is long-term stability of hydraulic heads in the aquifer. The sustainable yield depends on the rate at which the hydraulic head decrease propagates through the aquifer to the recharge or discharge area [11]. The closer the pumping centers are placed to either the recharge or discharge areas, the more likely it is that additional recharge or reduced discharge can be realized by withdrawals.
This report provides information on the hydraulic parameters in order to characterize the water bearing units in the study area to different hydrogeological zones for effective sustainability, planning and development of groundwater resource.
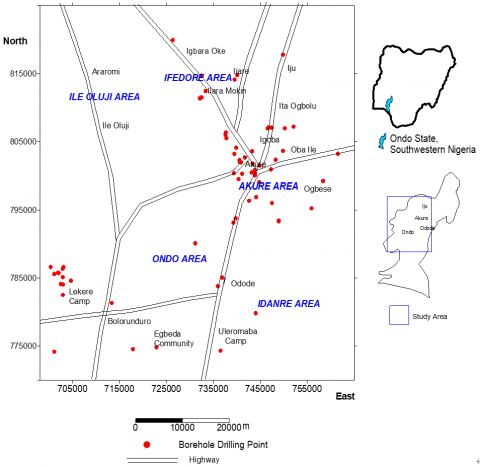
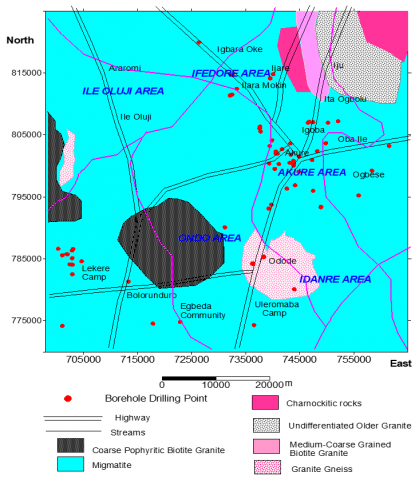
Represented in universal traverse mercator (UTM), the study area is located between latitudes 775000 and 815000 mN and longitudes 695000 and 765000 mE in the central part of Ondo State, Southwestern Nigeria (Figure 1). It is bounded by Ekiti and Kogi States to the North; Osun and Ogun States to the West; Edo State to the East; and, Delta State and the Atlantic Ocean adjoins the southern portion. Geologically, the lithological units in the study area include migmatite, granite gneiss, quartzo-feldspathic gneiss, undifferentiated older granite, medium - coarse - porphyritic biotite granite and charnokitic rocks (Figure 2). The granitic rocks consist of quartz, feldspar and biotite and/or tourmaline. The age of the granites ranges from lower to upper triassic while the metasedimentary is thought to be upper paleozoic [12].
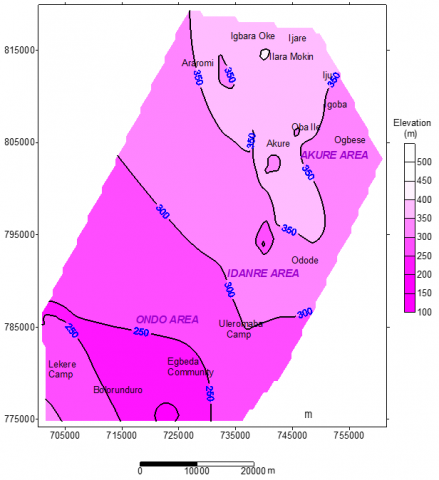
The region which lies within the tropical rainforest of Nigeria is characterized by two distinct seasons (wet from March to October and dry from November to February). The annual mean rainfall is about 1800 mm, while the annual mean temperature ranges between 24°C and 27°C [13]. The topography elevation varies between 180 m and 410 m above the sea level (Figure 3). Regolith and fractured basements generally occur in a typical basement terrain [14, 15]. In tropical and equatorial regions, weathering processes create superficial layers with varying degrees of porosity and permeability. Studies have shown that the unconsolidated overburden could constitute reliable aquifer if significantly thick [16, 17]. In addition, the concealed basement rocks may contain highly faulted and folded areas, incipient joints and fracture systems derived from multiple tectonic events that they have experienced. These structures may house abundant groundwater in a typical basement setting [18, 19]. The detection and delineation of such structures that are diagnosed by lineaments may facilitate the identification of prospective groundwater zones [15].
Figure 1. Map of the study area showing the borehole drilling points
Figure 2. Geological map of the study area. Modified after [20]
Figure 3. Topographical map generated from geographical positioning system (GPS) in the study area
Seventy six boreholes data used for this study were obtained from the completion report of the drilled boreholes prepared by Ondo State Water Corporation, Ondo State, Southwestern Nigeria. The information covers the different geologic units such as schist, migmatite, granite, gneiss, granite gneiss, and quartzite (Figure 2). Data such as the borehole depth, aquifer thickness, and material composition of the aquifer units, were information were deduced from the lithological logs of 76 boreholes drilled in the study area. These data were analyzed alongside the information gathered during the pumping test at each site which include borehole yield, drawdown values, static water level, and pumping rate. Pumping tests were performed in the borehole/wells in order to estimate the transmissivity, hydraulic conductivity and storability of the overburden aquifers [21]. During testing a 1.0-hp submersible pump with a check valve and a 19-mm diameter discharge line was used. The flow rate was measured using a flow meter. The pumped water was discharged 30-m from the test well. Data loggers were used to monitor water levels in pumping and observation wells. Periodic water level measurements were also recorded with a depth-to-water level meter. The pumping test lasted for a period of between 7 to 12 hours depending on the time at which the individual borehole been pumped achieved equilibrium, with the pumping rate ranging between 5 and 70 lpm which depends on the yield of the pumping well (aquifer unit) and on the borehole response to water abstraction [22].
The information on the borehole yields and their corresponding drawdowns were substituted in the Logan [23] empirical relation, which is an approximation of Theim’s equation, given by Eq. (1), for hydraulic conductivity.
$K=\frac{1.22 Q}{h s}$ (1)
The transmissivity is obtained from Eq. (2);
$T=K h$ (2)
where;
K = hydraulic Conductivity (m/s)
Q = yield of borehole or well discharge (l/s)
h = thickness of aquifer or screen length used (m)
s = recorded maximum Drawdown in the pumping well
T = transmissivity (m²/s)
Fetter [24] gave Eqns. (3) and (4) for determination of storability of wells:
$h_{o}-h=\frac{15.3 Q W_{u}}{T}$ (3)
and,
$\mathrm{S}=\frac{T t u}{360 r^{2}}$ (4)
u=argument in the solution of the differential equation of the confined flow of water in the aquifer
h0-h=s=Drawdown
r=Radial distance of the pumping well
Wu = Well function
S = Storability
t = Time of pumping
Using Eq. (3) the value of the well function Wu was obtained and the equivalent value u, obtained from the table and this enabled the computation of S using Eq. (4).
The specific storage SS is obtained from the Eq. (5):
$\mathrm{S}=S_{S} h$ (5)
The specific capacity of the wells Sc was determined using Chatter-Jee [4] formula in Eq. (6):
$S_{C}=2.73 \mathrm{Kh} \frac{1}{\log _{10}^{2 / r}}$ (6)
Eq. (6) can be modified by correct substitutions to give Eq. (7):
$S_{c}=0.85 \mathrm{Kh}$ (7)
4.1 Hydraulic parameters
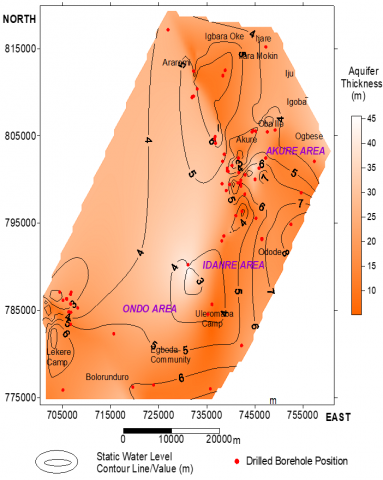
The summary of the measured hydrogeological parameters during the pumping test is presented in Figures 4 to 6. The total depth of the drilled boreholes vary from 8.7 m (due to shallow depth to basement rock in Ondo west local government area) to 50.0 m (due to deep depth of weathering in Atosin Idanre) and an average depth of 27.9 m. The installation depth of the boreholes vary from 8.5 m to 49.7 m, with a mean depth of 26.8 m. The thickness of the aquifer units/screen length in the study area is between 2.3-26 m and average of 7.7 m. The average static water level was 4.8 m (Figure 4). Based on the values recorded from the observable wells, the drawdown ranges between 0.6 and 32 m. The highest drawdown value was obtained from Ogbese town, as the wells in the area are recharged by river Ogbese and its tributaries. The volume of water discharged through the well per unit time is called its yield. Each well will yield only a specific quantity of water per unit time depending upon the characteristics of the aquifer and design elements of the well.
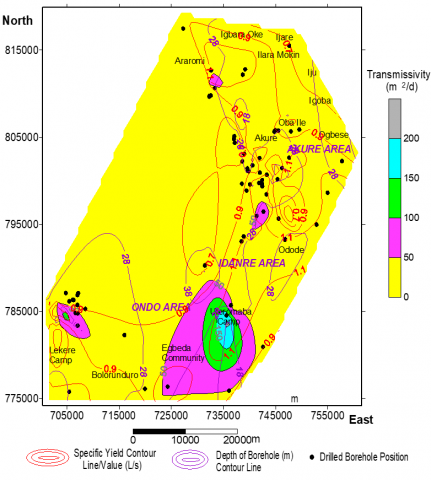
Porosity is one of the principal factors determining the specific yield or water bearing qualities of an aquifer. Only porous rock or soil material can be aquifers but high porosity itself is not sufficient to ensure water-yielding capacity [25]. The yield capacity of the aquifer units varies between 17.28-110.59 m³/d. These highest and lowest yield values were obtained from aquifers of granite and migmatite parent rocks. An average yield value of 81 m³/d was obtained for the area, which is suggestive of fair water bearing unit which is capable of providing a reasonable satisfying and quantifiable amount of water for domestic usage. Figure 5 shows the distribution of the yield values for different aquiferous units in the study area, and vary from 0.2 to 1.28 L/s, and an average of 0.95 L/s, indicative of fair aquifer unit. However, relative high yield values above 1.0 L/s are found in Idanre area.
Permeability is the ability of soil or rock to allow the passage of fluids into or through it without impairing its structure [26]. In ordinary hydraulic usage, a substance is termed permeable when it permits the passage of a measurable quantity of fluid in a finite period of time, and impermeable when the rate at which it transmits that fluid is slow enough to be negligible under existing temperature-pressure conditions [27]. The flow through a unit cross section of material is modified by temperature [28], hydraulic gradient and the coefficient of permeability. The latter is affected by the uniformity and range of grain size, shape of the grains, stratification, the amount of consolidation and cementation undergone, and the presence and nature of discontinuities. The permeability of a particular material is defined by its coefficient of permeability or hydraulic conductivity (K) as shown in Table 1.
Figure 4. Spatial variation of aquifer thickness and their corresponding static water level recorded from the individual borehole in the study area
Figure 5. Map showing the distribution of the aquifer yield, their corresponding transmissivity, and the depth to the aquifers
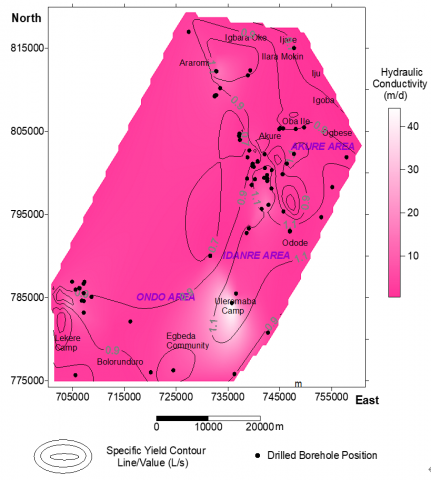
Figure 6. Spatial variation of hydraulic conductivity in the area
The quantitative measurement of flow or water of an aquifer is generally expressed by its Hydraulic conductivity, which is defined as the flow velocity per unit hydraulic gradient. The hydraulic conductivity calculated for the area ranges between 0.1382-48.1210 m/d, and average of 4.5487 m/d. The K-values are nearly uniform in the area except at Uleromaba representing Idanre Area which shows relatively high value above 30 m/d (Figure 6). This area is also characterized by high water yield. Using Tables 2, the aquifer units in the area fall within the semi-permeable class with K-value of 10 - 0.1 m/d. The aquifer is dominantly fine sand consolidated material.
The values of transmissivity (Figure 5) derived from the area range between 2.4705 – 221.3568 m²/d, while the average is 28.1690 m²/d. Seventy Five percent (75%) of the study area is dominated by transmissivity in the range of 0 – 50 m²/d, while around the south eastern part, high transmissivity values are recorded (above 50 m²/d) with high water yield. Also pockets of high transmissivity closures are sporadically spotted in places. The pumping test duration between seven and twelve hours shows that the aquifers in the area attained equilibrium within a short period which can be attributed to Transmissivity of the aquifer material especially for the high yielding units.
The storage coefficient or storativity (S) of an aquifer has been defined as the volume of water released from or taken into storage per unit surface area of the aquifer, per unit change in head normal to the surface [29]. It is a dimensionless quantity [27]. Changes in storage in an unconfined aquifer represent the product of the volume of the aquifer, between the water table before and after a given time, and the specific yield. Indeed, the storage coefficient of an unconfined virtually corresponds to the specific yield as more or less all the groundwater is released from storage by gravity drainage and only an extremely small part results from compression of the aquifer and the expansion of water. However, in confined aquifers, water is not yielded simply by gravity drainage from pore space because there is no falling water table and the material remains saturated. Hence, other factors are involved regarding yield, such as consolidation of the aquifer and expansion of groundwater consequent upon lowering of the piezometric surface. Therefore, much less water is yielded by confined than unconfined aquifers [27]. The storage coefficient or storativity (S) calculated for all the aquifer units in the study area is fairly uniform and ranges from 0.000069 to 0.007496, and an average of 0.000974. This agrees with the standard value, S$\leq$ 0.005 [24].
Table 1. Order of magnitude of K for different kinds of rock [27]
|
Geological Classification |
K (m/d) |
|
Unconsolidated Materials |
|
|
Clay |
10-8-10-2 |
|
Fine sand |
1-5 |
|
Medium sand |
5–2*101 |
|
Coarse sand |
2*101-102 |
|
Gravel |
102-103 |
|
Sand and gravel mixes |
5-102 |
|
Clay, sand, gravel mixes |
10-3-10-1 |
|
Rock |
|
|
Sandstone |
10-3-1 |
|
Carbonate rock with secondary porosity |
10-2–1 |
|
Shale |
10-2-1 |
|
Dense solid rock |
<10-5 |
|
Fractured weathered rock (Core samples) |
Almost 0-3×10² |
|
Volcanic rock |
Almost 0-103 |
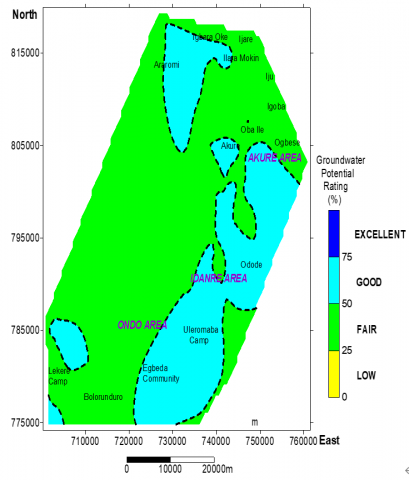
Figure 7. Groundwater potential map of the study area showing a predominant fair-rating
Table 2. Classification of water bearing geological units based on coefficient of permeability [30]
|
Class |
K (m/d) |
Examples |
|
Extremely permeable |
>10 |
Coarse sandstone, limestone and fissured crystalline rocks, pebbles, gravels |
|
Semi-permeable |
10-0.1 |
Fine grained sands, loams, slightly jointed crystalline rocks |
|
Impermeable |
<0.1 |
Clays, marls, compact igneous rocks |
Table 3. Multi-criteria evaluation parameters for groundwater potential of the study area
|
S/N |
Parameter |
Attribute |
Rating |
Weightage (%) |
|
1 |
Yield (L/s) |
0-1 1-2 >2 |
5 15 25 |
25 |
|
2 |
Transmissivity (m²/d) |
0-50 50-100 100-300 |
5 15 25 |
25 |
|
3 |
Hydraulic Conductivity (m/d) |
<1 1-5 5-100 100 - 1000 |
5 10 20 25 |
25 |
|
4 |
Storativity |
<0.005 0.005- 0.0005 0.0005- 0.00005 |
1 15 25 |
25 |
The groundwater evaluation or assessment of an area can be based on the characteristic aquifer borehole hydrogeological information. The groundwater yield, transmissivity, hydraulic conductivity, and storativity of boreholes can be used as an index for the assessment of groundwater potential of an area.
Therefore in order to generate groundwater potential map, the specific yield, hydraulic conductivity, transmissivity values and storativity were integrated to generate a groundwater potential map for study area. The data sets were imported into Surfer 13 software for storage followed by the allocation of weights to each parameter (Table 3) and different scores to each attributes within the parameter. Figure 7 shows the generated groundwater potential map for the study area. The map classifies the study area into different groundwater potential zones as low (0-25 %), fair (25-50 %), good (50-75 %), and excellent (75-100 %). Most parts (60 %) of the study area are characterized by fair potential water bearing units and cut across the entire parts of the study area. The Good groundwater potential areas accounted for the remaining 40%. Areas with good groundwater potential are prolific groundwater zones and are recommended for drilling or groundwater exploitation and development.
Reliable values of the hydraulic characteristics of the geological formations through Pumping tests have proved to be one of the most effective ways to determine and characterize the aquifer units of an area. This study has helped to provide data on the aquifer hydraulic conductivity, transmissivity, specific yield, and storativity. These parameters or aquifer properties were integrated to define and evaluate their potential groundwater accumulation and development. Findings show that most parts (60%) of the study area are characterized by fair aquiferous units in terms of their characteristics, which invariably would be prolific for groundwater exploitation and development, judging from their hydraulic properties. However it is recommended that further geophysical methods and remote sensing approach should also be used to substantiate and corroborate the findings of this research especially in remote areas.
The authors acknowledge the support received from Ondo State Water Corporation, Akure, Ondo State, Nigeria.
[1] Walton, W.C. (1970). Groundwater Resource Evaluation. McGraw Hill, New York.
[2] Todd, D.K., Mays, L.W. (2004). Groundwater Hydrology. Third Edition. Wiley, New York.
[3] Freeze, R.A., Cherry, J.A. (1979). Groundwater. Prentice-Hall, Englewood Cliffs, New Jersey.
[4] Chatterjee, A.K. (2005). Water Supply, Waste Disposal and Environmental Engineering. 7th Edition. Khanna Publishers: Delhi, India, 59-82.
[5] Robins, N.S. (1998). Groundwater Pollution, Aquifer Recharge and Vulnerability, Special Publication No. 130. Geological Society, London.
[6] Israil, M., Al-hadithi, M., Singhal, D.C., Kumar, B. (2006). Ground water recharge estimation using a surface electrical resistivity method in the Himalayan foothill region, India. Hydrogeology Journal, 14: 44-50. https://doi.org/10.1007/s10040-004-0391-8
[7] Ting, C.S. (1993). Groundwater resources evaluation and management studies for the Pingtung Plain, Taiwan. National Science Council, National Pingtung Polytechnic Institute and Faculty of Earth Sciences, Free University, Amsterdam, 87 pp.
[8] Lee, C.H. (1915). The determination of safe yield of underground reservoirs of the closed basin type. Trans Am Soc Civil Eng, 78: 148-151.
[9] Todd, D.K. (1980). Groundwater Hydrology. 2nd edition, John Wiley, New York, 535 pp.
[10] Domenico, P. (1972). Concepts and Models in Groundwater Hydrology. McGraw-Hill, New York.
[11] Alley, W.M., Leake, S.A. (2004). The journey from safe yield to sustainability. Groundwater, 42(1): 12-16. https://doi.org/10.1111/j.1745-6584.2004.tb02446.x
[12] Gobbet, D.J., Hutchison, C.S. (1973). Geology of the Malay Peninsula (West Malaysia and Singapore). Wiley-Interscience, New York, London, Sydney, Toronto.
[13] Iloeje, N.P. (1981). A New Geography of Nigeria. Longman Publisher Nigeria, pp. 201.
[14] Odusanya, B.O., Amadi, U.N.P. (1990). An empirical resistivity model for predicting shallow groundwater in the basement complex water resources. Journal of Nigeria Association of Hydrogeologists, 2: 77-87.
[15] Mogaji, K.A., Aboyeji, O.S., Omosuyi, G.O. (2011). Mapping of lineaments for groundwater targeting in the basement complex region of ondo state, nigeria, using remote sensing and geographic information system (GIS) techniques. International Journal of Water Resources and Environmental Engineering, 3(7): 150-160.
[16] Satpathy, B.N., Kanungo, B.N. (1976). Groundwater exploration in hard rock terrain- a case study. Geophys. Prospect, 24(4): 725-763. https://doi.org/10.1111/j.1365-2478.1976.tb01569.x
[17] Bala, A.N., Ike, E.C. (2001). The aquifer of the crystalline basement rocks in Gusau area, North-western Nigeria. Journal of Mining Geology, 37(2): 177-184.
[18] Rahaman, M.A. (1976). Review of the Basement Geology of Southwestern Nigeria. In: Geology of Nigeria. Kogbe, C.A. (ed). Elizabethan Publishing: Lagos, Nigeria.
[19] Rahaman, M.A. (1973). The geology of the district around Iseyin, western State, Nigeria. Ph.D. Thesis University of Ibadan (Unpublished), pp. 268.
[20] Nigeria Geological Survey Agency (NGSA), (2006). Published by the Authority of the Federal Republic of Nigeria.
[21] Brassington, R. (1988). Field Hydrogeology. Wiley, Chichester, 926pp.
[22] Assaad, F., LaMoreaux, P.E., Hughes, T. (2004). Field Methods for Geologists and Hydrogeologists. Springer, Berlin.
[23] Logan, J. (1964). Estimating transmissivity from routine production tests of water wells. Groundwater, 2(1): 35-37. https://doi.org/10.1111/j.1745-6584.1964.tb01744.x
[24] Fetter, C.W. (2007). Applied Hydrogeology, 2nd Edition. C.B.S. Publishers & Distributors: New Delhi, India, 161-201, 550.
[25] Schwartz, F.W., Zhang, H. (2003). Fundamentals of Ground Water. Wiley, New York.
[26] Bisson, R.A., Lehr, J.H. (2004). Modern Groundwater Exploration. Wiley, New York.
[27] Bell, F.G. (2007). Engineering Geology, Second Edition. Elsevier, 581pp.
[28] Bentley, R.E. (1998). Handbook of Temperature Measurement Vol. 3: The Theory and Practice of Thermoelectric Thermometry. Springer Science & Business Media.
[29] Verruijt, A. (1970). The Theory of Groundwater Flow. Macmillan, London.
[30] Singh, P. (2008). Engineering and General Geology. 8th Revised Edition, S.K. Kataria & Sons, New Delhi, 591pp.