Wondimu Tadiwos Hailesilassie* | Tenalem Ayenew Tegaye
OPEN ACCESS
The Ethiopian Rift Valley Lakes Basin consists of chain of lakes, many feeder streams and wetlands with unique hydrological and ecological characteristics having regional and global environmental importance. With growing population and consequent various human activities and degradation of watersheds aggravated by climatic change, the water quality of rivers and lakes and feeder rivers are deteriorating fast. The purpose of this study is to assess physico-chemical water quality parameters in two of relatively fresh water lakes (Ziway and Hawassa) which are occupying in the Central Main Ethiopian Rift floor. These parameters are pH, dissolved oxygen (DO), total dissolved solids (TDS), turbidity (NTU), Electrical conductivity (EC), and fluoride ion concentration(F-). The mean values of those physico-chemical parameters were compared with maximum permissible limit (MPL) for drinking water as standardized by the Ethiopian Ministry of Health (MoH) and the World Health Organization (WHO). The result revealed that most of the parameters show clear deterioration over the last few decades. The likely factors are rapid urbanization, sedimentation, excessive use of fertilizers and industrialization in towns established along their shorelines. Hence, these trends demand immediate intervention to avert the grave environmental consequences.
environmental change Ethiopian rift, water quality, Hawassa, Ziway
Lakes and surface water reservoirs are considered as one of the planet’s most important freshwater resources and provide innumerable benefits. Lakes are stagnant surface water bodies, receive and stores rain fall water and from feeder streams and overland flow. The entire life of the world depends on water and therefore the hydrological study is very essential to comprehend the relationship among its diverse trophic levels and food webs [1].
Garn et al. [2] examined that lakes are subject to a variety of physical, chemical, and biological problems that can diminish their aesthetic beauty, recreational value, water quality, and habitat suitability. A study by Babu and Mohan [3] noted that the physio-chemical analysis is the prime consideration to assess the quality of water for its best utilization like drinking, irrigation, fisheries, and industrial purpose.
Although the availability of different constituents in water has to be analyzed regularly to confirm its suitability for different purposes [4], the Ethiopian Rift Valley Lakes Basin consists of chain of lakes, streams and wetlands with unique hydrological and ecological characteristics. With an expansion of human activity, population, pressure, and a changing climate, water quality of lakes have been reported to be deteriorating in the recent past [5-8].
Lakes are surface waters which are vulnerable to pollution due to its easy accessibility for disposal of pollutants and wastewater [9]. Anthropogenic forces drive degradation of lake water quality in Ethiopia. Urbanization, industry, agriculture, and deforestation are the major anthropogenic drivers of many more specific processes [10-12]. As a result of lake degradation there are immediate impacts on human and natural health, as well as secondary or tertiary consequences as a result of decreased productivity and resource levels [13].
According to the Rift Valley Lakes Basin (RVLB) Master Plan Study Project which was carried out by the former Ethiopian Ministry of Water Resources (MoWR), the water quality analysis results for Ziway Lake in 2007 indicated that Lake Ziway was fresh and very good and can meet the quality requirements standards set for most of water uses such as drinking, irrigation, bathing and animal watering. The water is slightly alkaline and fresh [14], in addition to this, water quality of Lake Hawassa in the same year with the exception of the fluoride and pH value other quality parameters were within the WHO drinking water quality guideline values [14].
Recent studies on Lake Ziway showed that the lake is highly polluted due to various anthropogenic activities around the lake system, for instance, the recent studies showed that, there are intensive use of fertilizers for large- and small-scale irrigation practices in its watershed [8, 15]. Furthermore, floriculture development around Lake Ziway uses extremely high fertilizer. Large flower farms maintain a year-round production of cut-flowers and use the lake excessively [8]. The urban effluents from the city of Hawassa influenced Lake Hawassa significantly [11]. Other factors that influence Lake Hawassa include effluents of various factories like Hawassa Textile Factory, soft drink factory, ceramic factory and sewage as well as Hawassa Referral Hospital effluents [7]. The effect of the new large Industrial Park established not far from the lake remains to be seen.
This study does not include a detailed account of hydrochemical changes. Particularly it refers few parameters to indicate the changes that has been considered as indicative and visibly displaying the alarming situation.
The study focuses on the most usable relatively fresh lakes of Ziway and Hawassa. Other lakes are brackish or salty in nature in the central rift valley. These are the only lakes in the region that can be utilized for common water uses. The study is expected to create awareness of the environmental changes for water resources planners, decision makers and the local community.
2.1 Study area
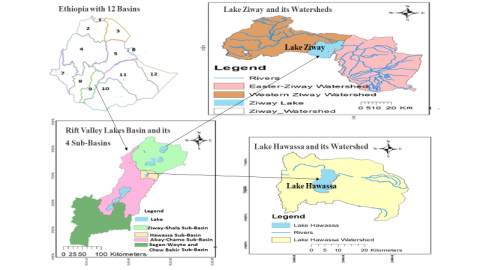
According to a study conducted by the then [14], Rift Valley Lakes Basin (RVLB) is one of the twelve Basins of Ethiopia (Figure 1) with a total basin area of 53,000 km2. It is divided into four sub-basins described by their main lakes systems, the first comprising lakes Ziway, Abijata and Langano and Shalla (usually called Ziway-Shala basin), the second Lake Hawasa, the third lakes Abaya and Chamo and the fourth Chew Bahir. As indicated in Figure 1. This study focused on Lakes Ziway and Hawassa which are located in the middle of the central Main Ethiopian Rift floor.
Figure 1. Location map of the study area showing Lakes Ziway and Hawassa and their Watersheds and Rivers
2.1.1 Lake Ziway
The freshest Lake Ziway is fed by Ketar and Meki Rivers that drain from the Eastern Arsi and Western Gurage highlands, respectively. Lake Ziway empties its water in to Lake Abijata through the Bulbula River. The lake’s water level has declined over the past few decades as a result of water diversion from the two main feeder rivers for irrigation, as well as direct pumping from the lake. It also is one of the main sources of commercial fish farming in Ethiopia [10]. In addition, Ziway Lake is the most fresh water lake comparing with the other lakes in Rift Valley [14]. It is the only lake in the entire rift valley that is used for irrigation and municipal water supply purpose.
2.1.2 Lake Hawassa
As compared to all Ethiopian rift lakes, Hawassa lake is located at the highest topographic position. It is a terminal lake without any surface outflow. But its freshness comes as a result of leakage in the subsurface in to Lake Shala [11]. The inhabitants depend on the lake for fishing and recreation [16]. The lake receives only one perennial river from the eastern escarpment, TikurWuha River that originate from Cheleleka wetland in the immediate north of the lake [14].
2.2 Data and method
This study dominantly used secondary data sources. The data have been collected from published and unpublished reports and the works of the authors. The quality of water can be determined by its physical, chemical and biological characteristics. In this paper, only physio-chemical parameters of water are accounted which are crucial to get an idea about the quality changes in the last few decades.
Physico-chemical water quality parameters assessed in this study are: dissolved oxygen (DO), fluoride ion concentration(F-), pH, Electrical conductivity (EC), total dissolved solids (TDS), and turbidity (NTU). They were compared with the maximum permissible limits (MPL) which were standardized by Ethiopian Ministry of Health (MoH) [17] and World Health Organization (WHO) [18]. The values of those physico-chemical parameters in different years are presented in Table 1. The MPL which were standardized by Ethiopian MoH and WHO [17, 18], are located at the bottom of Table 1.
Table 1. Physico-chemical water quality parameters
|
Parameter |
Ziway Lake |
Hawassa Lake |
Sampling year and References |
|
Dissolved oxygen (DO) |
6 |
6.7 |
2007 [14] |
|
7.41 |
16.7 |
2015 [7, 8] |
|
|
pH |
8.9 |
8.8 |
1964 [16] |
|
8.68 |
9 |
2007, 2008 [11, 14] |
|
|
8.5 |
9.17 |
2015, 2019 [19, 20] |
|
|
F- |
1.51 |
7.65 |
2007 [14] |
|
2.8 |
12.1 |
2008, 2015 [7, 21] |
|
|
Total Dissolved solid (TDS) (mg/l) |
220 |
424 |
2007 [14] |
|
433.5 |
472.5 |
2015 [7, 8] |
|
|
Electrical Conductivity (EC) (µS/cm) |
388 |
846 |
2000 [22] |
|
474 |
1851.4 |
2015, 2019 [19, 20] |
|
|
Turbidity (NTU) |
40 |
15 |
2007 [14] |
|
163.5 |
11.5 |
2015 [7, 8] |
* Ethiopian MoH and WHO MPL standard for DO=8, pH=6.5-8.5, F--= 1.5 (recently revised to 3 mg/l for Ethiopian standard), TDS=1000, EC=1000, Turbidity=5
3.1 Dissolved oxygen (DO)
In surface waters like lakes, DO is a direct indicator of the suitability of water for aerobic aquatic life and an indirect indicator of organic pollution and sewage discharge [14]. It is essential for water quality, ecological status, productivity and health of a lake. This is due to its importance as a respiratory gas, and its use in biological and chemical reactions.
When assessing DO for Lake Hawassa (Table 1) based on the samples analyzed in 2007, the value of DO was 6.7 [14], but when compared this value with the results obtained by Praveen and Mukemil [7], in 2015 the value has risen to 16.9. Unlike Lake Hawassa, the dissolved oxygen in Ziway Lake does not show much change as indicated in Table 1. In fact, the level of DO very much depends on depth and position of sampling. It should be noted that the samples have been collected on the surface and close to the shorelines.
3.2 pH
pH value of water indicates the hydrogen ion concentration in water. It measures acidity and alkalinity of water. The pH is an index of the hydrogen ion concentration[H+] in water. The [H+] affects most chemical and biological processes; thus, pH is an important variable in water quality endeavors [23].
The pH values for the two lakes were analyzed in various years. As indicated in Table 1, the mean values of pH for Ziway Lake is in the range of MPL Ethiopian [17] and WHO standard [18], but a study by Teklu et al. [19], the maximum values stretched to 9.0. In all years (Table 1), Lake Hawassa is not within the range of MPL.
3.3 Fluoride Ion (F-)
Low concentrations of fluoride (< 1 mg/l) strengthen tooth enamel and bones in mammals but skeletal fluorosis and dental decay may occur with exposure to intermediate fluoride concentrations (>1.5 mg/l) over long periods. The Rift Valley region of Ethiopia is characterized by higher level of fluoride specially groundwater [14, 21]. Desirable limit for fluoride is 1 and 1.5 mg/l in permissible limit [17, 18], but recently revised to 3 mg/l for Ethiopian Standard. However, over ten million people are affected by high fluoride in the Ethiopian rift [21].
As indicated in Table 1, the fluoride ion concentration for Lake Hawassa is higher than Lake Ziway as it is closed. In addition to this, fluoride ion concentration for Lake Hawassa in a year 2015 is very high compared to the 2007 value. For Lake Ziway, fluoride ion concentration in 2007 showed nearly in the range of the given criteria of WHO [18] and Ethiopian standard [17]. One of the main problems for Lake Hawassa as a drinking water is the increment of fluoride ion concentration [6, 7, 14]. The rural villages in the eastern shore of the Lake Hwassa sometimes use it for drinking which is still a big problem.
3.4 Total dissolved solid (TDS)
TDS is determined by measuring the number of dissolved ions in the water. According to the study conducted by Rachna and Disha [24], fertilizers from fields can add a variety of ions to a lake. Organic matter from wastewater treatment plants may contribute higher levels of nitrate or phosphate ions. If TDS levels are high, especially due to dissolved salts, many forms of aquatic life are affected. From the results in Table 1, it can be observed that the TDS value for both lakes increased over the years. This may be due to the increasing of anthropogenic activities around the lakes, i.e. excessive use of fertilizers from their catchments and possibly various municipal effluents and organic matter from wastewater treatment plant from various industries around the lakes [7, 8].
3.5 Electrical Conductivity (EC)
The conductivity of water is a measure of capacity of a solution to conduct electrical current through it and depends on the concentration of ions and load of nutrients. As most of the salts in water are present in ionic forms, they make water capable for conducting current [25].
In Table 1, it can be observed that the values EC for both lakes are increasing, furthermore, a study conducted by Teklu et at. [19], the maximum EC value for Ziway lake was streteched to 1740µS/cm , the recent study conducted by Zigide and Tsegaye [20] the maximum value for Hawassa lake has been extended to 1999.4 µS/cm. Both lakes have shown the dramatic changes and exceeding the maximum permissible limit of 1000 µS/cm [17, 18]. These alarms immediate intervention to prevent the serious ecological consequences.
3.6 Turbidity
Turbidity is caused by particles suspended or dissolved in water that scatter light making the water appear cloudy or murky. Particulate matter can include sediment - especially clay and silt, fine organic and inorganic matter, soluble colored organic compounds, algae, and other microscopic organisms It is the reduction of transparency in water due to the presence of these particles [26]. It is commonly measured in Nephelometric Turbidity Units (TNU).
As depicted in Tabe 1, Ziway lake is one of the lakes that have shown dramatic changes. In fact, in almost all lakes of the rift valley siltation and sedimentation as a result land degradation is a common case. This is the case in both lakes. This calls for catchments water and soil conservation to mitigate sedimentation and of lakes and reduce erosion in their catchments.
In this study the limited water quality analysis over the last few decades have been assessed. The results evidently display that the pristine quality is changing. In both lakes, there are increasing trend of the tested parameters. For instance, as indicated in Table 1, the values of DO and F- for Lake Hawasssa and Turbidity value for Lake Ziway are showing alarmingly increasing. Moreover, the recent values of EC for both lakes are shocking. The pH is also increasing.
These changes are dominantly attributed to mainly anthropogenic activities associated with activities in the vicinity of the lake shores and their catchments. The rapid urbanization, excessive water use for irrigation, fertilizers and industrialization can accelerate water pollution of Ethiopian Rift Lakes. Hence, continued monitoring measures are essential for capturing valuable data and information in order to create awareness within the water resources planners, policy makers, and local population.
Generally, these trends demand immediate intervention to avert the grave environmental consequences. This study dominantly used secondary data sources and few water quality parameters. It is also recommended to test other water quality parameters such as heavy metals and agrochemicals which might also significantly affected these globally important lakes.
The authors are indebted to the various authors and institutions which are duly acknowledged in the references. We appreciate the sponsorship of the African Center of Excellence for Water Management. We are also thankful to the Indian Institute of Technology, Roorkee for hosting the authors during the preparation of this manuscript. The valuable comments given by the anonymous reviewers are also highly appreciated.
[1] Soundarapandian P, Premkumar, T., Dinakaran, G.K. (2009). Studies on the Physico-chemical Characteristic and Nutrients in the Uppanar Estuary of Cuddalore, South East Coast of India. Current Research Journal of Biological Sciences, 1(3).
[2] Garn, H.S., Elder, J.F., Robertson, D.M. (2003). Why study lakes? An overview of usgs lake studies in Wisconsin. Lake Studies Team, U.S. Geological Survey, Wisconsin District. https://doi.org/10.3133/fs06303
[3] Babu, Y.S, Mohan, M.R. (2018). Study on physico-chemical parameters of Errarajan lake of Bangalore rural. International Journal of Scientific Research, 7(2).
[4] Babiker, I.S., Mohamed, M.A., Hiyama, T. (2007). Assessing groundwater quality using GIS. Water Resour. Manage., 21: 699-715. https://doi.org/10.1007/s11269-006-9059-6
[5] Ayenew, T, Tilahun, N. (2008) Assessment of lake-groundwater interactions and anthropogenic stresses, using numerical groundwater flow model, for a Rift lake catchment in central Ethiopia. Lakes & Reservoirs: Research and Management, 13(4): 325-343 https://doi.org/10.1111/j.1440-1770.2008.00383.x
[6] Abate, B., Woldesenbet, and A., and Fitamo, D. (2015). Water quality assessment of Lake Hawassa for multiple designated water uses. Water Utility Journal, 9: 47-60. https://doi.org/10.4090/juee.2015.v9n2.146157
[7] Praveen, M., Mukemil, K.O. (2015). CCME Water Quality Index and Assessment of Physico- Chemical Parameters of Lake Hawassa, Ethiopia. International Journal of Recent Scientific Research, 6(6): 7891-7894.
[8] Tibebe, D.A. (2017). Internal and external agrochemical loads, dynamics and impacts on the freshwater ecosystem of Lake Ziway, Ethiopia. PhD Thesis, Addis Ababa University.
[9] Ravichandran, S. (2003). Environmental Monitoring and Assessment, 87: 293-309. https://doi.org/10.1023/A:1024818204664
[10] Ayenew, T., Legesse, D. (2007). The changing face of the Ethiopian rift lakes and their environs: Call of the time. Lakes & Reservoirs: Research and Management, 12: 149-165. https://doi.org/10.1111/j.1440-1770.2007.00332.x
[11] Ayenew, T. (2009). Natural lakes of Ethiopia. Addis Ababa University Press. pp 2009.
[12] Katie, G. (2011). Lake water management in three Ethiopian rift valley watersheds. Environmental Policy Review: Key Issues in Ethiopia 2011, Waterville, Maine, pp. 97-130.
[13] Reynolds, T., Farley, J., Huber, C. (2010). Investing in human and natural capital: An alternative paradigm for sustainable development in Awassa, Ethiopia. Ecological Economics, 69(11): 2140-2150. https://doi.org/10.1016/j.ecolecon.2009.03.007
[14] Ministry of Water Resources (MoWR) (2010). The Federal Democratic Republic of Ethiopia-Ministry of Water Resources: Rift Valley Lakes Basin Integrated Resources Development Master Plan Study Project. Halcrow Group Limited and Generation Integrated Rural Development (GIRD) Consultants: Addis Ababa, Ethiopia.
[15] Desta, H., Lemma, B., Albert, G., Stellmacher, T. (2015). Degradation of Lake Ziway, Ethiopia: A study of the environmental perceptions of school students. Lakes and Reservoirs: Research and Management, 20(4): 243-255. https://doi.org/10.1111/lre.12111
[16] Ayenew, T., Robert, B., Arno van, L., Yemane, G., Dagnachew, L., Japheth, O. (2007). Hydrodynamics of topographically closed lakes in the Ethio-Kenyan Rift: The case of lakes Awassa and Naivasha. Journal of Spatial Hydrology, 7(1). Springer.
[17] Ministry of Health (MoH) (2011) National drinking water quality monitoring and surveillance strategy. Federal Democratic of Ethiopia. Ministry of Health, Addis Ababa. http://www.cmpethiopia.org/content.
[18] World Health Organization (WHO) (2010) Rapid assessment of drinking water quality in the Federal Democratic Republic of Ethiopia, Country Report World Health Organization, Geneva.
[19] Teklu, B.M., Hailu, A., Wiegant, D.A., Scholten, B.S., Van den Brink, P.J. (2018) Impacts of nutrients and pesticides from small- and large-scale agriculture on the water quality of Lake Ziway, Ethiopia. Environ Sci Pollut Res, 25: 13207-13216. https://doi.org/10.1007/s11356-016-6714-1
[20] Zigide, H.M., Tsegaye, M.E. (2019). Evaluation of the current water quality of Lake Hawassa, Ethiopia. Int. J. Water Res. Environ. Eng., 11(7): 120-128. https://doi.org/10.5897/IJWREE2019.0857
[21] Ayenew, T. (2008). The distribution and hydrogeological controls of fluoride in the groundwater of central Ethiopian rift and adjacent highlands. Environ. Geol., 54: 1313-1324. https://doi.org/10.1007/s00254-007-0914-4
[22] Zinabu, G.M. Elizabeth, K.W., Zerihun, D. (2002). Long-term changes in chemical features of waters of seven Ethiopian rift-valley lakes. Hydrobiologia, 477(1-3): 81-91. https://doi.org/10.1023/A:1021061015788
[23] Claude, E.B, Craig, S.T, Rawee, V. (2011). Interpretation of pH, acidity, and alkalinity in aquaculture and fisheries. North American Journal of Aquaculture, 73(4): 403-408. https://doi.org/10.1080/15222055.2011.620861
[24] Rachna, B., Disha, J. (2016). Water quality assessment of lake water: A review. Sustain. Water Resour. Manag, 2: 161-173. https://doi.org/10.1007/s40899-015-0014-7
[25] Srivastava, A., Kr. R., Gupta V., Agarwal. G., Srivastava. S, et al. (2011). Water Quality Assessment of Ramganga River at Moradabad by Physico-Chemical Parameters Analysis. VSRDTNTJ, 2(3): 119-127.
[26] Minnesota Pollution Center Agency. (2008). Turbidity: Description, Impact on Water Quality, Sources, Measures- A General Overview. Water Quality/Impaired Waters #3.21. Available at https://www.pca.state.mn.us/sites/default/files/wq-iw3-21.pdf