Zhifang Zhou* | Jinjin Li | Wenting Zhao | Huixiang Zeng
OPEN ACCESS
In order to make the resource tax better play its role of adjusting differential income and protecting resources, the Chinese government has implemented new types of resource taxes including "ad valorem duty" and "free fee and regulate tax" reform for oil, natural gas and coal resources. In this context, we evaluate the optimal design for the reform of a tax on non-ferrous metal resources. Here, we construct and use a resource computable general equilibrium (CGE) model, to investigate the optimal tax rate of copper resource under ad valorem duty in China. The results showed that the best tax rate is 12 %. Based on this optimal rate, a dynamic CGE model was built to analyze and dynamically forecast the macroeconomic impact of different taxes, providing insight into the best strategy to enable cost control for enterprises and efficient and effective policymaking by the government.
ad valorem duty, CGE model, copper resource tax, macroeconomic impact, optimal tax rate
As an important component of ecosystem, mineral resources play a crucial role in every field of human’s production and life. At the same time, holdings of mineral resources are one of the basic indicators to measure comprehensive national power, the potential of national economic development and national strategic security [1]. Generally speaking, mineral resources can be divided into energy minerals, metal minerals, nonmetal minerals and water resources according to use criteria. Compared with other natural resources, mineral resources are limited, nonrenewable, scarce, dynamic and area distribution unbalanced. China is rich in mineral resources. On the one hand, there is a considerable variety of resources, and China has discovered 171 varieties of minerals, and 158 of them with proved reserves. According to early statistics of Ministry of Land and Resources, China’s total amount of mineral resources account for about 12% of the world, and it is second only to United States and the Soviet Union, ranking third in the world. However, China’s per capita holding of resources is only 58 % of the world average, ranking 53 in the world [2]. Therefore, China is also relatively poor in resources. On the other hand, since 1990s, with the huge demand for mineral resources caused by the acceleration of China’s industrialization process and the predatory consumption of resources resulted from traditional pattern of economic growth, although national mining, dressing, smelting, production and sales are growing constantly, the pressure of self-sufficient in minerals is rising year by year and the reliance on overseas resources is increasing constantly. Meanwhile, the extensive utilization of resources has also caused enormous pressure on ecological environment.
Resource tax focuses on energy, mineral and other natural resources as the object of tax collection, as a way to adjust the income gap between different mines and to reflect real value of the state-owned resources [3]. The excess progressive tax (i.e. ad valorem duty) was the first form of resource taxing in China, begun in 1986.The government promoted the "Mineral resources law of the People's Republic of China", and simultaneously enacted a volume-based tax mechanism for seven resources, with the tax amounts specific for different provinces. However, with the rapid economic growth, this volume-based tax mechanism was insufficient to meet the new growing demand, due to its limitation of small range, low tax amounts, and a lack of correlation with actual values of resources [4]. As a result, the government has undergone many revisions to the initial policies of resource tax collection. Xinjiang, the reform pilot of China, changed the basis of taxation to reflect the amount of sales in 2010. Starting in November 1, 2011, "ad valorem duty" and "free fee and regulate tax" policies, were part of the increased regulation of oil and natural gas, targeting 5 % to 10 % of sales. On December 1, 2014, the government made further changes to taxing coal, adjusting its tax from 2% to 9% under ad valorem duty. Moreover, the government began to adjust the iron ore resource tax on May 1, 2015, decreasing the tax by 60 % in preparation for the next ad valorem duty reform on metal [4]. Similarly, research began to determine the best policy to adjust the nonferrous metal resource tax basis from amount to price, with focus aimed at optimizing quantitative rate design and performing macroeconomic impact analysis.
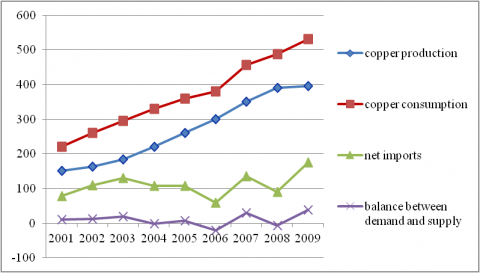
In the field of mineral resources, copper is of great significance. Due to its wide application and important role in national economic development. Of the 124 basic industries in China, 113 copper products [5], showing copper’s fundamental strategic position second only to oil. Currently, China is the largest copper consumer and copper products exporter in the world. However, China’s mines have more lean ore, lack scale ore, and require high production costs. To extract the copper, the state of Chinese copper mining and usage in our country is shown in Figure 1 (source: "China nonferrous metals industry yearbook (2002-2010)").
Figure 1. Chinese copper resources in 2001-2009
Figure 1 shows the insufficiency of Chinese copper production to meet demand. The main reason, besides the limitations of the natural resources, is related to low use efficiency of domestic mining. With the continued increase of demand, we should pay attention to the copper tax policy and determine its effect on development and resource utilization. Currently, China's copper resource tax policy includes both taxes and fees. The tax amounts have steadily increased (the first-class mining levy changed from 1.6 yuan/ton to 7 yuan/ton in 2008).
Using the copper resource tax as the breakthrough point and examining the recent relevant reforms for coal, oil and natural gas, we determine the optimal copper resource tax rate and analyze its macroeconomic impact under the ad valorem duty.
International research on resource tax has been relatively systematic and comprehensive. The ideas of “resource depletion” and “the theory of time "first introduced the idea and significance of resource tax collection [6] and were later modified to include variables of externalities [7], market interest rates [8], base period price [9] and government credibility [10] in improve the theoretical foundation of resource taxes. Different models and methods have been used for resource tax rate design and understanding non-renewable natural resources depletion value is used to determine optimal tax calculation. Barker designed Britain's "energy - environment - economy" model to determine a reasonable range of carbon tax [11]. Boadway analyzed the tax rate for oil and minerals from a theoretical perspective using net rent calculation [12], which took environmental issues into consideration. The effect of resource tax collections focused on the impact on specific industries. Kunce explored the consequences of tax changes on the oil industry in the United States [13]. Söderholm and Klaassen analyzed mineral products consumption and showed that the mineral raw material resource tax has high environmental utilization [14].
In contrast, domestic research on resource tax has focused on tax basis, choice of tax and fee, and the Chinese resource tax system. Among Chinese scholars, there is near consensus that ad valorem duty is a better approach than volume-based resource taxing. For instance, Shang suggested Chinese resource taxes should be appropriately increased [15]. A free fee and regulate tax approach is similarly favored by Chinese academics. Ye and Hou proposed resource tax and mineral resources compensation fees are redundant with each other and only resource taxes can reduce management costs and enhance industry competitiveness [16] [17]. These taxes may also increase transparency to avoid disputes between different departments and reduce problems with rent-seeking corruption [18]. For the existing tax system in China, most scholars agree that the amount of unit resources tax collection is insufficient to reflect the differential profits between inferior and superior mine resources. In addition, the collection scope is also too narrow, contrary to the principle of equitable burden [19].
These domestic and international studies relied on mostly qualitative analysis. Lin using the modified EI Serafy user cost method to estimate the cost of coal resource depletion, proposed that the coal resource tax rate should be 5 %~12 % under ad valorem duty [20]; Wu determined that the optimal tax rate for natural gas’ is 13 % using a CGE model [21]. The quantitative research on natural resource taxation has focused on coal, oil and natural gas, and the Chinese government has carried out the reform of ad valorem on these three resources. Here, we focus on quantitative-method based determination of the appropriate tax rate for less studied fields, such as non-ferrous metal, which has not been studied previously.
We established a CGE model for our analysis and then calculated the optimal tax rate. Based on our results, we then built a dynamic CGE model to analyze and dynamically forecast the macroeconomic impact of different taxes and assess reform utility.
The CGE model has been widely used in many fields including studies of resources, environment, public finance, and others. Using regional CGE model, Bollen studied the correlation between the cost of government climate policy and greenhouse gas emission [22]. Philip examined the feasibility of the replacement of gasoline with biodiesel in France with a dynamic CGE model and concluded that 10 % of the rate about authorization was insufficient to achieve the government intended target [23]. As can be easily seen, CGE provides a comprehensive approach for the study of resource tax rate design.
3.1 The CGE model
In addition to the basic parameters, a basic CGE model also includes the detailed database of various industry departments. Based on the known data, we established static (resource) and dynamic CGE models to design the optimal copper resource tax rate and analyze its macroeconomic impact in China. The selection of CGE was for the following reasons:
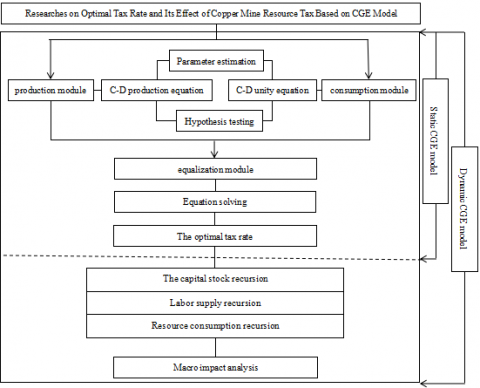
For convenience, we do not consider foreign departments in the specific application of static CGE, but include production, consumption, and equilibrium to ascertain the optimal tax rate. On this basis, a dynamic CGE model is built using a dynamic recursive mechanism to study macroeconomic influence [26], as shown in Figure 2.
Figure 2. The basic framework of copper tax rate in the CGE model
3.2 The building of model function
3.2.1 Static CGE model for copper resource tax rate
(1) C-D production equation, shown as equation (1)
$Q=F(K, L, R)=A K^{\alpha} R^{\beta} L^{\gamma} \quad(\alpha+\beta+\gamma=1)$ (1)
where, Q, K, L, R respectively refer to the concept output, capital, labor and resource; A represents transfer parameters showing the technological progress of productivity; when the output is 1, $\alpha, \beta, \gamma$ are share parameters, based on K, L, R, all of which satisfy the same returns to scale.
Both sides of the equation (1) were divided by L, to get equation (2). The input of elements such as capital, labor and resources are converted into per capita elements. For output q.
$q=f(k, r)=A K^{\alpha} R^{\beta} \quad(\alpha+\beta<1)$ (2)
Based on this, at a minimum cost for producers, equation (3) will be obtained, allowing calculation of the corresponding coefficients like per capita capital amount k and per capita resource consumption r. Where, Tk is capital rate, Tr refers to resource tax rates, and z, θ, w are the prices of capital, resource and labor, respectively. T1 means labor rates.
$\operatorname{Min} C(k, r)=\left(1+T_{K}\right) \times z \times k+\left(1+T_{r}\right) \times \theta \times r+\left(1+T_{L}\right) \times w$ (3)
Equation (4) is obtained from equation (2) after the equation transformation of linear estimation.
$\ln (q)=\ln (A)+\alpha \ln (k)+\beta \ln (r)$ (4)
$k=\left|\frac{q}{A}\right|^{\frac{1}{\alpha+\beta}}\left|\frac{\alpha\left(1+T_{r}\right) \theta}{\beta\left(1+T_{k}\right) z}\right|^{\frac{\beta}{\alpha+\beta}}$ (5)
$r=\left|\frac{q}{A}\right|^{\frac{1}{\alpha+\beta}}\left|\frac{\beta\left(1+T_{k}\right) z}{\alpha\left(1+T_{r}\right) \theta}\right|^{\frac{\alpha}{\alpha+\beta}}$ (6)
(2) C-D unity equation, shown as equation (7) (8) and (9)
$U=C_{p}^{m} \times C_{g}^{n} \quad(m+n=1)$ (7)
$C_{p}=\left(1-T_{L}\right) \times w-T_{r} \times \theta_{r}$ (8)
$C g=\mu\left(T_{L} \times w+T_{k} \times z \times k+T_{r} \times \theta_{r}\right)$ (9)
where, Cp means private consumption and Cg is government consumption, m refers to residents' consumption elasticity coefficient, and n is the public consumption elasticity coefficient.
(3) Equalization module equation
Equilibrium module means the supply and demand balance, shown as equation (10).
$q=C_{p}+C_{g}$ (10)
In addition, for producers, there is an equilibrium output and equilibrium capital price, where the marginal cost equals marginal revenue, shown as equations (11) and (12).
$q *=\frac{\left(1-T_{L}\right) w+\mu T_{L} w}{1-\mu \alpha T_{k} /\left(1+T_{k}\right)+(1-\mu) \beta T_{r} /\left(1+T_{r}\right)}$ (11)
$z *=\left|\frac{\alpha q *}{1+T_{k}}\right|^{\frac{\alpha+\beta}{\alpha}}\left|\frac{A}{q_{*}}\right|^{\frac{1}{\alpha}}\left|\frac{\beta\left(1+T_{k}\right)}{\alpha\left(1+T_{r}\right) \theta}\right|^{\frac{\beta}{\alpha}}$ (12)
3.2.2 Dynamic CGE model for macroeconomic impact
To reduce the necessary amount of calculation, we use the above resource model results and included a dynamic mechanism to build the dynamic CGE model, as follows:
$K_{n+1}=(1-\delta) K_{n}+I_{n}$ (13)
$L_{n+1}=(I+n g) \times L_{n} \times C_{n+1}$ (14)
$C C_{1}=\operatorname{pin} V_{1}+(i r+D E P R)$ (15)
$I T_{1}=\operatorname{pin} V_{1} \sum I_{i}$ (16)
$Q E(t)=\left[\left(\sum E R E(t-1)-\Sigma Q R(t)\right) \Sigma_{0}^{t} w\right] P$ (17)
In equation (13), the summation of the current capital stock deducts depreciation and the current investment becomes the capital stock in the next phase. Equation (14) shows the social labor supply in the next period, obtained as the current labor supply multiplied by population growth. Equation (15) shows the capital use-cost is equal to the product of the current investment price index and the summation of the current interest rate and discount rate. In equation (16), all of the terminal investments are added to form the national total. For the resource recursive equation (17), QE (t) is the total value of resources, ERE (t-1) is the resource recovery in last installment, QR (t) is the current capital stock, and w represents the degree of resource exploitation, as a time distribution function. P is the resource price.
3.3 The basic data and correlation parameters of CGE model
The benchmark database is the input-output table of 2010, so the corresponding variables are from Chinese statistical yearbooks from 2001~2010. The copper mine belongs to the second industry and the number of industrial workers employed at the end of ten years are the labor element for the production module. This is divided by the total annual industrial output value to get q, or GDP output in CGE model. Next, we used Huang’s [27] approach to sample data processing with capital stock estimation to assign capital input k’ samples as the original value of fixed assets, adjusted for the same period price index. The capital stock in the base period (2001) was calculated based on the Chinese provincial capital stock in 1952-2000, according to the finding of Jun Zhang [28]. The consumption of resource was determined as the summation of copperware such as copper processing materials and wire rods based on the data in the “China nonferrous metals industry yearbook”, divided by the annual Chinese population to get the per capita resource consumption of copper. This is shown in Table 1.
In the consumption module, we used data from 2001 to 2010 to estimate government consumption and the consumption elasticity coefficient for residents (using data from the China statistical yearbook). According to statistics, the average ratio was 2.48, the residents' consumption elasticity coefficient was 0.71, when the government is 0.29 and µ is 0.94. In addition, based on work from Ye [29] on the determination of fuel tax rates, we set the labor rate as 6.62 % and the capital tax rate as 45.65 %. Labor price was calculated based on the average wage $28651.6 of employed workers from 2006 to 2010. The resource price was obtained using copper revenues and output elements as 228.48 yuan/ton.
Table 1. Data summation of production moduleln
|
Year |
q (Yuan) |
Ln q |
k (Yuan) |
Ln k |
L (Hundred Million) |
r (kg) |
Ln r |
|
2001 |
30499.42 |
10.33 |
62928.23 |
11.05 |
1.4289 |
1.26 |
0.38 |
|
2002 |
34368.02 |
10.44 |
68233.90 |
11.13 |
1.3801 |
1.46 |
0.67 |
|
2003 |
39202.00 |
10.58 |
77119.34 |
11.25 |
1.4016 |
1.96 |
1.03 |
|
2004 |
44228.18 |
10.70 |
91011.86 |
11.42 |
1.4744 |
2.81 |
1.29 |
|
2005 |
49307.78 |
10.81 |
92120.78 |
11.43 |
1.5663 |
3.62 |
1.35 |
|
2006 |
54894.15 |
10.88 |
101610.59 |
11.53 |
1.6634 |
3.84 |
1.40 |
|
2007 |
62336.38 |
11.04 |
114769.35 |
11.65 |
1.7732 |
4.05 |
1.56 |
|
2008 |
72495.68 |
11.19 |
148293.15 |
11.91 |
1.7968 |
4.77 |
1.84 |
|
2009 |
74780.18 |
11.22 |
149397.21 |
11.94 |
1.8085 |
6.30 |
1.88 |
|
2010 |
85882.77 |
11.36 |
91592.91 |
11.43 |
1.8731 |
7.85 |
2.06 |
Notes:1. There was an extreme value in 2010 and this value was not included in our regression analysis.
The problem of how to process industrial data to analyze its impact was solved using the dynamic CGE model. Based on the literature, we classified the 42 units in China's input-output table of 2010 into 7 departments of agriculture, light industry, construction industry, service industry, energy and electricity industry, metal mining industry, and non-metallic mining industry. We used China's energy environment social accounting matrix (SAM) of the base period as the basic data in our CGE model. Using the method of minimum cross entropy, we examined the balance problem caused by different source and quality of statistical material in SAM. Additional data used were from the 2011 China statistical yearbook, the China financial yearbook, the China nonferrous metals industry yearbook, and the China energy statistical yearbook.
4.1 The optimal rate of copper resource tax from static CGE
The linear parameter estimation results in the production module are presented in Tables 2 and 3. The R2 of the model was 0.987, 0.982 after adjustment. At 5% significance level, every coefficient can pass the test. Therefore, this paper will use the production function equation (18) and the utility function (19) in the production module.
$q=13.93 k^{0.69} r^{0.192}$ (18)
$U=C_{p}^{0.71} C_{g}^{0.29}$ (19)
The solution is to seek a resource tax rate which can maximize the total utility of consumers and the impact on the economic system in the acceptable range through the model (this article selects 1 %). Table 4 summarizes the specific values of the various factors under different tax rates. Based on this, we analyze the utility results, as shown in Figure 3.
Table 2. Linear parameter estimation in production module
|
Model |
R |
R2 |
Adjusted R2 |
Estimated Error |
|
1 |
0.993a |
0.99 |
0.982 |
0.04197 |
When the tax rate is 12 %, consumer utility reaches the maximum, indicating the optimal copper tax rate is 12 %. Considering the direct and representative needs of results analysis, we choose the simulation result 12 % as the middle value and used 7 % and 20 % as a reference to evaluate the value of related elements to aggregate and analyze trends, as shown in Figures 4 and 5.
Table 5 summarizes the data on the combined impact of the copper resource tax under the three gradients. According to the date aggregation of the comprehensive influence of copper resource for the three tax rates, Figures 4 and 5 is the trend of the different elements change. The balanced capital usage and resource tax rates are positively correlated and the trend of per capita output is opposite. As copper mine resource tax rates increase, government spending increases but private consumption decreases gradually.
Table 3. The simulative results of model parameters
|
Model |
The Unstandardized Coefficient |
Standardized Coefficient |
t |
Sig. |
|
|
B |
Standard Error |
||||
|
(Constant) lnr lnk |
2.634 |
1.933 |
|
1.363 |
0.222 |
|
0.192 |
0.110 |
0.314 |
1.752 |
0.130 |
|
|
0.690 |
0.180 |
0.687 |
3.838 |
0.009 |
|
Table 4. The equilized data of copper resources tax for different rates
|
Tr |
q* |
Z* |
k* |
r* |
Cp |
Cg |
U |
|
1% |
35824.56 |
0.4769 |
36312.05 |
24.09 |
26685.37 |
9168.73 |
19574.75 |
|
2% |
35820.79 |
0.4756 |
36407.37 |
23.85 |
26617.25 |
9230.03 |
19578.29 |
|
3% |
35817.12 |
0.4744 |
36502.08 |
23.62 |
26550.47 |
9292.08 |
19581.41 |
|
4% |
35813.54 |
0.4731 |
36596.19 |
23.39 |
26484.98 |
9352.94 |
19584.15 |
|
5% |
35810.05 |
0.4718 |
36689.71 |
23.16 |
26420.75 |
9412.63 |
19586.52 |
|
6% |
35806.66 |
0.4706 |
36782.65 |
22.94 |
26357.75 |
9471.19 |
19588.54 |
|
7% |
35803.35 |
0.4694 |
36785.01 |
22.73 |
26295.93 |
9528.65 |
19590.25 |
|
8% |
35800.13 |
0.4682 |
36966.81 |
22.51 |
26235.27 |
9585.05 |
19591.65 |
|
9% |
35796.99 |
0.467 |
37058.05 |
22.31 |
26175.73 |
9640.40 |
19592.76 |
|
10% |
35793.94 |
0.466 |
37148.74 |
22.10 |
26117.29 |
9694.75 |
19593.61 |
|
11% |
35790.96 |
0.4647 |
37238.89 |
21.90 |
26059.91 |
9748.11 |
19594.30 |
|
12% |
35788.05 |
0.4635 |
37328.51 |
21.70 |
26003.55 |
9800.52 |
19594.64 |
|
13% |
35785.22 |
0.4624 |
37417.61 |
21.51 |
25948.20 |
9852.00 |
19594.59 |
|
14% |
35782.47 |
0.4612 |
37506.19 |
21.32 |
25893.83 |
9902.57 |
19594.31 |
|
15% |
35779.78 |
0.4601 |
37594.25 |
21.13 |
25840.42 |
9952.27 |
19593.83 |
|
16% |
35777.16 |
0.4590 |
37681.82 |
20.95 |
25787.93 |
10001.10 |
19593.19 |
|
17% |
35774.61 |
0.4579 |
37768.89 |
20.77 |
25736.34 |
10049.10 |
19592.37 |
|
18% |
35772.13 |
0.4569 |
37855.47 |
20.59 |
25685.64 |
10096.28 |
19591.39 |
|
19% |
35769.7 |
0.4558 |
37941.57 |
20.42 |
25635.79 |
10142.67 |
19590.27 |
|
20% |
35767.3 |
0.4547 |
38027.19 |
20.25 |
25586.78 |
10188.29 |
19589.31 |
Table 5. Macroeconomic impacts under different gradient resources tax rates
|
Resource Tax Rate (%) |
Total Resident Consumption (Yuan) |
Total Government Spending (Yuan) |
The Total Utility of Consumers (Yuan) |
Balance Per Capita Output (Yuan) |
Balance Capital Usage (Yuan) |
Per Capita Resource Consumption (kg) |
|
7 |
26295.93 |
9528.65 |
19590.25 |
35803.35 |
36785.01 |
22.73 |
|
12 |
26003.55 |
9800.52 |
19594.64 |
35788.05 |
37328.51 |
21.70 |
|
20 |
25586.78 |
10188.29 |
19589.31 |
35767.30 |
38027.19 |
20.25 |
Figure 4. Equilibrium output and equilibrium capital dosage at different tax rates
Figure 5. Total consumption on residents and government at different tax rates
4.2 The macroeconomic influence results from dynamic CGE
We tested 7 %, 12 %, 20 % as copper resources tax rates in the dynamic CGE model to analyze the influence of tax rate on macroeconomic under ad valorem duty, using the dynamic model to model to the year 2020. The simulation results are shown in Tables 6 and 7.
From Tables 6 and 7, we see that under the ad valorem duty system, GDP, output, and the impact strength of consumption are proportional to the copper mine resource tax rate. Additionally, the majority of industries are affected, but overall most changes are affordable.
Table 6. Macroeconomic effect under different copper resource tax rates (2020)
|
Copper Resource Tax rate (%) |
GDP (%) |
Total output (%) |
Total Consumption (%) |
Total Investment (%) |
Resource Utilization (%) |
|
7 |
0.086 |
0.21 |
-0.071 |
-0.02 |
-0.18 |
|
12 |
-0.073 |
-0.122 |
-0.201 |
0.21 |
0.29 |
|
20 |
-0.351 |
-0.408 |
-0.33 |
0.23 |
0.38 |
Table 7. The multidisciplinary influence under different copper tax rate (2020)
|
Department Rate |
Agriculture |
Light Industry |
Energy and Electricity Industry |
Construction Industry |
Service Industry |
|
7% |
0.0002% |
0.43% |
2.01% |
0.07% |
0.042% |
|
12% |
-0.009% |
-0.32% |
-1.55% |
-0.11% |
-0.07% |
|
20% |
-0.013% |
-0.59% |
-5.07% |
-0.14% |
-0.11% |
Currently, we only have the input-output table in China for 2010. Therefore, economic fluctuations (as shown in Figure 6) and technology development and policy changes after 2010 should be incorporated into future modelling to improve the accuracy of predictions.
From Figure 6 we see that China's economic has exhibited sustained growth since 2010, but the growth rate has slowed, especially in recent years. With the reduction in population and resources, high savings and investment proportion is also decreased. China's economy shows a new normal with growth of 7 %~8 %.
Figure 6. China’s GDP index and its growth range from 2001 to 2015
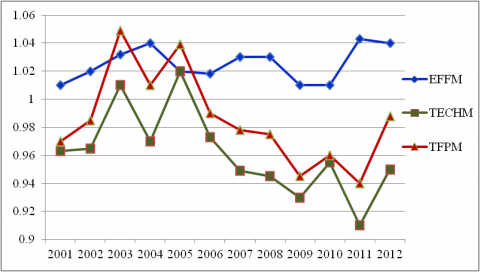
To consider the effect of changes in technological progress, we used the method of Liu [30] about production technology. Under the restriction of resources and environment, we can determine the technical efficiency index (EFFM) and technological progress index (TECHM) by decomposing the productivity index (TFPM). Through additional calculations, the general trend of technological change is shown in figure 7.
From Figure 7, we see our country's technical efficiency growth is relatively stable, but the increase of technological progress is only -1.77 %. This shows obvious fluctuation under the constraint of resources and the environment, which greatly influence productivity. In conclusion, the trend of China's economic growth over the next few years depends on technical efficiency rather than technical progress.
Figure 7. China’s production index and its decomposition from 2001 to 2012
The Chinese government has used policy formulation, implementation, and supervision to promote the resource efficiency use of residents and businesses. To a certain extent, China’s resource utilization is improving.
Combining the above analyses, we predict that economy and technology development will remain stable over the long term, although the economic growth rate fell slightly relative to the rte before 2010. The degree of resource consumption utility is stable within a certain error range given improvement of resource utilization. The data argues that in the next few years, China's industrial output and per capita capital will continue to grow. Within a certain error range, it will remain basically the same as the slope convergence in 2010. For our copper resource tax rate analysis, we can ignore data since 2010, but we must incorporate effects of recent economic, technological, and policy changes in recent years to determine specific tax rate and policy suggestions and ensure the effectiveness and reliability of our conclusions.
4.3 Analysis of the results discussed
Synthesizing the above results and combining with the principles of economic development, we theoretically calculate that the optimal tax rate of copper resource in China is 12%. Based on the 12 % rate, the macroeconomic impact of changes in copper resource tax rate are mainly as follows:
Tax changes will affect economic growth to a certain extent. Specifically, under ad valorem duty, the rise or fall of copper tax rate changes will make the enterprise's production costs change in the same way and thus affect its operating pressure and profits. The adjustment of the tax collection method will also affect the price of copper products, thus affecting the cost of copper material, the profit space of downstream enterprises, and indirectly affect import and export. The degree of the effect depends on the rate and the changing tax burden of copper enterprise.
The industry most affected by the copper resource tax rate changes is energy electric power, whose annual copper consumption accounts for over 40 % of the total copper resources on average since 2005. As part of the recent comprehensive construction of a smart grid, copper processing products are widely used in power generation, power transmission, and electronic communication equipment, so the change in cost of raw materials due to the copper resource tax will have a great influence on China's electric power industry. The proportion of copper material use in Chinese construction industry is relatively low compared with that in developed countries. The total consumption is about 8 % on average from 2005 to 2010, but this industry Nay also be affected by copper resource tax rate changes in the future given the obvious growth trend.
Tax increases can promote copper enterprises’ transformation from "production guide" to "profit-oriented,” and therefore improve copper resource utilization. At the same time, it is beneficial for enterprises to make adjustments and upgrade technology to save costs and form new industrial patterns between copper enterprises. Furthermore, from the consumer's point of view, if copper tax rate is increased, copper prices will also rise accordingly, which promotes the conservation of resources to improve the efficiency of resource utilization. In the long run, these types of taxes can stimulate the progress of technology and promote industrial structure optimization to drive economic growth.
With the creation of main mineral resources tax reform in China, the taxing of copper and other non-ferrous metals will similarly change. Under the pressure of both China’s demand of copper and ecological environment, using a CGE model, we calculated the theoretical optimal copper tax rate and concluded that ad valorem duty of copper resource tax reform regulates differential income and has positive effects on industrial optimization and resource protection. Changes to the copper resource tax can promote improved, balanced, and sustainable development. Therefore, we put forward the following suggestions on copper resource tax reform:
This research work is supported by the Program of National Social Science Foundation of China (Ref:18BJY085).
[1] Lusty PAJ, Gunn AG. (2015). Challenges to global mineral resource security and options for future supply. Geological Society, London, Special Publications 393(1): 265-276. http://dx.doi.org/10.1144/SP393.13
[2] Xu Y, Li J, Liu L. (2016). Current status and future perspective of recycling copper by hydrometallurgy from waste printed circuit boards. Procedia Environmental Sciences 31: 162-170. http://dx.doi.org/10.1016/j.proenv.2016.02.022
[3] Xu X. (2011). Resource tax reform of tax rate choice: A resource CGE model analysis. Journal of Shanghai University of Finance and Economics 13: 82-89. http://dx.doi.org/10.16538/j.cnki.jsufe.2011.01.008
[4] Zhou Z, Chen X, Xiao X, Xiong F. (2013). A comprehensive evaluation indicators system of sustainable consumption and production in the iron and steel industry: A field study in bao steel. Metalurgia International 18: 119-129.
[5] Ma L. (2011). Based on the resource safety of China's copper import source of risk analysis and control. Changsha: Central South University.
[6] Hotelling H. (1931). The economics of exhaustible resources. Journal of Political Economy 39(2): 137-175. https://doi.org/10.1086/254195
[7] Sandmo A. (1975). Optimal taxation in the presence of externalities. The Swedish Journal of Economics: 86-98. https://doi.org/10.2307/3439329
[8] Slade ME. (1980). The effects of higher energy prices and declining ore quality: Copper—aluminium substitution and recycling in the USA. Resources Policy 6(3): 223-239. https://doi.org/10.1016/0301-4207(80)90042-2
[9] Baranzini A, Goldemberg J, Speck S. (2000). A future for carbon taxes. Ecological economics 32(3): 395-412. https://doi.org/10.1016/S0921-8009(99)00122-6
[10] Chen JV, Jubilado RJM, Capistrano EPS, Yen DC. (2015). Factors affecting online tax filing–An application of the IS Success Model and trust theory. Computers in Human Behavior 43: 251-262.
https://doi.org/10.1016/j.chb.2014.11.017
[11] Barker T, Baylis S, Madsen P. (1993). A UK carbon/energy tax: The macroeconomics effects. Energy Policy 21(3): 296-308. https://doi.org/10.1016/0301-4215(93)90251-A
[12] Boadway R, Keen M. (2010). Theoretical perspectives on resource tax design. The Taxation of Petroleum and Minerals: Principles, Problems and Practice 24: 13.
[13] Kunce M, Gerking S, Morgan W, Maddux R. (2003). State taxation, exploration, and production in the US oil industry. Journal of Regional Science 43(4): 749-770. https://doi.org/10.1111/j.0022-4146.2003.00319.x
[14] Söderholm P, Klaassen G. (2007). Wind power in Europe: a simultaneous innovation–diffusion model. Environmental and Resource Economics 36(2): 163-190. https://doi.org/10.1007/s10640-006-9025-z
[15] Shang Y. (2008). Resource tax reform - a new page of green tax. Journal of Contemporary Economy 11: 124-125.
[16] Ye J. (2007). On resource tax "tax and fee one". Technology Innovation Herald 2: 225-226. https://doi.org/10.16660/j.cnki.1674-098x.2007.02.150
[17] Hou X. (2007). International Comparison of Resources Tax System and Its Reference to Our Country --- Resources Economical economy as a perspective. Special Economic Zone 12: 128-130.
[18] Wang M. (2010). China resource research review. Economic Research Tribune 33: 18-20.
[19] Deng H. (2007). Comparative study environment tax system and its reference for China. Journal of Tax and Economy 3: 95-100.
[20] Lin B, Liu X, Zou C, Liu X. (2012). The resource tax reform in coal, for example of resource economics analysis. Chinese Academy of Social Sciences 2: 58-78, 206.
[21] Wu R. (2014). Based on CGE model of natural gas resource tax reform research. Beijing: China University of Geosciences (Beijing).
[22] Bollen J. (2015). The value of air pollution co-benefits of climate policies: Analysis with a global sector-trade CGE model called WorldScan. Technological Forecasting and Social Change 90: 178-191.
https://doi.org/10.1016/j.techfore.2014.10.008
[23] Doumax V, Philip JM, Sarasa C. (2014). Biofuels, tax policies and oil prices in France: Insights from a dynamic CGE model. Energy Policy 66: 603-614. https://doi.org/10.1016/j.enpol.2013.11.027
[24] Gao X, Zhao W. (2014). China's oil and gas resources based on compensate for resource depletion rate optimization study. China Population Resources and Environment 24: 102-108.
[25] Zhang M. (2013). Based on resource CGE model of resource optimal tax rate design. Beijing: China University of Geosciences (Beijing).
[26] Yin A, Yang S, Li L. (2013). Based on analysis of CGE model to simulate mineral resource tax rate. Journal of Accounting Monthly 22: 41-44.
https://doi.org/10.19641/j.cnki.42-1290/f.2013.22.013
[27] Huang Y, Guo Z, Zhang T, Wang XJ. (2005). Application of CGE model of quantitative analysis of China's implementation of the feasibility of the energy environment tax policies. Urban Environment and Urban Ecology 2: 18-20.
[28] Zhang J, Wu G, Zhang J. (2004). Chinese provincial material capital stock count: 1952-2000. Journal of Economic Studies 10: 35-44.
[29] Ye Z. (2009). Determination of fuel tax rate - based on CGE analysis. Journal of Statistical Research 5: 86-93. https://doi.org/10.19343/j.cnki.11-1302/c.2009.05.013
[30] Liu L. (2014). Under the restriction of resources and environment efficiency of import and export trade of China's economic growth - based on the influence of the area at the provincial level panel data research. Xiamen University.