Junhui Zheng![]() | Deyong Wang*
| Deyong Wang*![]() | Zexun Geng
| Zexun Geng![]()
© 2023 IIETA. This article is published by IIETA and is licensed under the CC BY 4.0 license (http://creativecommons.org/licenses/by/4.0/).
OPEN ACCESS
In coal mining environments, both complexity and potential hazards are inherently present. Responding to the critical need for improved coal mine safety, a method was developed for the real-time surveillance of these hazards using an adapted YOLO algorithm. Initially, an algorithm, which amalgamates attention mechanisms and multi-feature fusion for the detection of safety hazards in coal mines, was presented. Utilizing the YOLOv3 framework, the Gc Net attention module was integrated, a reverse feature fusion pathway was established, and a three-scale prediction module was constructed. Such modifications were designed to identify hazards of various dimensions and configurations, thus augmenting the approach's robustness in intricate situations. Further, the model's loss function underwent optimization to address the imbalances observed in the distribution of positive and negative samples concerning their numbers and complexities. Through experimentation, the efficacy of the proposed method was demonstrated.
YOLO algorithm, safety hazards in coal mines, real-time monitoring model
Globally, coal mines are identified as fundamental energy providers, and their seamless operation holds paramount importance for the global economic landscape [1, 2]. Nevertheless, inherent intricacies and potential dangers in coal mine settings have been observed to render these environments susceptible to frequent safety hazards [3, 4]. These hazards not only imperil miners but also disrupt the continuity of mining operations. Consequently, the importance of real-time monitoring techniques for these hazards in coal mines has been accentuated [5, 6].
Historically, coal mine safety hazards have been predominantly monitored through manual inspections and sensor-based techniques [7, 8]. In these methods, inherent shortcomings have been identified. Manual inspections, while hands-on, are time-consuming and exposed to factors like environmental conditions, fatigue, and human error [9, 10]. Conversely, sensor-based techniques, though adept at real-time surveillance, have been reported to occasionally give rise to false alarms or oversight, particularly in the multifaceted terrains of mines [11, 12]. Hence, an emergent need for adopting advanced technological methodologies to augment real-time surveillance of coal mine safety hazards has been highlighted in mine safety literature [13, 14].
In the backdrop of technological advancements, considerable strides in computer vision and deep learning are noted across diverse domains [15, 16], with a pronounced impact on object detection [17, 18]. The YOLO algorithm, known for its swift and efficient object detection capabilities, is acknowledged for its prowess in real-time processing and precision [19, 20]. When tailored for the surveillance of coal mine safety hazards, it is posited that the YOLO algorithm could potentially bridge the gaps presented by traditional techniques [21, 22], refining the real-time efficacy and accuracy of safety hazard surveillance [23, 24] and fortifying coal mine safety management mechanisms.
This research delves into harnessing the YOLO algorithm for real-time hazard monitoring in coal mines. Section 2 elucidates an algorithm specifically tailored for the detection of safety hazards in coal mines, incorporating attention mechanisms and multi-feature fusion. With the foundation on the YOLOv3 framework, the integration of the Gc Net attention module, the establishment of a reverse feature fusion pathway, and the design of a three-scale prediction module are detailed. Such enhancements have been associated with heightened sensitivity to hazards of diverse dimensions and configurations, solidifying the approach's adaptability in intricate settings. Section 3 delves into the enhancement of the model's loss function, which seeks to rectify the prevalent disparities in sample distribution, both in quantity and complexity. The culmination of the study presents experimental validations and charts potential trajectories for future research, envisioning substantial contributions to the realm of real-time coal mine hazard monitoring methodologies.
In the quest to enhance coal mine safety hazard monitoring, a fusion of attention mechanisms and multi-feature systems was introduced. For effective real-time monitoring of such hazards, two factors emerge as paramount: timeliness and accuracy. Accidents can only be preemptively averted through prompt and precise identification and location of these hazards. The YOLOv3 algorithm framework, renowned for its remarkable real-time and accuracy attributes, was thus chosen as the foundational structure. Recognizing the complexity of mine terrains, an elevation in the feature representation ability, achieved through attention mechanisms, was seen to bolster model precision in hazard detection. To augment the representation of these hazard features, a cascading model was delineated. This model integrates the attention mechanism of the Gc Net module between the backbone network and the prediction module. Additionally, the introduction of a reverse feature fusion path and a three-scale prediction module aimed to enhance the utility of detailed hazard information. Such integrations were found to be effective in discerning safety hazards of diverse magnitudes and forms, enhancing the algorithm's resilience in multifaceted settings.
Deeper network structures, such as DarkNet-53/101/152, as opposed to shallower ones like DarkNet-18/34, were identified to harness a broader spectrum of hierarchical features. Such intricate feature extraction capabilities were linked with superior algorithm performance in complex mine environments. A challenge noted with increased network depth is the exacerbation of gradient vanishing. However, the incorporation of residual connections and bottleneck structures in networks like DarkNet-53/101/152 appeared to counteract this gradient vanishing phenomenon, ensuring model stability and convergence during the training phase.
The computational framework for the residual module in the DarkNet-53/101/152 network can be captured by Eq. (1), illustrating convolution, activation, and normalization processes, denoted symbolically as d(·).
$\tilde{z}=d(\cdot)+z$ (1)
For monitoring tasks associated with coal mine safety hazards, a model resembling human selective focus—centering on pivotal details while disregarding redundant elements—is sought. In this context, the GcNet module, which combines the channel weight calibration attributes of the SeNet module with the global channel information consolidation capabilities of the N1Net module, has been highlighted. Notably, in intricate mining terrains, this robust feature extraction mechanism has been correlated with heightened algorithmic efficacy in real-world scenarios, affirming its pivotal role in precise detection and recognition of coal mine safety hazards.
Considering a convolution feature map where height and width are denoted by G and Q respectively, and the accompanying feature channel number is represented by V, the two convolution layers can be expressed as (qc1,qc2). When the input feature vector is symbolized as z and the total number of such feature vectors is represented by b, the integration of attention mechanisms into coal mine safety hazard detection means that the data from the coal mine safety hazard monitoring image processed by the module can be encapsulated within the matrix depicted by Eq. (2).
$z=\left(z_1, z_2, \ldots, z_b\right), z_b \in E$ (2)
In the realm of mine safety hazard monitoring, the emphasis on global spatial information is unequivocal. Such prioritization can be attributed to the spatial data's capacity to discern potential safety hazard affiliations with adjacent environments, thereby refining hazard identification and localization. The GcNet, by leveraging convolution layers and the normalization exponential function SoftMax, has been shown to underscore this global spatial data. At the same time, a channel number compression of the global attention feature map has been found to curtail the model's computational complexity. In real-time monitoring environments, such a reduction in complexity is understood to bolster the model's instantaneous responsiveness, aligning with the urgency inherent to mine safety surveillance. The GcNet module's architecture can be viewed in Figure 1.
Figure 1. Schematic representation of the GcNet module
In the appraisal of the suggested mine safety hazard detection model, the computation of global attention weights is identified as a fundamental element. The 1×1 convolution is represented by qj, the input feature map by z, and the SoftMax function by A(·). After computation using the SoftMax function, the output is denoted as D, with associated formulas illustrated below:
$A(t \mid z)=\sum_{k=1}^{B_o} \frac{\exp \left(t z_k\right)}{\sum_{l=1}^{B_o} \exp \left(t z_l\right)}$ (3)
$D=A\left(q_j \mid z\right) z$ (4)
The significance of global context information in the realm of mine safety hazard detection has been accentuated. It has been discerned that this context assists in apprehending global features within the mining environment, subsequently amplifying the model's hazard recognition aptitude. A dual convolutional structure has been adopted, enabling the model to utilize the compressed global context information more efficiently. After undergoing two convolution layers, normalization layers, and culminating with the LeakyReLU activation function, an enhancement in the attention mechanism's performance is noted. Such a mechanism accentuates crucial data, reinforcing the model's proficiency in pinpointing and discerning safety hazards within multifaceted mine environs. For the integration of global context data with local feature data, thereby achieving a harmonious and thorough feature extraction, the attention feature map is merged with the input feature map, culminating in a new, cohesive feature map.
The 1×1 convolution layers are denoted as qc1 and qc2, the normalization layer as MB, the LeakyReLU activation function as LR, the input feature map again by z, and the resultant output post the GcNet module integration as xu. The computation formula delineating the creation of this fused feature map is provided as:
$x_u=z+q_{c 2} L R\left(M B\left(q_{c 1}, D\right)\right), q_{c 1} \in E^{e V \times G \times Q}, q_{c 2} \in E^{V \times G \times Q}$ (5)
During activation function engagement, the input feature mapping dimension is maintained at GQ×1×1. It is postulated that the channel of this input feature mapping is symbolized by V and the channel reduction ratio by e. Following the qc1 convolution layer process, the channel number undergoes a transformation to eV. To synergize with the initial input feature map, the channel count of this feature map is reverted to V after progressing through the qc2 convolution layer.
Figure 2. Diagram depicting the three-scale prediction module
As depicted in Figure 2, a three-scale prediction module was designed to optimally exploit the intricate safety hazard features inherent in the shallow network feature maps of coal mines. Within the YOLOv3 framework, the Intersection over Union (IoU) has been utilized to calculate the discrepancy between predicted and actual bounding boxes, acting as an evaluative gauge for bounding box prediction quality. An elevated IoU value signifies an enhanced congruency between the predicted and actual bounding boxes, thus suggesting a commendably precise prediction. The actual bounding box data is symbolized as BK, the clustering centroid as JLZX, and the proportion of intersection to union as IoU. The mathematical representation for the IoU distance function is given by:
$f(B X, J L Z X)=1-\operatorname{IoU}(B X, J L Z X)$ (6)
In contrast to methods anchored in K-means clustering, the incorporation of Mean IoU (MIoU) as an evaluative metric was observed to elevate the consistency of clustering results. K-means clustering algorithms are known to potentially produce inconsistent clustering results, culminating in erroneous selections of K values and clustering boxes. However, the MIoU metric, when applied, provided a more steadfast evaluation of the disparities between diverse clustering results, thereby aiding in the discernment of more fitting K values and clustering boxes. The number of sample clusters, total samples, samples in the jth cluster center, sample index, and the index within the cluster center are denoted as j, b, lj, u, and k respectively. The mathematical construct for the MIoU objective function is:
$M I o U=\operatorname{argmax} \frac{\sum_{u=1}^j \sum_{k=1}^{l_j} \operatorname{IoU}(B X, J L Z X)}{b}$ (7)
Assuming the culminating bounding box information is symbolized as n*, the Sigmoid function as $\delta(\cdot)$, the absolute coordinates of the feature map cell's top-left corner as vz and vt, and the dimensions of the feature map in terms of width and height as oq and og respectively, the divergence between the projected and actual bounding boxes is depicted as y*. The methodology encompassing the division of the feature map into cells, followed by the apportionment of prior boxes based on bounding box generation, is articulated as:
$\left\{\begin{array}{l}n_z=\delta\left(y_z\right)+v_z \\ n_t=\delta\left(y_t\right)+v_t \\ n_q=o_q r^{y_q} \\ n_g=o_g r^{y_g}\end{array}\right.$ (8)
In imagery from coal mine safety hazard monitoring, a disparity is often observed regarding the distribution, both in quantity and complexity, of positive and negative samples. The prevalence of negative samples (regions devoid of hazards) significantly surpasses that of positive samples (regions depicting hazards), while samples presenting intricate identifications remain comparatively infrequent. Through the enhancement of the confidence loss function, such imbalances have been addressed, enabling the model to allocate enhanced attention to samples that present increased complexity during the training phase.
In order to accentuate learning from samples that garner lower scores, the confidence loss function of the devised model is symbolized as LCO, with the sample's confidence denoted by o. The ensuing formulation is thereby introduced:
$L_{C O}=\left\{\begin{array}{l}-\ln (o), L A=1 \\ -\ln (1-o), L A=0\end{array}\right.$ (9)
Prior to the integration of the loss function, various equilibration factors are incorporated. It is assumed that the sigmoid function is portrayed by $\delta$, the confidence by o, a minuscule constant by $\zeta$, and the class label by t. From these assumptions, the subsequent relationships emerge:
$L_{K D}=\left\{\begin{array}{l}-[2 \lambda-1] \times \ln (o), t=1 \\ -\left[\frac{1}{\lambda}-1\right] \times \ln (1-o), t=0\end{array}\right.$ (10)
$\lambda=\delta\left(\frac{1}{o+\zeta}-1\right)$ (11)
Upon inspection of a positive sample extracted from coal mine safety hazard monitoring imagery, as o verges towards 1, [2λ-1] converges to 0, implying a negligible weight associated with the easily discernible sample. Conversely, as o nears 0, [2λ-1] gravitates towards 1, insinuating an erroneous hazard classification during the monitoring phase. Under such circumstances, the imposition of a penalty weight is recommended.
Bounding box regression has been recognized as an imperative component in the realm of coal mine safety hazard monitoring. Within this framework, the GIOU loss function has been adopted. Given that the smallest exterior rectangle encompassing two boxes is signified as V, the union of the two boxes as $N \cup N^{h y}$, and the area of V minus $N \cup N^{h y}$ is represented as V\$N \cup N^{h y}$, the ensuing calculation is proposed:
$L_{G I o U}=1-G I o U=1-I o U+\frac{\left|V \backslash N \cup N^{h y}\right|}{|V|}$ (12)
The DIOU metric, by taking into account the distance between the anticipated and target boxes, their overlap rate, and the effects of scale, offers a more nuanced quantification of discrepancies. A heightened accuracy in target localization is thus achieved when the DIOU loss is utilized. For real-time coal mine safety hazard monitoring applications, the DIOU is integrated to compute the loss value between the target and predicted boxes of the model.
Given that the centers of the anticipated and actual boxes are symbolized as N and Nhy respectively, the Euclidean distance between these central points is characterized by $\vartheta$. Further, the diagonal distance of the minimal enclosing region containing both N and Nhy is denoted by V. The computational formula for DIOU is presented:
$L_{D I o U}=1-D I o U=1-I o U+\frac{\vartheta^2\left(N \cup N^{h y}\right)}{V^2}$ (13)
During the training phase, the constitutive elements of the model's loss function encompass the bounding box loss, classification loss, and confidence loss functions.
$L O S S_{Y O L O}=L_{G I}+L_{C O}+L_{C L}$ (14)
For analytical purposes, let the comprehensive loss function be symbolized as LOYO, the bounding box loss function as LGI, the classification loss function as LCL, and the confidence loss function as LCO. The bounding box loss function undergoes enhancement to LDIoU, while the confidence loss function experiences enhancement to LKD. Assuming the total grid count is represented by A×A and the cumulative bounding box number by N, the presence or absence of the intended detection target is depicted by OB and NO respectively. The onus of prognosticating the target within the uth grid's kth bounding box is represented by UOBuk. If UNOuk is set at 1, the kth bounding box in the uth grid is devoid of the target essential for detection. In contrast, a value of 0 for UNOuk indicates the presence of the detection target. The refined comprehensive loss function is articulated as:
$L O S S_{Y O L O}=L_{D I o U}+L_{K D}+L_{C L}$ (15)
$L_{D I o U}=\sum_{u=0}^{A^2} \sum_{k=0}^N U_{u k}^{O B}(1-D I o U)$ (16)
$\begin{aligned} & L_{K D}=-\sum_{u=0}^{A^2} \sum_{k=0}^N U_{u k}^{O B}\left[(2 \beta-1) \hat{V}_u^k+\left(\frac{1}{\beta}-1\right)\left(1-\hat{V}_u^k\right) L N\left(1-\hat{V}_u^k\right)\right] \\ & +\eta_{N O} \sum_{u=0}^{A^2} \sum_{k=0}^N U_{u k}^{N O}\left[(2 \beta-1) \hat{V}_u^k+\left(\frac{1}{\beta}-1\right)\left(1-\hat{V}_u^k\right) L N\left(1-\hat{V}_u^k\right)\right]\end{aligned}$ (17)
$\beta=\delta\left(\frac{1}{V_u^k+\zeta}-1\right)$ (18)
When projecting the confidence of the anticipated bounding box, it is designated as $V_u^k$. The class label is also termed $V^k{ }_u$, a minute constant is expressed as $\zeta$, the Sigmoid function is signified as $\delta$, and the class probabilities of both the predicted and actual target bounding boxes are identified as $O^k{ }_u$. This leads to the establishment of the subsequent relationship:
$L_{C L}=-\sum_{u=0}^{A^2} U_{u k}^{O B} \sum_{v \in C S}\left[\hat{o}_u^k L N o_u^k+\left(1-\hat{o}_u^k\right) L N\left(1-o_u^k\right)\right]$ (19)
1) Natural hazards (ZR)
2) Technical hazards (JS)
3) Management hazards (ZR)
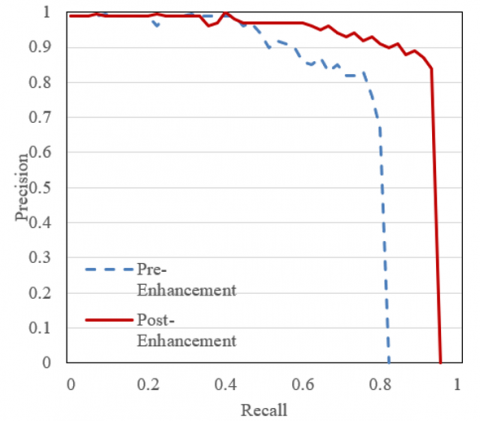
Figure 3. Comparison of P-R curve of different types of coal mine safety hazards before and after improvements
In Figure 3, alterations in the Precision-recall metrics for various coal mine safety hazards, notably natural hazards, technical hazards, and management hazards, before and after procedural improvements, are delineated. From the graphical data, Precision-recall metrics, before enhancements, are observed to oscillate between 0.67 and 0.98, reflecting a discernible volatility. Such variations indicate that the precision and recall rates in identifying these categories of hazards were initially not optimal. Post the introduction of advancements, a marked elevation in the Precision-recall values, spanning 0.8 to 0.999, is witnessed, indicative of a more consistent performance. Through this analysis, it is discerned that the enhanced methodology for identifying coal mine safety hazards manifests notable improvements in both precision and recall rates. The inference can thus be drawn that this enhanced methodology offers a more precise identification of genuine hazards, contributing significantly to the elevation of safety production standards in coal mines.
The insights derived from Figure 4 underscore the frequency of accurate and erroneous detections across multiple sample sets. Within Sample Set 1, a variance in correct detection quantities is noticed, spanning from 120 to 315. Conversely, Sample Set 2 demonstrates a broader range, extending from 3950 to 10100. Such differences shed light on the fluctuating proficiency of the hazard identification technology across distinct sample sets. The zenith of accurate detections is pinpointed at 315 (observed in sample 4), suggesting that the technology can, under specific circumstances, exhibit a high degree of efficacy in hazard detection. Erroneous detections are recorded to be minimal across samples, with counts for Sample Set 1 and Sample Set 2 ranging between 4 to 25 and 405 to 1040 respectively. These figures imply commendable performance in reducing false positives, though avenues for augmentation are still apparent. Drawing from this analysis, the coal mine safety hazard identification technology is deduced to manifest varying degrees of performance concerning correct detections, but demonstrates notable competency in minimizing false positives. The insights derived suggest that while the technology possesses a commendable degree of accuracy, there remains potential for further refinement, particularly to achieve consistency across diverse sample sets. Given the varied characteristics of samples, there exists an opportunity to further fine-tune the technology to enhance its applicability and performance in real-world scenarios.
1) Sample Set 1
2) Sample Set 2
Figure 4. Correct and incorrect detection results in different sample sets
Figure 5. Visual representation of detection comparative analysis: Pre-enhancement, post-enhancement, and faster-RCNN algorithm
Table 1. Comparison of detection accuracy among different models
|
Category |
Faster R-CNN |
SSD |
YOLOv2 |
Pre-Enhancement |
Post-Enhancement |
|
Crack |
72.93% |
52.94% |
73.93% |
84.93% |
85.38% |
|
Damage |
59.38% |
34.68% |
39.74% |
43.29% |
71.83% |
|
Mine Water Accumulation |
57.93% |
47.05% |
43.65% |
46.29% |
73.02% |
|
Miner Equipment and Behavior |
53.29% |
39.48% |
39.45% |
42.85% |
83.83% |
|
Minecart Operational Anomaly |
52.45% |
24.73% |
62.94% |
71.94% |
88.03% |
|
Mine Fire Source |
69.37% |
53.93% |
32.48% |
69.29% |
72.40% |
|
Waste Accumulation |
57.28% |
35.92% |
43.85% |
62.93% |
71.03% |
|
Sidewall Collapse |
52.48% |
23.94% |
54.93% |
61.39% |
83.96v |
|
Passageway Blockage |
52.68% |
39.37% |
42.67% |
52.92% |
83.92% |
|
Insufficient Lighting |
42.69% |
54.00% |
42.84% |
71.09% |
86.92% |
|
Production Order |
62.42% |
30.29% |
43.95% |
54.29% |
74.01% |
Table 2. Analytical comparison of recall and precision metrics: Pre and post enhancement
|
Way |
P_ZR |
P_JS |
P_GL |
R_ZR |
R_JS |
R_GL |
|
Pre-Enhancement |
83.94 |
82.94 |
82.94 |
65.92 |
50.19 |
90.13 |
|
Post-Enhancement |
68.29 |
71.93 |
76.93 |
56.28 |
41.03 |
81.11 |
Figure 6. Comparative visual depiction of coal mine safety hazard detection pre and post model enhancement
In Table 1, precision discrepancies among diverse models deployed for coal mine hazard detection are delineated. Precision performance for the Faster R-CNN is noted to vary markedly across categories, with recorded values spanning from 42.69% to 72.93%. The highest precision is attributed to the "cracks" category, marked at 72.93%, whereas the "insufficient lighting" category is discerned to have the lowest at 42.69%. SSD's precision performance is similarly characterized by marked variations, ranging from 23.94% to 54.00%. Notably, the category "insufficient lighting" stands out with a precision of 54.00%, while "sidewall collapse" is identified as the least precise at 23.94%. Variation is again evident in YOLOv2’s performance, with metrics fluctuating between 32.48% and 73.93%. "Cracks" emerges as YOLOv2's most precisely identified category at 73.93%, with "mine fire source" presenting the least precision at 32.48%. Prior to enhancements, the model demonstrated considerable performance inconsistency, with precision values oscillating between 42.85% and 84.93%. The "cracks" category is observed to dominate with a precision of 84.93%, while the "miner's equipment and behavior" category registers the least at 42.85%. In contrast, post- enhancement, the model exhibits more constrained variations, with precision metrics ranging between 71.83% and 88.03%. The "abnormal mine cart operation" category stands out as the most precise at 88.03%, while "damage" ranks lowest at 71.83%. A comparative analysis suggests that the refined model, when benchmarked against Faster R-CNN, SSD, and YOLOv2, exhibits enhanced and more consistent precision across hazard categories. Such findings imply that the advanced model holds the potential to identify coal mine safety hazards with heightened accuracy, thus contributing to a potential elevation in coal mine safety standards. The practical implications of integrating this refined model remain promising, a sentiment further illustrated in Figure 5, which visually contrasts detection results across the pre-improved, post-improved, and Faster-RCNN algorithms.
Through the data presented in Table 2, Precision-recall metrics for various technical hazard categories in coal mine safety, both pre and post enhancement, are elucidated. Upon examination of these figures, the following determinations were made: Prior to enhancement, the Precision for natural hazards was documented at 68.29%, while Recall was noted at 56.28%. In the realm of technical hazards, Precision stood at 71.93%, paired with a Recall of 41.03%. Management hazards, conversely, showcased a Precision of 76.93% and a Recall of 81.11%. Subsequent to the enhancement process, Precision values for natural hazards experienced an ascent to 83.94%, while Recall adjusted to 65.92%. Technical hazards reported a Precision of 82.94% and Recall was recognized at 50.19%. Similarly, management hazards' Precision settled at 82.94% with an observed Recall boost to 90.13%. Drawing from these comparative metrics, it was discerned that the refined algorithm exhibited notable augmentations in both Precision and Recall, spanning natural, technical, and management hazards. Such advancements in algorithmic performance suggest heightened precision in coal mine safety hazard detection and a corresponding rise in recall. Therefore, within applied settings, integration of the herein presented enhanced algorithm may yield heightened detection results pertaining to coal mine safety hazards.
In Figure 6, an analytical juxtaposition of mAP values for distinct coal mine safety hazards, both prior to and following model enhancement, is showcased. The pre-enhancement model's mAP values were found to oscillate between 0.75 and 0.93. Noteworthy peaks in mAP values were identified within categories such as cracks, damage, water accumulation in mines, abnormal mine cart operations, mine fire sources, sidewall collapses, insufficient lighting, and production order, all equating to or surpassing the 0.9 mark. Post-enhancement, the model's mAP values consistently hovered within a bandwidth of 0.8 to 0.93. Within this refined performance, categories like abnormal mine cart operations, mine fire sources, and production order emerged as the zenith, all registering at 0.93. Through this analysis, it was inferred that the refined algorithm not only showcased elevated mAP values across a majority of coal mine safety hazard categories but also maintained a more balanced performance profile. Such findings point toward the conclusion that the enhanced algorithm, through its superior mAP metrics, promises enhanced detection accuracy in coal mine safety hazards. In tangible settings, harnessing this enhanced algorithm may translate to superior detection efficacy concerning coal mine safety hazards.
A comprehensive examination was undertaken to elucidate the real-time monitoring capabilities of coal mine safety hazards using the YOLO algorithm. A distinct algorithm, which seamlessly integrates attention mechanisms with multi-feature fusion, was proposed within the framework of the esteemed YOLOv3 algorithm. Notably, the integration of the attention mechanism, denoted as the Gc Net module, was observed, and a reverse feature fusion path was incorporated. Furthermore, a tri-scale prediction module was meticulously designed, posited to adeptly capture safety hazards across diverse magnitudes and configurations. This enhancement bolsters the algorithm's resilience in multifaceted environments. Simultaneously, efforts were directed towards enhacing the model's loss function, a step that addresses the recurrent issue of unbalanced distributions in positive and negative sample quantities, as well as the disparities in their inherent complexities.
Drawing from the experimental outputs, the ensuing determinations were made:
(1) When subjected to the rigorous task of monitoring coal mine safety hazards, the enhanced model was discerned to manifest consistent and superior accuracy across hazard categories. Relative to algorithms such as Faster R-CNN, SSD, and YOLOv2, a heightened precision in the detection of coal mine safety hazards by the improved model was revealed. Such findings underscore the model's refined capability to pinpoint coal mine safety hazards, a factor intrinsically tied to bolstering safety standards in coal production.
(2) A pivot to the Precision-recall metrics for specific technical hazard categories within coal mine safety unveiled discernible ameliorations in Precision and Recall for natural hazards, technical hazards, and management hazards post-enhancement. This observation resonates with the assertion that the refined algorithm possesses an enhanced acumen to identify coal mine safety hazards with heightened precision, complemented by a pronounced uptick in recall rates.
(3) With regard to the mAP values spanning diverse coal mine safety hazard categories, a post-improvement surge in mAP values for the majority of these categories was identified. This robust performance profile implies that, in terms of accuracy, the enhanced algorithm is endowed with a superior prowess, as evidenced by its augmented mAP metrics.
In encapsulation, when integrated within real-world settings, the deployment of the refined algorithm holds promise in furnishing superior coal mine safety hazard detection outcomes. Experimental outcomes corroborated the model's augmented capabilities in the identification of coal mine safety hazards, positing it as a pivotal asset in amplifying safety protocols in coal production.
This paper was supported by the following projects: Key Research Project of Higher Education Institutions in Henan Province (Grant No.: 21A520036); Young Core Teacher Training Program of Higher Education Institutions in Henan Province (Grant No.: 2021GGJS148); Henan Provincial Science and Technology Plan Project (Grant No.: 222102210214).
[1] Miao, M., Zhang, K., Zhang, L., Guo, T. (2022). Reflection on the role of fossil energy in China’s energy transition. 10th Academic Conference of Geology Resource Management and Sustainable Development 2022, 2: 683-690.
[2] Li, T., Duan, Z., He, H., Song, H. (2023). Study on the carrying capacity and change trend of groundwater resources in coal mining area: A case study of a coal mine in Northwest China. Water, 15(8): 1551. https://doi.org/10.3390/w15081551
[3] Li, S., You, M., Li, D., Liu, J. (2022). Identifying coal mine safety production risk factors by employing text mining and Bayesian network techniques. Process Safety and Environmental Protection, 162: 1067-1081. https://doi.org/10.1016/j.psep.2022.04.054
[4] Zhang, B., Li, S., Wang, W., Zhang, C., Wang, H., Yuan, L. (2020). A novel apparatus for dynamic-static coupling tests on gas-adsorbed coal. Geotechnical Testing Journal, 43(6): 1353-1367.
[5] Xu, J. (2020). Early warning wndex and application of roof disaster in fully mechanized mining face. In 2020 International Conference on Urban Engineering and Management Science (ICUEMS), IEEE, pp. 554-558. https://doi.org/10.1109/ICUEMS50872.2020.00122
[6] Yu, G.F., Yuan, L., Ren, B., Li, L.C., Cheng, G.W., Han, Y.C., Mu, W.Q., Wang, S.X., Wei, T.S., Zheng, Q., Ma, J.G. (2021). Big data prediction and early warning platform for floor water inrush disaster. Journal of the China Coal Society, 46(11): 3502-3514. https://doi.org/10.13225/j.cnki.jccs.2020.1788
[7] Zou, Z., Zheng, L., Huang, J., Li, J., Wang, J. (2018). Design and implementation of coal mine dust monitoring system based on cloud platform. In Proceedings of the 2nd International Conference on Computer Science and Application Engineering, pp. 1-8. https://doi.org/10.1145/3207677.3278028
[8] Du, Y. (2017). Supporting condition acquisition and fuzzy comprehensive evaluation method for hydraulic support. Journal of the China Coal Society, 42: 260-266.
[9] Gang, W.X., Li, L.H., Hui, L.G. (2020). Influencing factors of eco-environmental safety of mines and their green development: A case study of taoshan coal mine in Heilongjiang province, China. Nature Environment & Pollution Technology, 19(2): 831-838. https://doi.org/10.46488/NEPT.2020.v19i02.041
[10] Liu, Q., Wang, J., Qiu, Z. (2023). Data as evidence: Research on the influencing factors and mechanisms of coal mine safety supervision effect in China. Resources Policy, 81: 103298. https://doi.org/10.1016/j.resourpol.2023.103298
[11] Wang, J.Q., Cao, Q.G., Mi, X., Li, D. (2020). Research on safety evaluation of bolt support based on analytic hierarchy process-entropy weight method. In E3S Web of Conferences, 213: 03019. https://doi.org/10.1051/e3sconf/202021303019
[12] Zhang, J.H., Chen, M., Liu, Y.H., Yao, P.J. (2022). A network communication frequency routing protocol of coal mine safety monitoring system based on wireless narrowband data communication network. Mobile Information Systems, 2022: 1-8. https://doi.org/10.1155/2022/4906599
[13] Liu, X.J., Liu, L. (2014). Design of coal mine monitoring system based on Internet of Things. In: Pan, L., Păun, G., Pérez-Jiménez, M.J., Song, T. (eds) Bio-Inspired Computing - Theories and Applications. Communications in Computer and Information Science, Springer, Berlin, Heidelberg, 472. https://doi.org/10.1007/978-3-662-45049-9_46
[14] Shen, Y., Li, Y., Li, Z. (2022). Application of intelligent inspection robot in coal mine industrial heritage landscape: Taking Wangshiwa coal mine as an example. Frontiers in Neurorobotics, 16: 865146. https://doi.org/10.3389/fnbot.2022.865146
[15] Bayoudh, K., Knani, R., Hamdaoui, F., Mtibaa, A. (2022). A survey on deep multimodal learning for computer vision: Advances, trends, applications, and datasets. Visual Computer, 38(8): 2939-2970. https://doi.org/10.1007/s00371-021-02166-7
[16] Peng, H., Guo, R. (2023). Supplemented with reinforcement learning to improve the detection of passive remote sensing devices. Signal Processing, 209: 108977. https://doi.org/10.1016/j.sigpro.2023.108977
[17] Zhang, Y.M., Li, R.Q. (2023). A lightweight multi-target detection method for infrared remote sensing image ships. Journal of Network Intelligence, 8(2): 535-545.
[18] Sinha, J., Harshavardhana, B.G., Sinha, A.K., Das Mahapathra, S. (2022). A review on remote sensing and GIS technique-based morphometric analysis. Flexible Electronics for Electric Vehicles: Select Proceedings of FlexEV-2021, 333-342. https://doi.org/10.1007/978-981-19-0588-9_34
[19] Kumar, A., Kalia, A., Sharma, A., Kaushal, M. (2021). A hybrid tiny YOLO v4-SPP module based improved face mask detection vision system. Journal of Ambient Intelligence and Humanized Computing, 14(6): 6783-6796. https://doi.org/10.1007/s12652-021-03541-x
[20] Zhang, L.L., Chen, Z., Liu, Y.X., Qu, L.L. (2023). Yolo v3-SPP real-time target detection system based on ZYNQ. Optics and Precision Engineering, 31(4): 543-551.
[21] Huang, H. (2023). Research on binocular vision ranging based on YOLO algorithm and stereo matching algorithm. In Second International Conference on Electronic Information Engineering, Big Data, and Computer Technology (EIBDCT 2023), 12642: 274-279. https://doi.org/10.1117/12.2674944
[22] Dewi, C., Chen, R. C., Jiang, X., Yu, H. (2022). Deep convolutional neural network for enhancing traffic sign recognition developed on Yolo V4. Multimedia Tools and Applications, 81(26): 37821-37845. https://doi.org/10.1007/s11042-022-12962-5
[23] Xu, K., Xu, Y., Xing, Y., Liu, Z. (2023). YOLO-F: YOLO for Flame Detection. International Journal of Pattern Recognition and Artificial Intelligence, 37(1): 2250043. https://doi.org/10.1142/S0218001422500434
[24] Song, H.B., Li, R., Wang, Y.F., Jiao, Y.T., Hua, Z.X. (2023). Recognition method of heavily occluded beef cattle targets based on ECA YOLO v5s. Transactions of the Chinese Society for Agricultural Machinery, 54(3): 274-281.