Sunita Yadav![]() | Jay Kant Pratap Singh Yadav*
| Jay Kant Pratap Singh Yadav*![]()
© 2023 IIETA. This article is published by IIETA and is licensed under the CC BY 4.0 license (http://creativecommons.org/licenses/by/4.0/).
OPEN ACCESS
Cataracts, characterized by the opacification of the eye lens leading to visual deterioration, pose a significant global health issue. Timely and accurate detection of cataracts is pivotal for halting disease progression and augmenting the patients' quality of life. However, conventional diagnostic approaches for cataract detection and grading rely heavily on the expertise of ophthalmologists, a solution that can be unduly costly and inaccessible for certain population segments seeking early intervention. Addressing this challenge, the present study introduces a computer-assisted diagnostic strategy for the detection and grading of cataracts, drawing on fundus retinal images. The proposed approach capitalizes on a deep convolutional neural network to extract features from fundus images, which are subsequently evaluated via three distinct classification algorithms: Support Vector Machine, Naive Bayes, and Decision Tree. The resultant categorization stratifies the images into four severity levels: mild, moderate, normal, and severe. Further enhancing the classifier's prediction accuracy, an Ensemble (ES) learning mechanism via a Majority Voting Scheme (MVS) process is incorporated into the study. A total of 1600 fundus images, sourced from various open-access databases and classified into four categories by an expert ophthalmologist, were utilized for the study. The proposed methodology demonstrated a commendable accuracy rate of 97.34% in the four-stage cataract classification and grading, outperforming existing methodologies. This research advances the field by introducing a reliable, cost-effective, and accessible solution for early cataract detection, contributing significantly to global health improvements.
cataract, convolutional neural network, G-channel, support vector machine, decision tree, naïve bayes, fundus images
Visual acuity, a fundamental aspect of human perception, is compromised for a significant proportion of the global population. As documented by the World Health Organization (WHO) in 2010, an estimated 285 million individuals globally suffer from some degree of visual impairment, with 39 million classified as completely blind and 246 million exhibiting moderate to severe visual impairments (MSVI) [1]. The International Agency for the Prevention of Blindness, in its 2015 report, stated that out of a global population of 7.3 billion, 252 million individuals had visual impairments, including 36 million blind and 216 million with MSVI [2].
Figure 1. A comparative analysis of statistics on vision impairments from WHO (Years 2010 and 2015)
This situation, as illustrated in Figure 1, has seen only marginal improvements over the last five years. In response, the WHO launched a global initiative, "VISION2020: The Right to Sight," aimed at addressing this issue [3]. However, a staggering 90% of the visually impaired population resides in developing nations, where access to adequate healthcare resources remains a challenge. Nevertheless, estimates suggest that 75% of visual impairments are preventable, equating to approximately four out of five cases that could be treated effectively [4].
In India, where nearly 8 million people suffer from blindness—largely concentrated in rural or underdeveloped regions—the prevalence of blindness is estimated at 1.1% [2, 5]. Despite early initiatives to counteract blindness, challenges persist due to factors such as inadequate access to eye care, limited public health resources, lack of awareness, limited access to technology, and cultural attitudes. Figures 2(a) and 2(b) highlight cataracts as a leading cause of visual impairments both globally and in India [6]. Cataracts, often resulting from factors like aging, obesity, radiation exposure, and diabetes, can be effectively managed through early detection and intervention. This underscores the need for a computer-based diagnostic system capable of accurate cataract assessment and categorization using non-invasive methods.
The advent of fundus imaging has revolutionized eye health monitoring, thanks to the existence of non-mydriatic fundus cameras. These devices are user-friendly and produce high-quality images that facilitate prompt detection and treatment of eye conditions [7]. The introduction of portable fundus imaging devices and the transformation of smartphones into fundus cameras have stimulated research interest in fundus images and the development of cost-effective solutions for early eye disease diagnosis—especially in resource-limited rural areas [8]. However, the use of fundus images for cataract detection and grading poses several challenges, such as the need for manual feature extraction, limited and imbalanced datasets, and the requirement of expert ophthalmologists to determine the accuracy of retinal image diagnoses.
Figure 2. Statistics on causes of blindness (a) worldwide (b) India
Recently, deep learning has emerged as a prominent area of research in the domains of image processing and computer vision and the use of deep convolutional neural networks (D-CNNs) as deep neural networks for analyzing images is widespread. Unlike traditional methods, D-CNNs do not require human intervention and can automatically identify patterns and features in images. This has made them popular for disease diagnosis, where medical images are processed by D-CNNs to extract features, which are then used by a classifier for disease detection and severity classification. However, it has been observed that different classifiers can lead to varying classification results and may not be effective in all cases. The technique of ensemble (ES) learning is employed, which involves the integration of several classifiers to produce a more accurate classifier. This also helps to mitigate overfitting in D-CNNs by reducing dependence on a single model and taking into account the predictions of multiple models.
Given aforementioned discussion, this study endeavors to create an automated system for detecting and categorizing cataracts in fundus images. A collection of fundus images exhibiting varying levels of cataracts was obtained from multiple public datasets and categorized into four groups (normal, mild, moderate, and severe) by professional ophthalmologists, as depicted in Figure 3. The proposed method uses a hybrid approach that combines the capabilities of a Convolutional Neural Network (CNN) for extracting features from the fundus images and ES learning to merge three classifiers: Support Vector Machine (SVM), Naive Bayes (NB), and Decision Tree (DT). The majority voting scheme (MVS) is used to weigh the predictions of these three classifiers, resulting in a more accurate classifier. The performance of the proposed method was evaluated using several evaluation metrics, including accuracy, precision, specificity, recall, F1 score, and the AUC. The outcomes of this study will contribute to the creation of an effective and non-invasive computer-aided diagnosis system for the early detection of cataracts.
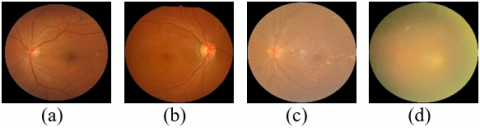
Figure 3. Classification of fundus images based on cataract’s severity (a) normal (b) mild (c) moderate (d) severe
This study is a pioneering effort in the field of cataract diagnosis using fundus images. The research aimed to develop an efficient and non-invasive computer-aided diagnosis system for the early detection of cataracts. The novelty of this study lies in its two-fold approach. First, the custom designed CNN model has fewer layers, smaller parameters, and smaller-sized kernels, which reduces the computational cost significantly. Second, the EL method, which uses MVS on the predictions of three classifiers, namely SVM, NB, and DT, is applied to improve the robustness and reliability of the diagnosis system.
The major contributions of this study are as follows:
1. To design a custom CNN model that reduces the computational cost, making it more accessible for practical applications.
2. To use ES learning approach that combines the predictions of three classifiers (SVM, NB, and DT), leading to a more accurate diagnosis.
3. To use preprocessing steps, such as G-filtering, resizing, and normalization, are applied to enhance the quality of the fundus images.
4. To evaluate the performance based on accuracy, precision, specificity, recall, F1 score, and AUC to demonstrate its efficiency.
This study will contribute significantly to the development of an efficient and non-invasive computer-aided diagnosis system for the early detection of cataracts, which will have a positive impact on patient care, especially in rural areas where access to medical facilities is limited.
The remaining paper is structured as follows: Section 2 presents a review of previous studies in the field. In Section 3, the methodology and materials of the proposed approach are explained, including the formation of a fundus image dataset, data augmentation and pre-processing, extraction of features using the CNN model, and classification through the ES learning of three classifiers using MVS. The experimental results and evaluations are discussed in Sections 4 and 5, respectively. Finally, Section 6 concludes the paper.
The process of detecting and grading cataracts from retinal images is a common area of focus in the medical imaging industry and typically follows a three-steps: pre-processing, extraction of relevant features, and final classification as depicted in Figure 4. The first step, preprocessing, enhances the clarity of the fundus images through techniques such as resizing, G-filtering, and normalization. Since fundus images obtained from various sources are of varying sizes, the resizing stage standardizes them to a uniform size, making them suitable for further processing by a CNN. G-filtering involves extracting the G-Channel from the RGB fundus images, which helps eliminate variations in illumination. The G-Channel images retain crucial features of the original images and are clearer than the other channels. Second, the feature extraction step can be performed using either manual or automatic methods. Last, the classification step uses the extracted features to determine the presence and severity of cataracts.
Figure 4. Major steps of cataract identification and classification systems
The literature review is separated into two distinct parts based on the method of feature extraction: (1) manual cataract detection using traditional techniques, and (2) automatic cataract detection using deep learning. In the first section, image processing is utilized to extract hand-crafted features which are then used to classify cataracts through the application of conventional machine learning algorithms. The second section focuses on the use of deep learning algorithms to automatically identify features in fundus images, which are then utilized for training and evaluating machine learning classifiers for cataract classification.
2.1 Cataract detection using conventional method
Conventional methods involve utilizing image processing techniques to extract hand-crafted features and then classifying cataracts using conventional machine learning algorithms. Recently many researchers worked with conventional methods, the work of some of them are discussed below:
Guo et al. [9] used wavelet transform and sketch-based features to develop and evaluate multiclass discriminant analysis algorithms for identifying and categorizing cataracts from fundus images. Their results shows that the accuracy for the wavelet transform-based features is 90.9% for two-class classification and 77.1% for four-class classification, while the accuracy for sketch-based features is 86.1% for two-class and 74.0% for four-class classification.
Cao et al. [10] employed the improved Haar-Wavelet transform to identify suitable features for cataract grading. The approach involved breaking down the four-class classification challenge into three separate two-class classifications through a hierarchical methodology, and subsequently training neural network-based classifiers on each of these two-class problems. The final 4-class classification result is obtained by combining the outcomes from all the 2-class classifiers, resulting in a 2-class accuracy of 94.83% and 4-class accuracy of 85.98%.
Yang et al. [11] developed a method that involved an improved Top-bottom hat transformation to increase contrast and a trilateral filter to decrease noise. The luminance and texture of the images are extracted as features for classification, and a backpropagation neural network (BPN) is employed to identify cataracts using these features. The accuracy of this classification approach is found to be 82.9%.
Yang et al. [12] proposed a cataract detection and grading system that combines multiple machine learning algorithms. The system obtains a wide range of features from fundus images, such as wavelet, sketch, and texture-based features. An ES of a BPN and SVM classifiers are used to make predictions, and the final results are determined through MVS and stacking. The system achieved an accuracy of 93.2% for cataract detection and 84.4% for cataract grading.
Zheng et al. [13] proposed a method for classifying cataracts using 2-D DFT spectrograms of fundus images as classification features. To reduce the dimensionality of the feature vectors, the method employs principal component analysis (PCA) and trains and evaluates the LDA classifier using the Adaboost algorithm. The method achieved a two-class classification accuracy of 95.22% and a four-class classification accuracy of 81.52%.
Fan et al. [14] presented a method utilizing PCA for reducing the feature dimensionality of fundus images obtained through wavelet and sketch-based techniques. The aim of this technique is to minimize computational demands while employing commonly utilized classification algorithms, such as SVMs, Bagging, DT, Gradient Boosting, and Random Forests (RF) to categorize cataracts.
Song et al. [15] introduced a technique for cataract classification that incorporates an advanced semi-supervised learning approach to obtain additional information from unlabeled fundus images of cataracts, along with the standard three image features of texture, wavelets, and sketches. This system integrates multiple binary classifiers into a robust multi-classifier, yielding an accuracy of 88.60% for a 4-class categorization.
Pratap and Kokil [16] investigated a system for cataract detection that employs SVD (singular value decomposition) for feature extraction from fundus images and utilizes a SVM as a classifier. The evaluation of this approach revealed a 2-class classification accuracy of 97.78%.
Nur et al. [17] proposed a technique that leverages the Gray Level Co-occurrence Matrix (GLCM) to extract features of contrast, correlation, energy, and homogeneity from fundus images and uses the k-Nearest Neighbors (k-NN) classifier to identify cataracts. The highest accuracy attained by this method is 80% when k was set to 5.
It can be observed from the preceding discussion that both Slit-lamp and conventional hand-crafted feature-based methods for automatic cataract detection have certain shortcomings:
1. The conventional methods require manual extraction and selection of features, which is a time-consuming process that requires the assistance of ophthalmologists at every stage of cataract detection.
2. The cost of hand-crafted methods is high, and their accuracy is low, limiting their ability to detect only certain types of cataracts.
3. Conventional methods also require a significant amount of time to train the system, as they rely on human help for feature extraction, making it difficult to identify finer details clearly for cataract classifications.
2.2 Cataract detection using deep learning methods
The utilization of deep learning has demonstrated its capability to automatically extract features and overcome limitations in the field of cataract classification and grading. A number of researchers have devoted significant efforts to the development of deep learning models for this purpose, with some of their works being presented in the literature.
Zhang et al. [18] introduced an 8-layer Deep D-CNN to assess its performance and efficiency in automatic cataract detection and classification. The D-CNN consisted of five convolutional layers followed by three fully connected layers, with the output of the last fully connected layer being used as input for a softmax classifier that produces a distribution across four classes. The highest accuracy achieved by the proposed method is 93.52% for cataract detection and 86.69% for cataract grading.
Ran et al. [19] developed an approach for six-level cataract grading using a combination of D-CNN and Random Forests (RF). The DCNN is comprised of three modules for feature extraction at different levels on fundus images, while the RF algorithm performs more precise six-level cataract grading based on the features extracted by the DCNN. The proposed method demonstrates an average accuracy of 90.69% for the six-level cataract grading task.
Li et al. [20] introduced a technique that combined deep learning with ResNet-10 and ResNet-50 to train on 7030 images. The ResNet-50 approach is complex due to its deep layers and large volume of data. The technique achieved 97.25% accuracy for cataract detection through two-level image classification and 87.7% accuracy for cataract grading.
Imran et al. [21] presented a method that uses a combination of Self-Organizing Maps (SOM) and Radial Basis Function (RBF) neural networks for automatic cataract detection and grading. The SOM algorithm is utilized to derive initial centers, which are then fed as inputs to the RBF network for cataract classification and grading. This method achieved 95.3% accuracy for cataract detection and 91.7% accuracy for cataract classification into four classes.
Syarifah et al. [22] improved the performance of the Deep CNN (DCNN) by utilizing a pre-trained CNN architecture known as AlexNet with a lookahead optimizer on SGD and Adam. This method has a two-class classification accuracy of 97.5%. However, the approach faced challenges due to the small size of the dataset used.
Junayed et al. [23] presented CataractNet, a novel convolutional neural network architecture characterized by a reduced number of layers, lower training parameters, and compact kernel sizes. This design strategy aimed to decrease computational time and expense while retaining high accuracy in cataract classification, achieving an accuracy rate of 99.13%.
Pratap and Kokil [24] introduced a method for classifying cataracts into four distinct grades by utilizing transfer learning with a pre-trained AlexNet and an SVM classifier. The approach involved the use of image quality selection parameters to evaluate the quality of fundus images sourced from open datasets. The method demonstrated a high level of accuracy, with a 92.9% success rate in categorizing cataracts into the four classes.
Hasan et al. [25] assessed the capability of four pre-trained CNN models: InceptionResNetV2, Xception, InceptionV3, and DenseNet121, in diagnosing cataracts from retinal images. The results showed that among these models, InceptionResNetV2 exhibited the highest level of accuracy in two-class classification, with a score of 98.17%.
Weni et al. [26] conducted research on a CNN-based approach for cataract detection, with a goal to enhance diagnostic accuracy while mitigating loss. The method achieved a classification accuracy of 95% after conducting 50 epochs.
Simanjuntak et al. [27] carried out an investigation to compare the effectiveness of four CNN architectures, specifically MobileNet, ResNet, GoogLeNet, and a custom CNN model, in classifying cataracts using fundus images. The results indicated that the proposed CNN model exhibited the highest level of accuracy and stability with a score of 92%, followed by MobileNet at 92%, ResNet at 93%, and GoogLeNet at 86%.
Imran et al. [28] presented a hybrid approach combining deep learning models (AlexNet, ResNet, VGGNet with transfer learning) and a SVM classifier for categorizing cataracts into four classes. The proposed architecture achieved an accuracy of 95.65% by utilizing robust feature extraction and classification techniques.
Yadav and Yadav [29] introduced a hybrid system that utilized transfer learning for feature extraction from fundus images. The method employed pre-trained CNN models (AlexNet, ResNet, and VGGNet) and an ES of SVM classifiers to grade cataracts into four categories. The system achieved an accuracy of 96.25% in four-class classification.
It is observed from the above discussion that the efficiency of deep learning approaches in automatic cataract diagnosis and classification has been established as a more efficient alternative to traditional image processing methods. Therefore, this study uses a compact CNN model with an ES of three classifiers namely SVM, NB, DT to classify cataract into four classes (mild, moderate, no, and severe). The advantage of using this architecture is that it can improve the performance of the classification task. The compact representation of CNN model reduces the computation cost by using small kernels, lesser trainable parameters and layers. In addition to this, an ES approach utilized multiple individual classifiers to produce predictions that are combined to attain improved accuracy. SVM, NB, and DT are different types of classifiers that have different strengths and weaknesses, and combining their predictions can help to mitigate these limitations. For example, SVM may be good at handling high dimensional data and non-linear boundaries, while NB may perform better on large datasets. The DT classifier may be better suited for complex relationships and interactions between features. By combining the predictions of these classifiers, the resulting ES approach leverages the strengths of individual classifiers, and produce a more robust result.
Figure 5. A framework of proposed methodology that uses CNN as feature extractor and an es of classifiers
Table 1. The comprehensive description of various datasets of fundus images
|
S. No. |
Dataset Name |
Dataset Size |
Image Size (Pixels) |
|
1 |
HRF (High-Resolution Fundus) [30] |
45 images |
3304×2336 |
|
2 |
STARE (Structured Analysis of the Retina) [31] |
397 images |
700×605 |
|
3 |
MESSIDOR [32] |
1200 images (three sets) |
Set 1: 1440×960 Set 2: 2240×1488 Set 3: 2304×1536 |
|
4 |
DRIVE (Digital Retinal Images for Vessel Extraction) [33] |
40 images (two sets) |
565×584 (both sets) |
|
5 |
DRIONS-DB [34] |
110 images |
600×400 |
|
6 |
IDRiD (Indian diabetic retinopathy image dataset) [35] |
516 images |
4288×2848 |
The following section outlines the systematic approach for identifying and assessing the severity of cataracts. The approach encompasses various crucial stages, such as dataset creation, preprocessing and dataset augmentation, feature extraction, and classification. The methodology is depicted in Figure 5 and is explained thoroughly in the subsequent subsections.
3.1 Dataset creation
In the first stage, a dataset of fundus cataract images is assembled from various databases and open-source datasets that are freely accessible on the internet due to the scarcity of benchmark datasets. This study utilized images that are randomly selected from the HRF [30], STARE [31], MESSIDOR [32], DRIVE [33], DRIONS_DB [34], and IDRiD [35] databases, as well as other images collected from the internet, as depicted in Table 1. A total of 1600 fundus images are compiled, with each class containing 400 images, as outlined in Table 2.
Table 2. A full description of acquired fundus images
|
S. No. |
Category |
Total Fundus Images |
|
1. |
Mild |
400 |
|
2. |
Moderate |
400 |
|
3. |
No |
400 |
|
4. |
Severe |
400 |
|
Total |
|
1600 |
3.2 Preprocessing and data augmentation
The preprocessing of fundus images is performed to enhance their generalization abilities. The preprocessing steps involved resizing, extraction of the G-channel, normalization, and data augmentation. The resizing is done using bicubic interpolation to make the images appropriate for further processing. The extraction of the green component from the RGB image through the G-channel extraction method is used to address the issue of uneven illumination. The G-channel is discovered to offer clearer insights into the illuminance and preserve crucial features of the original images (see Figure 6). Furthermore, working with the G-channel resulted in a decrease of one-third in computation time. Thirdly, normalization is used to standardize the intensity values of the images. It is accomplished by subtracting the mean of each pixel and dividing the result by the standard deviation. Finally, Data augmentation is a technique used to increase the size of the dataset by generating new samples from existing ones. This can help to prevent overfitting and improve generalization performance. Major data augmentation steps, including rotation (0°, 45°, 90°, 135°, 180°), flipping (horizontal), cropping (corner), and shifting (within a specified reference frame), are applied to the G-channel images. Figure 7 demonstrates the resultant pre-processed images after applying these basic operations.
Figure 6. (a) RGB image (b) R-channel (b) G-channel (d) B-channel
Figure 7. The resultant fundus images after the pre-processing steps (a) Resized image (b) G-channel of image (c) Normalized Image (d) images after augmentation
3.3 Feature extraction
Feature extraction is a crucial aspect of CAD systems and greatly influences the classification accuracy. The use of CNN models in medical image diagnosis has gained widespread recognition. CNNs are deep neural networks designed to automatically identify intricate features in medical images and diagnose medical conditions. A typical CNN comprises four main layers: convolution (CL), pooling (PL), fully connected (FC), and classification layers (CS). The layers are interconnected, with the output from one layer serving as input for the next. This output is known as a feature map. The CL layer is accountable for extracting both low-level and high-level features from fundus images using linear filters, including shapes like edges, curves, dots, corners, squares, circles, and others. The output from the 3×3 convolution filter is represented by Eq. (1).
$f(l, m, n)=\sum_{k=1}^3 \sum_{i=1}^3 \sum_{j=1}^3 w(l, i, j, k) I(i+m-1, j+n-1, k)+b(l)$ (1)
where, I(i,j,k) is the image intensity value, w(l,i,j,k) represents weights, and b(l) represents the bias of the convolutional layer.
The PL layer reduces the dimensions of the activation maps, which is the number of parameters in the network, through subsampling. This enhances the stability of the extracted features. The PL layer can be implemented using two methods: (1) Average pooling (AP), which determines the average pixel value in the masked region using a collection of linear filters and (2) Max-pooling (MP), which involves using a set of nonlinear filters to sort the pixel values in a specified region of the input image, and selecting the pixel with the highest absolute value as the result. The maximum-pooling layer for a 2×2 grid is described in Eq. (2).
$\begin{array}{c} x(l, m+1, n+1) \\ \max \left[\begin{array}{ll} f(l, 2 m+1,2 n+1) & f(l, 2 m+1,2 n+2) \\ f(l, 2 m+2,2 n+1) & f(l, 2 m+2,2 n+2)\end{array}\right]\end{array}$ (2)
where, x(l,m,n) represents the maximum pixel value among its 4-neighbors in the activation map (f).
The batch normalization (BN) layer plays a crucial role in normalizing the output from the previous layer of the network during the training process. This helps to improve the learning speed and prevent overfitting, allowing for more efficient network learning. Additionally, the BN layer enables other layers in the network to learn independently.
The FC layer is composed of neurons that are connected to all the neurons in the previous layer, which represents the activation maps. The main function of the FC layer is to produce a condensed representation of the entire input image. Usually, the outputs from previous FC layers and CL layers are processed through a ReLU activation function, which is defined in Eq. (3).
$y=\left\{\begin{array}{l}x, x \geq 0 \\ 0, x<0\end{array}\right.$ (3)
where, x represents the input to the ReLU function and y represents the resulting output produced by the ReLU function. However, the utilization of the softmax activation function is carried out at the end of the CNN to calculate the probability distribution of each output from the final fully connected layer, as expressed in Eq. (4).
$v_i=\frac{e^{u_i}}{\sum_{n=1}^N e^{u_n}}$ (4)
where, ui is the ith output from the last fully connected layer, vi is the corresponding softmax activation, and N represents the total number of classes.
The cross-entropy loss function is used to measure the difference between the predicted outputs of the softmax activation and the actual outputs. This is represented by Eq. (5).
$e=-\sum_{j=1}^N \widehat{v}_J \log v_j$ (5)
where, $v_j$ represents the actual probability of the jth output of the last fully connected layer belonging to a specific class. The cross-entropy loss is minimized through backpropagation, using optimization techniques such as Stochastic Gradient Descent (SGD) and Active Design and Analysis Modeling (ADAM), to adjust the parameters of the model and improve image classification performance.
Figure 8. Block diagram of proposed CNN network
In this study, a CNN architecture is proposed for automatic detection and grading of cataracts into four stages (normal, mild, moderate, and severe) from fundus images. The architecture consists of six consecutive CL layers with 2×2 ML layers in between them as shown in Figure 8. The convolutional layers use 32, 64, 64, 128,128 and 256 filters with 3×3 kernel size and 'same' padding. The max pooling layers reduce the size of the data representation and lower the number of trainable parameters. The outputs of the CL layers are combined into a feature map, which is used to feed several fully connected layers. These layers classify cataracts using three sets of FL layers and dropout (DO) layers. The FL layers contain 64, 128, and 256 neurons, while the dropout layers are set to 0.4, 0.4, and 0.5 to reduce the risk of overfitting. The last FL layer has four neurons for nonlinear classification. The activation function used in all layers is ReLU, except in the CS layer, where the softmax function is used. The architecture of the proposed CNN model is detailed in Table 3.
This study uses this CNN model for feature extraction by removing the last three layers of the CNN model, including the last FC layer, the DO layer, and the CS layer. Now, this model is utilized for feature extraction and an ES of SVM, NB and RF classifiers is adopting for classification of the cataract.
Table 3. Detailed description of various layers of proposed CNN network
|
Layers |
Filters |
Configuration |
Stride |
Output |
|
CL2D |
32 |
KS: 3×3, ReLU |
- |
256×256×32 |
|
MP2D |
- |
KS: 2×2 |
2 |
128×128×32 |
|
CL2D |
64 |
KS: 3×3, ReLU |
- |
128×128×64 |
|
MP2D |
- |
KS: 2×2 |
2 |
64×64×64 |
|
CL2D |
64 |
KS: 3×3, ReLU |
- |
64×64×64 |
|
MP2D |
- |
KS: 2×2 |
2 |
32×32×64 |
|
CL2D |
128 |
KS: 3×3, ReLU |
- |
32×32×128 |
|
MP2D |
- |
KS: 2×2 |
2 |
16×16×128 |
|
CL2D |
128 |
KS: 3×3, ReLU |
- |
16×16×128 |
|
MP2D |
- |
KS: 2×2 |
2 |
8×8×128 |
|
CL2D |
256 |
KS: 3×3, ReLU |
- |
8×8×256 |
|
MP2D |
- |
KS: 2×2 |
2 |
4×4×256 |
|
FC |
- |
64; ReLU |
- |
64 |
|
DO |
- |
0.4 |
|
64 |
|
FC |
- |
128; ReLU |
- |
128 |
|
DO |
- |
0.4 |
- |
128 |
|
FC |
- |
256; ReLU |
- |
256 |
|
DO |
- |
0.4 |
- |
256 |
|
FC |
- |
4 |
- |
4 |
|
Softmax |
- |
Softmax |
- |
4 |
|
Class Layer |
- |
Output |
- |
- |
3.4 Classification
This study utilizes three distinct classifiers, including SVM, NB, and DT, to evaluate the degree of cataracts present in fundus images. To provide further insight, let's delve into each classifier in more detail.
SVM is a supervised learning algorithm that is used for binary classification. It aims to find a hyperplane with the maximum margin between the positive and negative classes, which helps to avoid misclassifications [36]. ECOC SVM is a variation of SVM used for multi-class classification problems. In ECOC, multiple binary classifiers are trained, each designed to separate two classes, and the outputs of these classifiers are combined in a codeword matrix. The final classification decision is made based on the maximum votes received by a class in the matrix, making ECOC a powerful method for multi-class classification that can handle non-separable data and is less prone to overfitting [37].
The Naive Bayes method is a statistical approach utilized for both binary and multi-class categorization [38]. This algorithm relies on Bayes' Theorem, which posits that the probability of a class being present given certain features is proportional to the prior probability of the class and the likelihood of the features appearing with the class. The term "Naive" is added as the algorithm assumes that the features are conditionally independent given the class. One variation of the Naive Bayes algorithm is the Gaussian Naive Bayes, which is specifically created for continuous data. It models the likelihood of the features given the class using a Gaussian distribution, with the mean and variance calculated from the training data [39]. This simple approach is commonly used in image classification.
The Decision Tree algorithm was first proposed by Quinlan in 1986 and is a tree-based classification technique [40]. It begins by evaluating all the features at the root, and similar features are grouped together and represented as nodes. This method is recursive, meaning that these nodes are further divided into sub-nodes representing similar features, until division is no longer possible. The classes are represented as the leaves of the tree. The Decision Tree algorithm is simple to comprehend and interpret, efficient to run, and has proven to be effective for image classification [41]. However, it has the potential for overfitting, where overly complex trees are created that do not generalize the data well.
Figure 9. The detailed diagram of proposed methodology of cataract detection and grading
It has been observed that various classifiers can produce differing outcomes when applied to the same set of features, and may not perform optimally in all situations. This is because each classifier possesses its own advantages and disadvantages and may be more suitable for specific types of data and applications. Therefore, the concept of ES learning involves combining several individual classifiers to produce a new, more accurate classifier. The goal is to harness the strengths of each classifier while mitigating its weaknesses, ultimately leading to improved performance and a higher degree of accuracy.
In this study, a combination of three classifiers, SVM, NB, and DT, is utilized to make predictions. These classifiers are trained using features obtained from a custom CNN. The ES classifier employed a MVS during testing where each classifier made a prediction for every test image. The final prediction is based on the majority of classifier votes. If all classifiers have different predictions, the result of the SVM classifier is utilized as the final outcome.
The steps involved in the methodology are illustrated in Figure 9 and can be concisely described as follows:
•First, the CNN model is trained and validated using the pre-processed and augmented fundus images dataset.
•After proper training, the last three layers of the CNN model are removed to generate feature vectors.
•The feature vectors corresponding to the training dataset are then used to train the classifiers.
•Once trained, these classifiers are ready to predict the classes of the test dataset.
•The MVS is applied to determine the class label of each test feature vector by considering the predictions of the SVM, NB, and DT classifiers.
In this section, the results and discussions of the proposed method's implementation on fundus image dataset are presented. The experiments are conducted on a personal computer with top-notch specifications including an Intel 7th Generation Core i7-7700 processor, 64-bit Windows 10 operating system, 32GB of RAM and 4GB NVIDIA GTX 1050 Ti graphics card. The proposed method's simulations are carried out utilizing the MATLAB R2019a software, a comprehensive platform that incorporates image processing, deep learning, and machine learning toolboxes.
4.1 Evaluation metrics
In this study, a collected fundus images dataset is used to train and test a method. The performance of the method is then evaluated using several performance metrics: accuracy, precision, sensitivity (or recall), specificity, and F1-score.
$\begin{gathered}{ Accuracy }(A C C)=\frac{T . P .+T . N .}{T . N .+T \cdot P \cdot+F \cdot N .+F . P .} \\ { Sensitivity }(S E N)=\frac{T . P .}{T . P .+F . N .} \\ { Specificity }(S P E)=\frac{T . N .}{T . N .+F . P .} \\ { Precision }(P R E)=\frac{T . P .}{T . P .+F . P .} \\ F 1 {score}(F 1)=2 * \frac{ { Precision } * { Sensitivity }}{ { Precision }+ { Sensitivity }}\end{gathered}$
Accuracy is a metric that quantifies the number of accurate predictions made by a model. Precision assesses the ratio of true positive predictions to all positive predictions made by the model, while sensitivity (recall) evaluates the proportion of actual positive instances that were correctly identified by the model. In the medical field, precision and recall are deemed as the two crucial evaluation metrics. The F1-Score combines precision and recall through the harmonic mean and represents the balance between precision and recall. A F1-Score that is high signifies a good balance between precision and recall. In the field of medical diagnosis, avoiding false negatives (incorrectly reporting that a patient does not have a condition when they actually do) is of utmost importance, thus recall is prioritized over precision (correctly identifying patients who have the condition). False negatives could result in serious consequences for the patient, whereas false positives (incorrectly reporting that a patient has a condition when they do not) can be resolved through additional testing. Therefore, this study takes into account a comprehensive set of performance evaluation metrics, including accuracy, precision, recall, specificity, F1-score, and AUC, in order to assess the effectiveness of the diagnostic process.
4.2 Performance evaluation
In this study, the efficiency of the proposed methodology is evaluated by comparing its feature extraction and classification capabilities. It is observed that, as there are no benchmark datasets available for comparison, all the algorithms are trained and evaluated using a self-collected dataset.
In this study, the performance of the proposed method is evaluated based on feature extraction using pre-trained CNN architectures such as AlexNet-Softmax, VGGNet-Softmax, ResNet-softmax, AlexNet-SVM, VGGNet-SVM, and ResNet-SVM. The results, displayed in Table 4, indicate that the proposed method outperformed the other models evaluated. The proposed method demonstrated exceptional results, with a high accuracy score of 97.34%, sensitivity of 95.63%, specificity of 97.92%, precision of 93.87%, and F1-score of 94.74%. These results show that the proposed method exhibits remarkable performance compared to other algorithms.
Table 4. Performance comparison between the proposed methodology and pre-existing CNN models
|
Methods |
ACC |
PRE |
SEN |
SPE |
F1 |
|
AlexNet - softmax |
91.32 |
92.05 |
91.22 |
91.44 |
91.63 |
|
ResNet - softmax |
92.05 |
92.02 |
91.31 |
91.75 |
91.65 |
|
VGGNet - softmax |
91.76 |
91.63 |
91.14 |
92.35 |
91.38 |
|
AlexNet - SVM |
93.57 |
93.78 |
92.48 |
95.63 |
93.28 |
|
ResNet - SVM |
94.41 |
94.38 |
93.56 |
95.84 |
94.14 |
|
VGGNet - SVM |
95.00 |
94.87 |
94.34 |
95.91 |
94.62 |
|
Proposed Method |
97.34 |
93.87 |
95.63 |
97.92 |
94.74 |
This study also evaluated the performance of the proposed method in terms of classification by using a custom CNN architecture and different classifiers, including SVM, NB, and DT. The results, as displayed in Table 5, demonstrate that the proposed method surpasses the performance of the other classifiers.
The reason for the improved performance is due to the utilization of various classifiers, each having its unique strengths and weaknesses, resulting in a more comprehensive and diverse representation of the underlying data. Therefore, an ES of classifiers averaged out the errors made by individual classifier. Thus, proposed method used an ES of three classifiers (SVM, NB, DT) that combined the predictions of all classifiers using MVS to make a more accurate prediction to grade the cataracts.
Table 5. Performance comparison of the proposed methodology using various classifiers
|
Methods |
ACC |
PRE |
SEN |
SPE |
F1 |
|
CNN - SVM |
94.84 |
92.62 |
86.25 |
97.71 |
89.32 |
|
CNN - NB |
95.94 |
89.88 |
94.37 |
96.46 |
92.07 |
|
CNN - RF |
95.78 |
90.30 |
93.13 |
96.67 |
91.69 |
|
Proposed Method |
97.34 |
93.87 |
95.63 |
97.92 |
94.74 |
4.3 Computation time
The computation time for each stage of the proposed methodology is documented in Table 6. The findings reveal that the feature extraction process requires a duration of 0.35 seconds, while the classification of a single retinal test image takes 0.60 seconds, resulting in a total computation time of 0.95 seconds. The comparison chart depicted in Figure 10 illustrates the superiority of the proposed method in terms of speed, as compared to previous approaches. This is achieved through the implementation of compact kernels, a reduced number of training parameters, and fewer layers, in CNN which facilitate the rapid extraction of features from retinal images.
Table 6. The computation time for each step in the proposed methodology
|
Procedure |
Total Computation Time (Seconds) |
|
Training time |
180 |
|
Validation time |
22 |
|
Feature extraction time (Single testing Image) |
0.35 |
|
Classification time (Single testing Image) |
0.60 |
4.4 Result analysis and discussion
This method initially uses preprocessing and augmentation techniques to elevate the image quality and enlarge the size of the dataset, subsequently selecting 800 high-quality images per class in consultation with an expert ophthalmologist. The augmented dataset is subsequently divided into 80:20 for training and testing data, respectively. During the training phase, the CNN model is trained on the training data in batches of 32 and the network weights are optimized within the range of [-1, 1]. The learning rate is set at 3×10⁻⁴ and dropout values are established as 0.4, 0.4, 0.5 to deter overfitting. The other hyper-parameters are established as indicated in Table 7. For cataract classification, an ES of NB and DT, including linear kernel SVM classifier for CNN model. The linear kernel function is selected as it performed well with a large number of features and reduced computational cost. During the testing phase, the final outcome is established through the MVS approach based on the predictions of all classifiers. The results indicate that the proposed method exhibits superiority over all pretrained CNN models with softmax classifier by a margin of approximately 5 to 6%, and all pretrained CNN models with SVM classifier by a margin of approximately 2 to 3%, as well as custom CNN models with individual classifiers in the ES by a margin of 1 to 3% in terms of accuracy. The computation time encompasses both feature extraction and image classification time. Figure 10 presents a comparison of the computation time for various methods. It can also be observed from Table 6 and Figure 10 that the time required to classify a test sample using a AlexNet-softmax classifier, VGG19-softmax classifier, ResNet50- softmax classifier, AlexNet-SVM classifier, VGG19- SVM classifier, ResNet50- SVM classifier, and the proposed method is 1.15 seconds, 1.25 seconds, 1.35 seconds, 1.20 seconds, 1.30 seconds, 1.40 seconds and 0.95 seconds respectively. This indicates that the classification of fundus images with the proposed method is faster than the other methods. The reason of less computation time of the proposed method compare to other pre-trained networks is the use of the custom CNN network that has lesser layers, small size kernels and fewer trainable parameters.
Figure 10. Comparative chart of computation time (s) of proposed method with other methods (one image)
Table 7. Fine-tuned hyperparameters details
|
Configuration |
Value |
|
Learning Rate |
0.0003 |
|
Epochs |
40 |
|
Batch Size |
32 |
|
Optimizer |
ADAM |
|
Network Weights |
[-1 1] |
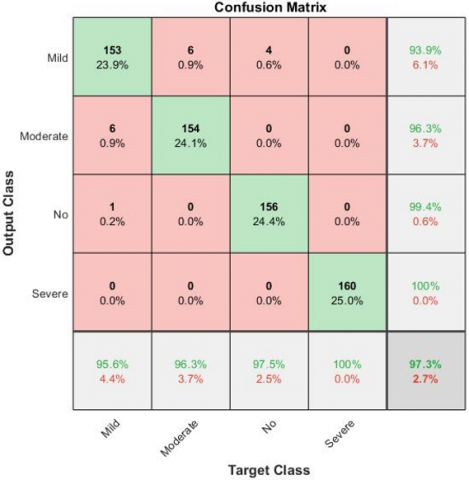
To evaluate the efficacy of the proposed method, its performance is compared with state-of-the-art techniques. Table 8 provides a comparison of different cataract classification methods using common performance metrics. Imran et al. [42] created an automated system for identifying various levels of cataracts by utilizing a D-CNN in conjunction with data augmentation methods. The standard data augmentation and Gaussian scale space theory methods are utilized to improve the quantity and quality of the data. This approach achieved an accuracy of 93.79%. Another method by Cao et al. [10] used an enhanced Haar wavelet transform to extract features and achieved an accuracy of 85.98% in four-class cataract grading. Pratap and Kokil [24] invented a method that performs image quality assessment, then select only good-quality images for further processing. A pre-trained AlexNet and an SVM classifier are utilized for feature extraction and classification, achieving an accuracy of 92.87%. Imran et al. [28] used a hybrid model that combines three pre-trained CNNs (Alexnet, VGGNet, ResNet) and one SVM classifier, resulting in 95.63% accuracy. Yadav and Yadav [29] presented hybrid approach, leveraging various pre-trained CNNs (AlexNet, VGGNet, ResNet) with transfer learning for feature extraction. The feature vectors generated by each network individually, as well as in a fused form, are applied to ES of SVM classifiers for 4-stage cataract classification. The accuracy obtained by this method was 96. 25%. The data presented in Table 8 demonstrates the superiority of the proposed methodology in comparison to other state of art methods. The evaluation of the proposed methodology can be visualized through the confusion matrix depicted in Figure 11(a) and ROC displayed in Figure 11(b).
Table 8. Performance comparisons of the proposed method with existing methods
|
Authors |
Year |
Algorithms |
ACC |
SEN |
SPE |
PRE |
|
Imran et al. [42] |
2019 |
D-CNN-Softmax |
93.79% |
95.40% |
93.70% |
93.56% |
|
Cao et al. [10] |
2020 |
Improved Haar wavelet |
85.98% |
84.65% |
95.29% |
86.01% |
|
Pratap and Kokil [24] |
2021 |
Alexnet-SVM |
92.87% |
92.88% |
93.04% |
93.04% |
|
Imran et al. [28] |
2020 |
Alexnet-VGGNet-ResNet-SVM |
95.63% |
95.62% |
95.98% |
95.65% |
|
Yadav and Yadav [29] |
2022 |
Alexnet-VGGNet-ResNet-ES of SVMs |
96.25% |
96.25% |
96.24% |
98.74% |
|
Proposed Methodology |
2023 |
CNN with ensamble of SVM, NB, RF |
97.34% |
93.87% |
95.63% |
97.92% |
(a) Confusion matrix
(b) ROC curve
Figure 11. Performance visualization of proposed methodology
The present study introduces a new methodology for cataract classification, utilizing a custom CNN model and a combination of SVM, NB, and DT classifiers. The proposed custom CNN model is designed with smaller parameters, reduced layers, and small-sized kernels, making it computationally efficient. The automated feature extraction performed by the CNN model is then utilized to train the ES of SVM, NB, and DT classifiers, which in turn make predictions via MVS. The outcomes of this study exhibit that the method proposed exhibits superiority over existing methods with regards to accuracy, and has faster computation time. This method has the potential to be applied in rural areas, as it is non-invasive and does not necessitate the presence of an ophthalmologist. The authors intend to augment the accuracy of the proposed method by subjecting it to testing on a dataset that is more extensive and diverse in the future.
This research is supported under VRP Scheme of Dr. A.P.J. AKTU (Grant No.: AKTU/Dean-PGSR/VRPS-2020/5751). The research is carried out at AKGEC, Ghaziabad, India.
[1] Pascolini, D., Mariotti, S.P. (2012). Global estimates of visual impairment: 2010. British Journal of Ophthalmology, 96(5): 614-618. https://doi.org/10.1136/bjophthalmol-2012-301861
[2] Bourne, R.R., Flaxman, S.R., Braithwaite, T., et al. (2017). Magnitude, temporal trends, and projections of the global prevalence of blindness and distance and near vision impairment: A systematic review and meta-analysis. Lancet Global Health, 5(9): e888-e897. https://doi.org/10.1016/S2214-109X(17)30293-0
[3] Pizzarello, L., Abiose, A., Ffytche, T., Duerksen, R., Thulasiraj, R., Taylor, H., Faal, H., Rao, G., Kocur, I., Resnikoff, S. (2004). Vision 2020: the right to sight: A global initiative to eliminate avoidable blindness. Archives of Ophthalmology, 122(4): 615-620. https://doi.org/10.1001/archopht.122.4.615
[4] World Health Organization. (2013). Universal eye health: A global action plan 2014-2019. http://www.who.int/blindness.
[5] Deshpande, M. (2008). Vision 2020: Right to Sight-India. Medical Journal of Armed Forces India, 64(4): 302-303. https://doi.org/10.1016/S0377-1237(08)80002-0
[6] WHO (2012). Global data on visual impairments 2010. https://www.who.int/blindness.
[7] Parikh, C.H., Fowler, S., Davis, R. (2005). Cataract screening using telemedicine and digital fundus photography. Investigative Ophthalmology & Visual Science, 46(13): 1944.
[8] Raju, B., Raju, N. S. D., Akkara, J.D., Pathengay, A. (2016). Do it yourself smartphone fundus camera – DIYretCAM. Indian Journal of Ophthalmology, 64(9): 663-667.
http://doi.org/10.4103/0301-4738.194325
[9] Guo, L., Yang, J.J., Peng, L., Li, J., Liang, Q. (2015). A computer-aided healthcare system for cataract classification and grading based on fundus image analysis. Computers in Industry, 69: 72-80. https://doi.org/10.1016/j.compind.2014.09.005
[10] Cao, L., Li, H., Zhang, Y., Zhang, L., Xu, L. (2020). Hierarchical method for cataract grading based on retinal images using improved Haar wavelet. Information Fusion, 53: 196-208. https://doi.org/10.1016/j.inffus.2019.06.022
[11] Yang, M., Yang, J.J., Zhang, Q., Niu, Y., Li, J. (2013). Classification of retinal image for automatic cataract detection. In 2013 IEEE 15th International Conference on e-Health Networking, Applications and Services (Healthcom 2013), Lisbon, pp. 674-679. https://doi.org/10.1109/HealthCom.2013.6720761
[12] Yang, J.J., Li, J., Shen, R., Zeng, Y., He, J., Bi, J., Li, Y., Zhang, Q., Peng, L., Wang, Q. (2016). Exploiting ES learning for automatic cataract detection and grading. Computer Methods Programs Biomedical. 124: 45-57. https://doi.org/10.1016/j.cmpb.2015.10.007
[13] Zheng, J., Guo, L., Peng, L., Li, J., Yang, J., Liang, Q. (2014). Fundus Image based cataract classification. In IEEE International Conference on Imaging Systems and Techniques, Santorini, Greece, pp. 90-94. https://doi.org/10.1109/IST.2014.6958452
[14] Fan, W., Shen, R., Zhang, Q., Yang, J.J., Li, J. (2015). Principal component analysis based cataract grading and classification. In 17th International Conference on E-health Networking, Application & Services (HealthCom), Boston, MA, pp. 459-462. https://doi.org/10.1109/HealthCom.2015.7454545
[15] Song, W., Cao, Y., Qiao, Z., Wang, Q., Yang, J.J. (2019). An improved semi supervised learning method on cataract fundus image classification. In IEEE 42rd Annual Computer Software and Applications Conference (COMPSAC), Milwaukee, WI, USA, pp. 362-367. https://doi.org/10.1109/COMPSAC.2019.10233
[16] Pratap, T., Kokil, P. (2019). Automatic cataract detection in fundus retinal images using singular value decomposition. In 2019 International Conference on Wireless Communications Signal Processing and Networking (WiSPNET), Chennai, India, 373-377. https://doi.org/10.1109/WiSPNET 45539.2019.9032867
[17] Nur, N., Cokrowibowo, S., Konde, R. (2021). Cataract detection in retinal fundus image using gray level co-occurrence matrix and k-nearest neighbor. In International Joint Conference on Science and Engineering 2021 (IJCSE 2021), Indonesia, pp. 268-271. https://doi.org/10.2991/aer.k.211215.049
[18] Zhang, L., Li, J., Han, H., Liu, B., Yang, J., Wang, Q. (2017, May). Automatic cataract detection and grading using deep convolutional neural network. In 2017 IEEE 14th International Conference on Networking, Sensing and Control (ICNSC), Calabria, pp. 60-65. https://doi.org/10.1109/ICNSC.2017.8000068
[19] Ran, J., Niu, K., He, Z., Zhang, H., Song, H. (2018). Cataract detection and grading based on combination of deep convolutional neural network and random forests. In 2018 International Conference on Network Infrastructure and Digital Content (IC-NIDC), Guiyang, China, pp. 155-159. https://doi.org/10.1109/ICNIDC.2018.8525852
[20] Li, J., Xu, X., Guan, Y., et al. (2018). Automatic cataract diagnosis by image-based interpretability. In 2018 IEEE International Conference on Systems, Man, and Cybernetics (SMC), Miyazaki, Japan, pp. 3964-3969. https://doi.org/10.1109/SMC.2018.00672
[21] Imran, A., Li, J., Pei, Y., Akhtar, F., Yang, J.J., Wang, Q. (2019, December). Cataract detection and grading with retinal images using SOM-RBF neural network. In 2019 IEEE Symposium Series on Computational Intelligence (SSCI), Xiamen, China, pp. 2626-2632. https://doi.org/10.1109/SSCI44817.2019.9002864
[22] Syarifah, M.A., Bustamam, A., Tampubolon, P.P. (2020). Cataract classification based on fundus image using an optimized convolution neural network with lookahead optimizer. AIP Conference Proceedings, 2296: 020034. https://doi.org/10.1063/5.0030744
[23] Junayed, M.S., Islam, M.B., Sadeghzadeh, A., Rahman, S. (2021). CataractNet: An automated cataract detection system using deep learning for fundus images. IEEE Access, 9: 128799-128808. https://doi.org/10.1109/ACCESS.2021.3112938
[24] Pratap, T., Kokil, P. (2019). Computer-aided diagnosis of cataract using deep transfer learning. Biomedical Signal Processing and Control, 53: 101533. https://doi.org/10.1016/j.bspc.2019.04.010
[25] Hasan, M.K., Tanha, T., Amin, M.R., Faruk, O., Khan, M.M., Masud, S.A.M. (2021). Cataract disease detection by using transfer learning-based intelligent methods. Computational and Mathematical Methods in Medicine. 2021: 7666365. https://doi.org/10.1155/2021/7666365
[26] Weni, I., Utomo, P.E.P., Hutabarat, B.F., Alfalah, M. (2021). Detection of cataract based on image features using convolutional neural networks. Indonesian Journal of Computing and Cybernetics Systems), 15(1): 75-86.
[27] Simanjuntak, R.B.J., Fu'adah, Y., Magdalena, R., Saidah, S., Wiratama, A.B., Ubaidah, I.D.S. (2022). Cataract classification based on fundus images using convolutional neural network. JOIV: International Journal of Information Visualization, 6(1): 33-38. http://dx.doi.org/10.30630/joiv.6.1.856
[28] Imran, A., Li, J., Pei, Y., Akhtar, F., Yang, J.J. Dang, Y. (2020). Automated identification of cataract severity using retinal fundus images. Computer Methods in Biomechanics and Biomedical Engineering: Imaging & Visualization, 8(6): 691-698. https://doi.org/10.1080/21681163.2020.1806733
[29] Yadav, J.K.P.S., Yadav, S. (2022). Computer-aided diagnosis of cataract severity using retinal fundus images and deep learning. Computational Intelligence, 38(4): 1450-1473. https://doi.org/10.1111/coin.12518
[30] [dataset] Budai, A., Bock, R., Maier, A., Hornegger, J., Michelson, G. (2013). Robust vessel segmentation in fundus images. International Journal of Biomedical Imaging. 2013: 154860. https://doi.org/10.1155/2013/154860
[31] Hoover, A.D., Kouznetsova, V., Goldbaum, M. (2000). Locating blood vessels in retinal images by piecewise threshold probing of a matched filter response. IEEE Transactions on Medical Imaging, 19(3): 203-210. https://doi.org/10.1109/42.845178
[32] Decencière, E., Zhang, X., Cazuguel, G., et al. (2014). Feedback on a publicly distributed image database: the messidor database. Image Analysis and Stereology, 33(3): 231-234. http://dx.doi.org/10.5566/ias.1155.
[33] Staal, J., Abramoff, M.D., Niemeijer, M., Viergever, M.A., van Ginneken, B. (2004). Ridge-based vessel segmentation in color images of the retina. IEEE Transactions on Medical Imaging, 23(4): 501-509. https://doi.org/10.1109/TMI.2004.825627
[34] Carmona, E.J., Rincón, M., García-Feijoó, J., Martínez-de-la-Casa, J.M. (2008). Identification of the optic nerve head with genetic algorithms. Artificial Intelligence in Medicine. 43(3): 243-259. https://doi.org/10.1016/j.artmed.2008.04.005
[35] Porwal, P., Pachade, S., Kamble, R., Kokare, M., Deshmukh, G., Sahasrabuddhe, V., Meriaudeau, F. (2018). Indian diabetic retinopathy image dataset (IDRiD): A database for diabetic retinopathy screening research. Data, 3(3): 25. https://doi.org/10.3390/data3030025
[36] Flach, P. (2012). Machine learning. Cambridge University Press.
[37] Hameed, N., Shabut, A.M., Hossain, M.A. (2018). Multi-class skin diseases classification using deep convolutional neural network and support vector machine. In 2018 12th International Conference on Software, Knowledge, Information Management & Applications (SKIMA), Phnom Penh, Cambodia, pp. 1-7. https://doi.org/10.1109/SKIMA.2018.8631525
[38] Bansal, M., Kumar, M., Sachdeva, M., Mittal, A. (2021). Transfer learning for image classification using VGG19: Caltech-101 image data set. Journal of Ambient Intelligence and Humanized Computing, 14: 3609-3620. https://doi.org/10.1007/s12652-021-03488-z
[39] Anand, M.V., KiranBala, B., Srividhya, S.R., Kavitha, C., Younus, M., Rahman, M.H. (2022). Gaussian naive bayes algorithm: A reliable technique involved in the assortment of the segregation in cancer. Journal of Cancer Science and Therapy, 2022: 2436946. https://doi.org/10.1155/2022/2436946
[40] Yoo, S.H., Geng, H., Chiu, T.L., et al. (2020). Deep learning-based decision-tree classifier for COVID-19 Diagnosis from Chest X-ray Imaging. Frontiers in Medicine, 7: 427. https://doi.org/10.3389/fmed.2020.00427
[41] Narasimha, V., Satyanarayana, B., Krishnaiah, K. (2019). Classification of Knowledge Based Image using Decision Tree Algorithm. International Journal of Recent Technology and Engineering, 8(1C2): 1227-1231.
[42] Imran, A., Li, J., Pei, Y., Mokbal, F.M., Yang, J.J., Wang, Q. (2020). Enhanced intelligence using collective data augmentation for CNN based cataract detection. In Frontier Computing: Theory, Technologies and Applications (FC 2019), Kyushu, Japan, pp. 148-160. https://doi.org/10.1007/978-981-15-3250-4_18