Xili Cai![]() | Xiyuan Wang
| Xiyuan Wang![]() | Yingying Zhang
| Yingying Zhang![]() | Dewen Seng
| Dewen Seng![]() | Xuefeng Zhang*
| Xuefeng Zhang*![]()
© 2023 IIETA. This article is published by IIETA and is licensed under the CC BY 4.0 license (http://creativecommons.org/licenses/by/4.0/).
OPEN ACCESS
In the realm of social recommendation, the utilization of Graph Convolution Networks (GCNs) has proven effective for embedding propagation, allowing user-item implicit social relations to be modeled efficiently. However, the shortcomings of these existing models lie in their focus on local neighbors and their lack of simulation of recursive diffusion in a broader social network, thus limiting their performance potential. To address this gap, a novel GCN framework, herein referred to as the Trust and Influence Graph Convolution Network (TIGCN), is proposed. This framework aims to improve the robustness of social recommendation systems by utilizing implicit social relations and user-item interactions. Through the construction of user-user trust and influence graphs derived from a bipartite social network, influential users are identified using the Structural Holes method. The TIGCN framework then employs these inter-user relationships, including trust and influence features, to collectively navigate the propagation of user interests and social relations. The effectiveness of the TIGCN is demonstrated through experiments conducted on real-world datasets such as Ciao, Epinions, and FilmTrust. Results show that the TIGCN offers significant performance improvements over other state-of-the-art baselines like FST, FSTID, and SocialLGN. The metrics indicating these improvements include increased Precision@5 (up to 2.08%), Recall@5 (up to 2.7%), NDCG@5 (up to 2.28%), Precision@10 (up to 2.65%), Recall@10 (up to 2.87%), and NDCG@10 (up to 2.82%). In conclusion, the introduction of the TIGCN has opened up promising avenues for the enhancement of social recommendation through the incorporation of implicit social relations and the innovative use of GCNs. Future studies should focus on improving the scalability and effectiveness of the TIGCN framework to maximize its contribution to social recommendation systems.
user-user trust graph, user-user influence graph, embedding propagation, graph neural networks
The growing interest in utilizing social relations for recommender systems has been observed in recent years [1]. Social relations introduce a novel dimension to recommendations, as users often seek advice from trustworthy friends during e-commerce transactions [2]. Traditional recommender systems typically derive low-dimensional latent representations solely from user-item interaction data. However, when user-item interaction data is insufficient, the system's representation ability is significantly compromised, resulting in the data sparsity problem [3]. The user-item bipartite graph, derived from the interaction matrix, is too sparse for Graph Neural Networks (GNN) to effectively model user/item representations. The performance of these traditional recommender systems is hindered by the sparsity of bipartite graphs and the unavailability of social graphs in most real-world scenarios [4].
For instance, consider a social relation graph of 4 users and 4 items connected by 7 edges, as depicted in Figure 1. Each edge corresponds to explicit feedback (i.e., user-item ratings) ranging from 1 to 5 stars, which represent the user's preference for the connected item. Users u1 and u2 have the same rating for item i2, indicating a similarity in preference, and thus, making u1 a second-order neighbor (i.e., friend) of u2 in methods based on the bipartite graph. According to their browsing history, u2 is more likely to be interested in item i1, while u4 is more likely to be interested in item i2. Therefore, modeling the fine-grained reasoning of interactions contributes to the provision of personalized recommendation services for users u2 and u4. This conclusion contradicts the fact that u1 and u2 have different preferences and should not be considered friends. Consequently, many GCN-based recommendation methods employ social graphs to alleviate the data sparsity problem and enhance performance.
In social recommendations, user preferences can be easily influenced by their friends [5], and recommendation accuracy can be effectively improved by mining social relationships [6]. GCNs have demonstrated their effectiveness in social recommendation due to their capability to efficiently represent social network relationships. Neural networks are employed to aggregate feature representations from the social network graph [7]. To address the data sparsity problem, various studies have been conducted, focusing on enhancing the recommendation process using additional data such as trust relationships between users. Related work leverages social links between users to complement sparse rating data and considers both users' ratings and the preferences of trusted neighbors to improve user preference prediction [8].
Figure 1. An illustration of recommendation for users based only on the ratings
For example, Fan et al. [1] first learned the user latent factor and item latent factor using GNN, then concatenated the two latent factors for the final rating prediction. In user modeling, the latent representation of the user is the concatenation of item aggregation and social aggregation.
Song et al. [9] considered a dynamic scenario in which social relationships dynamically influence users' interests and proposed a session-based social recommendation algorithm that models dynamic interests and dynamic social influences.
Huo et al. [10] introduced a new GNN-based trust evaluation method called TrustGNN, smartly integrating the propagative and composable nature of trust graphs into a GNN framework for better trust evaluation.
Liao et al. [3] proposed a SocialLGN system, which extended LightGCN to make it more suitable for social recommendation problems. A light graph convolution network-based representation propagation mechanism was designed for the user-item interaction graph and social graph simultaneously.
Guo et al. [11] suggested a novel trust-aware recommendation method based on heterogeneous multi-relational graph fusion, termed T-MRGF, which established the user–user trust relation graph, user–item interaction graph, and item–item knowledge graph. The user feature and item feature, obtained from the user–item graph, were used as inputs for the user-related graph and the item-related graph, respectively. Fusion was achieved through cascading feature vectors before and after feature propagation.
Canturk et al. [12] developed a method for predicting trust scores of Location-Based Social Networks (LBSN) users and proposed a trust-aware recommendation technique, TLoRW, to recommend locations to users based on their previous check-ins, social network, and predicted trust scores of users. In the proposed model, global trust scores of users were generated based on check-in history. In addition to trust, spatial context was another important aspect of TLoRW to generate location recommendations based on the user's current location.
Yang et al. [13] aimed to empower the GNN model with the ability to tackle the social inconsistency problem and proposed sampling consistent neighbors by relating sampling probability with consistency scores between neighbors. Moreover, the relation attention mechanism was employed to assign consistent relations with high importance factors for aggregation. These GCN-based methods obtain meaningful representations of nodes/edges in a network by integrating neighborhood information of nodes/edges. On the other hand, an online social network based on social trust can be thought of as a trust graph where nodes represent social users and edges trust relations between them. The edge in the graph can represent the trust relationship between two nodes. Therefore, leveraging the powerful representation learning capabilities of GCN for trust evaluation tasks is significant [10].
Despite the effectiveness of GCN-based social recommender models in achieving state-of-the-art recommendation performance, two key challenges remain unaddressed in existing methods.
Firstly, although trust relationships between users have been shown to enhance the effectiveness of recommendation methods, the trust relationships matrix is often sparse [14]. The majority of user feedback is explicit (e.g., ratings, likes/dislikes) rather than implicit (e.g., social trust, influence). Additionally, the neighborhood aggregation scheme in GCNs amplifies the impact of interactions on representation learning, making the learning more susceptible to interaction noises. This is due to the fact that the user-item interaction graph and user-user social graph are modeled by the same neural operations, which may be unnecessary. Although identifying users' friends based on trust and influence information is more efficient and interpretable than relying on ratings, the effectiveness of these methods is compromised by the unavailability of explicit social graphs in many real-world scenarios. Furthermore, calculating users' trust values is a critical step in the social recommendation process. As trust originates in the subjective experiences of individuals, the existing trust information cannot fully extract the implicit user preference information in social networks. Therefore, accurately measuring trust relationships and examining their role in item recommendation is essential. Exploiting the implicit social relations between users is particularly important for modeling a new user representation. Furthermore, considering the importance of different user-item interactions in the user-item interaction graph and social relations (i.e., social trust and influence) is crucial for establishing item representations.
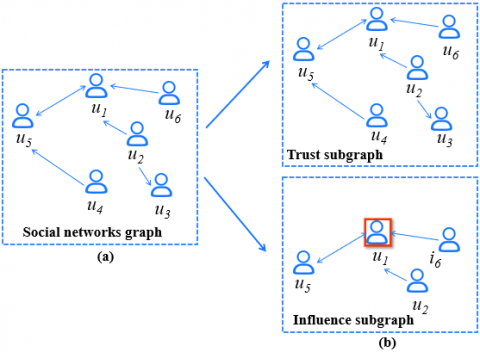
Secondly, current social recommendation models primarily develop static models, leveraging local neighbors of each user without simulating the recursive diffusion in the global social network, leading to suboptimal recommendation performance. These models neglect the potential embedding for each user, which is influenced by their trusted users and, in turn, the social connections of those trusted users. As social influence recursively propagates and diffuses throughout the social network, the interests of each user change in the recursive process. Contrary to the performance improvement achieved by considering the first-order local neighbors of each user, it is argued that the social diffusion should exhibit a dynamic recursive effect on each user's embedding rather than occurring at one time. Precisely simulating the recursive diffusion process in the global social network would better model each user's embedding, thus improving social recommendation performance. Social influence analysis [15] involves evaluating the impact of each user on their information or social behavior according to a certain standard, aiming to identify individuals with significant influence within their group or social network. For example, as depicted in Figure 2, social networks often contain multiple mutual trust and influence relations. These relations are typically asymmetric, meaning that two users might have trust relations and influences in opposite directions. Specifically, in Figure 2(a), user $u_1$ and $u_5$ trust each other, while in Figure 2(b), user $u_1$ is trusted by user $u_5$, $u_2$, and $u_6$ and influences them.
Figure 2. An illustration of implicit social relations (trust and influence) for social recommendation through a toy example
To address the aforementioned shortcomings, a novel Graph Convolution Network framework with implicit Trust and Influence (TIGCN) is proposed. This approach augments user-item representations by exploiting implicit social relations of users and items in the predictive model, effectively alleviating the sparsity of user behavior data. In contrast to traditional GCNs that solely consider the user-item interaction graph for recommendation, the construction of user-user trust graph and user-user influence graph is based on user-user bipartite graph and embeddings to exploit inter-user implicit relations. Such a module could collaboratively explore the propagation process of user interests and social relations, thereby enhancing the robustness of recommendation systems. The contributions of this work can be summarized as follows:
(1) A novel Graph Convolution Network framework with implicit Trust and Influence (TIGCN) is proposed, consisting of three layers: the embedding layer, multiple embedding propagation, and the model prediction layer. TIGCN enhances user-item representations by exploiting user-user implicit social relations (i.e., social trust and influences) among entities in the predictive model, thereby better alleviating interaction noise issues and data sparsity.
(2) Two adjacency matrices are introduced, considering user trust and influences as two bipartite graphs. This module can explore the propagation process of user trust and social influence, thus improving the robustness of recommendation systems. Moreover, a novel trust measurement model is employed to quantify implicit trust in social networks. The trust value encompasses three aspects: user interaction, item rating, and user preference. Additionally, the most influential users are determined by the SH method, effectively addressing the extreme data sparsity of recommendation systems.
(3) A series of experiments are conducted on real-world datasets, namely Ciao, Epinions, and FilmTrust. Extensive experiments demonstrate that TIGCN significantly outperforms various state-of-the-art baselines, such as FSTID, LightGCN, and SocialLGN. Further analysis confirms the superior representation ability of the TIGCN recommendation framework in alleviating data sparsity.
The herein proposed Temporally Interacting TIGCN is composed of three major components: an embedding layer, an embedding propagation layer, and a prediction layer (as shown in Figure 3).
(1) The embedding layer, which serves as the foundation, allows for the initialization of user and item embeddings. These are established in accordance with a probability conforming to a standard normal distribution. This initialization lays the groundwork for potential user-item collaborative relations, which are iteratively optimized during subsequent training stages of the recommendation model.
(2) The embedding propagation layer, following the initialization, administers graph convolution operations to the user and item embeddings. These operations are performed on three distinct graphs: user-item interaction graph, user-user trust graph, and user-user influence graph. This approach, which is inspired by the LightGCN methodology [16], enables the propagation of embeddings by eliminating linear transformation and non-linear activation operations.
(3) Lastly, the prediction layer operates to aggregate the refined embeddings received from different propagation layers, producing an affinity score for each user-item pair. These scores serve as the final output of the model, predicting the results of the recommendation.
Model training is a crucial element in the successful application of the TIGCN and is detailed below.
For the effectiveness of the proposed model, recent works are considered which exploit user-item relationships for improving the quality of representation. The process of collaborative information enrichment is carried out by considering implicit information from multi-hop neighbors. Recommendations systems today, in accordance with the user's history, are personalized and recommend based on closely related entities. As such, it is essential to consider user-specific components for achieving fruitful results in the recommendation model.
In conclusion, the TIGCN model offers a comprehensive approach to user-item recommendation systems. It initiates the user and item embeddings in accordance with a probability model, subsequently applies graph convolution operations to them, and then aggregates the refined embeddings to produce prediction scores. This model, which encompasses current research in the field, aims to offer effective user-specific recommendations by employing a deep understanding of user-item relationships.
2.1 Embedding layer
Pioneered by contemporary recommendation models [16, 17], an initial step involves the representation of each user u and item i as embedding vectors $e_u \in \mathbb{R}^d$ and $e_i \in \mathbb{R}^d$ respectively. Here, d signifies the embedding size. An expression of the embeddings of N users and M items can be encapsulated by matrix E, as denoted by:
$E=\left[e_{u_1}, \cdots e_{u_N}, e_{i_1}, \cdots e_{i_M}\right]$ (1)
The initialization stage of the embeddings primes the user-item potential collaborative signals, which are subsequently captured in the model's training process. This process includes mapping the graph's node feature into a low-dimensional space, iteratively optimizing the embeddings, and updating the user and item embedding matrices via aggregation and propagation.
2.2 Embedding propagation layers
An accurate representation of high-order user-item interaction, drawn from explicit user-item relationships and implicit social connections, poses a significant challenge in standard recommendation scenarios. Building upon the recent LightGCN concept [16], this section proposes an enhanced user-item representation methodology that aligns a user-item interaction graph (as depicted in Figure 4(b)) and social relations inferred from user-user trust and influence graphs (as illustrated in Figure 4(a)). These methods significantly elevate the accuracy of the recommendation system.
Presented in Figure 3 is the newly designed TIGCN model. This model first computes the trust value based on the initial trust value and each user's preference degree, thus forming the trust network. Subsequently, the saliency histogram (SH) is utilized to identify key nodes within the social network, allocating them into the influential users' set. The final part of this section outlines the update processes of user and item embeddings.
Figure 3. An illustration of our TIGCN model architecture
(a)
(b)
Figure 4. An illustration of embedding propagation layers
2.2.1 Calculation of users’ trust value
In the process of social recommendation, the trust value calculation between users serves as a pivotal step. The origin of trust stems from an individual's subjective experience. It is deduced that a higher degree of trust between user u and user v equates to a greater similarity between them. The trust value between users is shaped by the nature and results of their interaction. A successful interaction enhances the trust value and vice versa. Additionally, preference differences due to differing user interests over items vary the trust influence resulting from interactions.
To accommodate this, a trust relation measurement model considering users' interaction information and preference is utilized. This accounts for users' scoring and preference degree over various items comprehensively. The model is based on the following two hypotheses:
(1) An interaction is assumed between two users if they have both interacted with a single item.
(2) An interaction's success or failure is determined by whether the score of item i, given by users u and v, is higher or lower than each user's average score. Here, rv,i, rv,i indicate the evaluations of item i by users u and v, respectively, while u and v denote the average scores of user u and v, respectively.
$\begin{cases}\text { success, } & \left(r_{v, i}-\bar{u}\right) *\left(r_{u, i}-\bar{u}\right) \geq 0 \\ \text { failure, } & \left(r_{v, i}-\bar{u}\right) *\left(r_{u, i},-\bar{u}\right)<0\end{cases}$ (2)
The trust measurement of user u over user v, given that they have at least one common item (Iu∩Iv ≠φ), is derived as follows:
$\begin{aligned} & T(u, v)=\operatorname{Init}(u, v) \times \frac{\sum_{i \in \text { success }} \operatorname{Pre}(u, i)-\sum_{i \in \text { failure }} \operatorname{Pre}(u, i)}{\sum_{i \in \text { success }} \operatorname{Pre}(u, i)-\sum_{i \in \text { failure }} \operatorname{Pre}(u, i)} \\ & \end{aligned}$ (3)
The initial trust value, denoted as $\operatorname{Init}(u, v)$, is calculated using:
$\operatorname{Init}(u, v)=\frac{\min \left(\left|I_u\right|\left|I_v\right|, D_u\right)}{D_u}$ (4)
The threshold value $D_u=\sqrt{\left|I_u\right|}$ indicates the minimum interaction times for two users to fully trust each other. $\operatorname{Pre}(u, v)$ is the preference degree of user u over item i:
$\operatorname{Pre}(u, i)=\frac{\sum_{o \in U_i} \operatorname{sim}(u, 0)}{U_i}$ (5)
$U_i$ represents the set of users who have already scored item i. The greater the similarities user u shares with others in this set, the more he prefers item i. The classic measurement of two variables' relevance by the Pearson Correlation Coefficient (PCC) formula, proposed by Karl Pearson in the 1880s [18], is utilized to estimate these similarities. With the introduction of the common tests' number weight parameters and the PCC adjustment between 0 and 1, the similarity formula is modified as:
$\operatorname{sim}(u, o)=\left(\begin{array}{c} \left.\frac{1}{2}+\frac{\sum_{i \in I_U \cap I_o}\left(r_{u, i}-\bar{u}\right)\left(r_{o, i}-\bar{o}\right)}{2 * \sqrt{\sum_{i \in I_U \cap I_o}\left(r_{u, i}-\bar{u}\right)^2 \sum_{i \in I_U \cap I_o}\left(r_{o, i}-\bar{o}\right)^2}}\right) \end{array}\right.* \frac{I_u \cap I_o}{I_u}$ (6)
Different weights are assigned to different items based on the user's preference in successful or unsuccessful interactions. Therefore, the final trust value $T(u, v)$ is obtained using Eq. (2).
2.2.2 Identification of influential users
The prevailing Structural Hole (SH) theory offers profound insights into identifying pivotal nodes within a social network, due to its extensive application across various fields. Developed initially by Burt, this theory elucidates the emergence of disparities in social capital by proposing the concept of structural holes, which refer to voids in the flow of information among individuals who are linked to a common entity, but remain unconnected to one another [19]. These holes imply that distinct information flows are accessible to individuals positioned on either side of the hole.
The computation of SH is relatively intricate, entailing two key indices: Burt's index and the Betweenness Centrality index. Burt's index incorporates four dimensions-Effective Size, Efficiency, Constraint, and Hierarchy-with Constraint playing a critical role [19]. On the other hand, the Betweenness Centrality index primarily refers to Freeman's overall network betweenness centrality [20], furthering its development to signify that a node's likelihood of occupying a structural hole position is higher if the node is situated on the shortest path of numerous other node pairs.
The constraint denotes the node's potential to utilize SH within its network, designating the evaluation criterion as the node's dependency value on other nodes. It can be represented by the following equation:
$C(i)=\sum_{j \in T_i^{-}}\left(p(i, j)+\sum_{q \in T_j^{-}} p(j, q) *(q, i)\right)^2$
$i \neq q \neq j$ (7)
where, $T_i^{-}$ represents users who trust user i. $p(i, j)$ symbolizes the proportion of energy that node i dedicates to sustaining its relationship with node j, compared to its total energy.
$p(i, j)=\frac{Z_{j i}}{\sum_{j \in T_i}-Z_{j i}}$ (8)
where, the connection between node j and node i is represented by $\langle j, i\rangle$; when a connection exists, it is defined as 1, otherwise, it is 0.
$Z_{j i}= \begin{cases}1, & <j, i>\neq \text { null } \\ 0, & <j, i>\neq \text { null }\end{cases}$ (9)
The term $\sum_{q \in T_j^{-}} p(j, q) *(q, i)$ is determined by the count of bridging node q between nodes i and j. Due to the strengthening ties among nodes i, j, q, closed triangles are increasingly formed, which hinders the widespread dissemination of information.
Accounting for the effect of i's in-degree and out-degree, the Eq. (7) is revised to:
$\begin{gathered}C(i)= \left(\sum_{j \in T_i^{-}}\left(p(i, j)+\sum_{q \in T_j^{-}} p(j, q) *(q, i)\right)^2\right) * \frac{\left|T_j^{+}\right|}{\left|T_j^{+}\right|+\left|T_j^{-}\right|} \\ i \neq q \neq j\end{gathered}$ (10)
2.2.3 Update processes of the user embedding and item embedding
The updates to the user and item embeddings are performed using the user-item interaction graph, the user trust graph, and the user influence graph. Where, qu(k), pu(k) and Ru(k) represent the user embeddings from the last layer, while ei(k) denotes the item embedding.
$q_u^{(k)}=\sum_{i \in N_u^I} \frac{1}{\sqrt{\left|N_u^I\right|} \sqrt{\left|N_i^I\right|}} e_i^{(k-1)}$ (11)
$p_u^{(k)}=\sum_{v \in N_u^T} \frac{1}{\sqrt{\left|N_u^T\right|} \sqrt{\left|N_v^T\right|}} e_u^{(k-1)}$ (12)
$t_u^{(k)}=\sum_{v \in N_u^S} \frac{1}{\sqrt{\left|N_u^S\right|} \sqrt{\left|N_v^S\right|}} e_u^{(k-1)}$ (13)
$e_i^{(k)}=\sum_{u \in N_i^I} \frac{1}{\sqrt{\left|N_u^I\right|} \sqrt{\left|N_i^I\right|}} e_u^{(k-1)}$ (14)
where, $N_u^I$, $N_u^T$, and $N_u^S$ denote the user's neighborhood in the user-item interaction graph, user trust graph, and user-item interaction graph, respectively. The aggregation of embeddings of the user's neighboring nodes in the three graphs is used to update the user's embedding.
A fusion of the different user embeddings from the three graphs is then used to generate eu(k), employing the following equations:
$\tilde{e}_u^{(k)}=W_4\left(\sigma\left(W_1 q_u^{(k)}\right)|| \sigma\left(W_2 p_u^{(k)}\right)|| \sigma\left(W_3 t_u^{(k)}\right)\right)$ (15)
$e_u^{(k)}=\frac{\tilde{e}_u^{(k)}}{\left\|\tilde{e}_u^{(k)}\right\|_2}$ (16)
The tanh function is denoted by $\sigma$, with W1, W2, W3$\in$$\mathbb{R}^{d * d}$ ,W4$\in \mathbb{R}^{d * 3 d}$ being the trainable matrix. The formulation of Eq. (15) prevents $e_u^{(k)}$ from increasing excessively with the rise of $k$.
$e_u=\sum_{k=0}^K \alpha_k e_u^{(k)} ; e_i=\sum_{k=0}^K \alpha_k e_i^{(k)}$ (17)
where, $\alpha_k$ represents the weight value of the k-th layer embedding used in the final embedding. To circumvent unnecessary complexity, $\alpha_k$ is set uniformly as $1 / k+1$, generally resulting in robust performance.
This paper also presents the matrix form of the proposed layer-wise propagation rule for embedding propagation in TIGCN:
$E^{(k)}=\operatorname{LeakyReLU}\left((\mathcal{L}+I) E^{(k-1)} W_1^l+\mathcal{L} E^{(k-1)}\right.$ $\left.\bigodot E^{(k-1)} W_2^k\right)$ (18)
where, ${E^{(k)} \in \mathbb{R}^{(N+M) * d_k}}\quad$ is the representation sets for users and items obtained after $k$ layers of embedding propagation, $E^{(0)}$ is set as $E$ at the initial message-passing iteration, $\mathcal{L}$ represents the Laplacian matrix for the user-item graph, which is formulated as:
$\mathcal{L}=D^{-\frac{1}{2}} A D^{-\frac{1}{2}}, \mathrm{~A}=\left(\begin{array}{cc}0 & R \\ R^T & 0\end{array}\right)$ (19)
where, $R \in \mathbb{R}^{N+M}$ is the user-item interaction matrix, and M and N denote the number of users and items, respectively, A is the adjacency matrix and D is the diagonal degree matrix, each entry $R_{u i}$ is rating if u has interacted with item i otherwise 0, which augments user-item representations by explicitly exploiting the feedback.
2.3 Prediction layer
The prediction layer in our model combines the aggregation and propagation layers to capture dependencies and explore higher-order connectivity. By observing the influence of learning results in experiments, we find that representations obtained from different layers emphasize messages passed over different connections, contributing differently to reflecting user preferences. The final vector representations of user and item embeddings, $e_u$ and $e_i$ respectively, are obtained through this process. The value of l, representing the number of layers, is crucial as it determines the effectiveness of extracting embedding vectors while avoiding insufficient information extraction. A larger value implies higher space and time complexity, while a smaller value indicates the opposite.
The model prediction is defined as the inner product of the user and item final representations:
$\hat{y}_{u i}=e_u^T e_i$ (20)
This ranking score is used to measure the recommendation priority of different items in the recommendation system. A higher ranking score suggests a stronger recommendation for the item to the user, indicating a higher similarity between the user and item vectors. The ranking score calculation is computationally efficient, making it suitable for large-scale recommendation systems. Furthermore, it serves as the basis for parameter optimization during model training.
To optimize the model parameters, we employ the Bayesian Personalized Ranking (BPR) loss [21]. The BPR loss aims to maximize the observed order of item interactions by users, giving higher ranks to items that users have interacted with compared to those they haven't.
$\mathcal{L}_{B P R}=\sum_{(u, i) \in N_{u,}^I(u, j) \notin N_u^I}\quad-\ln \sigma\left(\hat{y}_{u i}-\hat{y}_{u j}\right)+\lambda\left\|E^{(0)}\right\|_2^2$ (21)
where, $N_u^I$ represents the neighborhoods of user u in the user-item interaction graph. The trainable parameters of our model, TIGCN, are limited to the embeddings of the 0-th layer denoted as $E^{(0)}$, and the $L_2$ regularization strength is controlled by ℷ.
2.4 Space complexity
In terms of space complexity, our model consists of two parts: user and item embedding, and trainable parameters in graph fusion. Similar to the embedding-based model LightGCN [16], the latent dimensions for each node (n users and m items, with the dimension d) need to be stored, resulting in a space complexity of $(n+m) \times d$ for this part. As for the trainable parameters in graph fusion, we have four trainable matrices: W1, W2, W3 and W4. Among these, W2, W3 and W4 are $d \times d$ matrices, while W1 is a 2d×d matrix. Therefore, the total space complexity is $(n+m+4 d) \times d$, with d significantly smaller than $(n+m)$ , rendering it negligible. Thus, the proposed TIGCN demonstrates reasonable space complexity.
In this section, the experimental setups (Sections 3.1, 3.2, and 3.3) are presented, and the corresponding results of the proposed TIGCN model are compared to state-of-the-art recommendation models, with a particular focus on the embedding propagation layer.
3.1 Datasets
To ensure the model's unbiasedness, we conducted experiments on three publicly accessible real-world datasets: Ciao, Epinions, and Filmtrust. These datasets are independent of each other and differ in application domain, data size, and data sparsity.
Table 1. Statistics of the experimented datasets
|
Datasets |
Users |
Items |
Interaction |
Sparsity |
|
Ciao |
7375 |
106797 |
99746 |
0.004 |
|
Epinions |
22166 |
296277 |
919224 |
0.00013 |
|
Filmtrust |
1508 |
2071 |
40163 |
0.0114 |
The attributes of these datasets are outlined in Table 1. Filmtrust exhibits higher data sparsity. An important observation is the impact of sparsity on the model's recommendation performance. The dataset details are as follows:
(1) Ciao: An online shopping dataset consisting of 7375 users and 106797 items. Users rate items to express their attitudes towards them.
(2) Epinions: Collected from Epinions.com, this dataset comprises 22166 users and 296277 items.
(3) Filmtrust: Collected from filmtrust.com, a platform where users can rate and comment on movies, this dataset contains 1508 users and 2071 items.
3.2 Baselines
To assess the performance improvement of the TIGCN model, we conducted comparative experiments with current advanced recommendation models. The models used for comparison are as follows:
(1) SocialLGN [3]: This model propagates the representation of each user and item in the user-item interaction graph using light graph convolutional layers. Simultaneously, the user's representation is propagated in the social graph. Finally, it combines the user presentation from both graphs to obtain the final user embedding for prediction.
(2) FST [22]: The Factored Similarity Model with Trust (FST) incorporates the mutual trust matrix and user similarity matrix into the Factored Item Similarity Models (FISM) [23] to alleviate sparsity in top-N recommender systems and enhance ranking recommendation accuracy.
(3) FSTID [24]: The Factored User and Item Similarity Model with Trust and Social Influence based on deep learning leverages deep learning techniques to configure the features in Matrix Factorization (MF) rather than using random initialization. Additionally, it introduces a trust measurement model to quantify implicit trust strength.
3.3 Evaluation protocols
In this section, the all-ranking protocol and employ four evaluation metrics: Precision@N, Recall@N and NDCG@N are adopted. The evaluation metrics are defined as follows:
Precision@N $=\frac{1}{|\bar{U}|} \sum_{u \in \bar{U}} \frac{\left|R_u \cap I_u\right|}{N}$ (22)
Recall@N $=\frac{1}{|\bar{U}|} \sum_{u \in U} \frac{\left|R_u \cap I_u\right|}{\left|I_u\right|}$ (23)
$N D C G @ N=\frac{1}{|\bar{U}|} \sum_{u \in \bar{U}} \frac{D C G @ N}{I D C G @ N}$ (24)
In the experiments, the recommendation list length N is set to 10. $\bar{U}$ represents all users in the test set. $R_u$ denotes the set of recommended items for user u, while $I_u$ represents the set of items that user u has interacted with. Precision@N, Recall@N and NDCG@N respectively measure the precision, recall rate, and NDCG (Normalized Discounted Cumulative Gain) for the recommended items.
3.4 Performance comparison with state-of-the-arts
In this section, the proposed model is evaluated using three real-world datasets and its performance is compared with other state-of-the-art recommendation models, including SocialLGN, FST, and FSTID. The following observations can be made:
(1) Experimental results on the Ciao, Epinions, and Filmtrust datasets, with N=5 and N=10, are presented in Table 2. Our proposed model, TIGCN, consistently outperforms the other recommendation models in terms of accuracy and effectiveness. This superiority can be attributed to the utilization of graph structures for message propagation, which leads to performance improvements.
(2) TIGCN incorporates implicit social relations (i.e., social trust and influences) representation, which enhances both the model's representational capacity and its recommendation performance. In most cases, TIGCN achieves better performance compared to the other recommendation models.
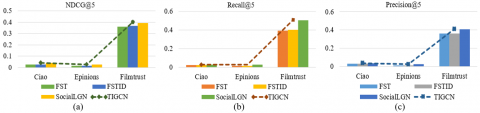
(3) Comparing TIGCN with FST and FSTID, it is evident that GCN-based models (SocialLGN and TIGCN) perform well on the experimental datasets. This demonstrates the superiority of the GCN method, as shown in Table 2, Figure 5, and Figure 6. The results clearly indicate that our model consistently outperforms the others. For instance, when compared to SocialLGN, TIGCN shows improvements of 2.7% in Recall@5 metric on the original Ciao dataset, 2.87% in Recall@10 metric on the original Epinions dataset, and 1.7% in NDCG@10 metric on the original Filmtrust dataset, respectively. These improvements can be attributed to the consideration of social relations (i.e., social trust and influences) and the effective utilization of rating data in the user-item interaction graph. The propagation mechanism in the social graph effectively mitigates the data sparsity problem. Moreover, TIGCN achieves improvements of 2.08% and 2.65% in Precision@5 and Precision@10 metrics, respectively, on the Ciao dataset compared to SocialLGN. Similarly, TIGCN outperforms SocialLGN on the Epinions dataset in terms of NDCG@5 and NDCG@10 metrics, showing improvements of 2.28% and 2.82% respectively. These results demonstrate TIGCN's capability in addressing data sparsity and the cold-start problem in social recommendation.
Table 2. Performance analysis on Precision@N, Recall@N and NDCG@N
|
Method |
FST |
FSTID |
SocialLGN |
TIGCN |
Improve |
|
|
Ciao |
Precision@5 |
0.0274 |
0.0292 |
0.0337 |
0.0344 |
0.0208 |
|
Recall@5 |
0.0242 |
0.0248 |
0.0259 |
0.0266 |
0.0270 |
|
|
NDCG@5 |
0.0272 |
0.0276 |
0.0409 |
0.0413 |
0.0098 |
|
|
Recall@10 |
0.0236 |
0.0236 |
0.0264 |
0.0271 |
0.0265 |
|
|
NDCG@10 |
0.0393 |
0.0393 |
0.0403 |
0.0412 |
0.0223 |
|
|
NDCG@10 |
0.0359 |
0.0359 |
0.0421 |
0.0429 |
0.0190 |
|
|
Epinions |
Precision@5 |
0.0124 |
0.01243 |
0.024 |
0.0245 |
0.0208 |
|
Recall@5 |
0.0163 |
0.0164 |
0.0202 |
0.0207 |
0.0248 |
|
|
NDCG@5 |
0.0145 |
0.0145 |
0.0263 |
0.0269 |
0.0228 |
|
|
Recall@10 |
0.0105 |
0.0105 |
0.021 |
0.0215 |
0.0238 |
|
|
NDCG@10 |
0.025 |
0.0251 |
0.0348 |
0.0358 |
0.0287 |
|
|
NDCG@10 |
0.0178 |
0.0178 |
0.0319 |
0.0328 |
0.0282 |
|
|
Filmtrust |
Precision@5 |
0.3613 |
0.3624 |
0.4067 |
0.4122 |
0.0135 |
|
Recall@5 |
0.3942 |
0.403 |
0.5041 |
0.5096 |
0.0109 |
|
|
NDCG@5 |
0.359 |
0.3688 |
0.3946 |
0.4013 |
0.0170 |
|
|
Precision@10 |
0.291 |
0.2952 |
0.3349 |
0.3381 |
0.0096 |
|
|
Recall@10 |
0.5462 |
0.5526 |
0.6108 |
0.6223 |
0.0188 |
|
|
NDCG@10 |
0.4512 |
0.5018 |
0.5414 |
0.5492 |
0.0144 |
|
Figure 5. Performance analysis on NDCG@5, Recall@5 and Precision@5
Figure 6. Performance analysis on NDCG@10, Recall@10 and Precision@10
In this work, a novel Graph Convolution Network framework with implicit Trust and Influence (TIGCN) is developed, augmenting user-item representations by exploiting implicit social relations of users and items in the predictive model. The most influential users are determined by the Structural Holes (SH) method. Specifically, user-user trust graphs and user-user influence graphs are constructed based on user-user bipartite social network graphs and embeddings to exploit inter-user implicit social relations, user trust features, and influence features, which are obtained from the user-user bipartite social network graph. These features serve as the input for the user-user trust graph and user-user influence graph, respectively. This module collaboratively explores the propagation process of user interest and social relations, enhancing the robustness of recommendation systems.
A series of experiments are conducted on real-world datasets: Ciao, Epinions, and FilmTrust. Experimental results demonstrate that TIGCN significantly improves performance over various state-of-the-art baselines, such as FST, FSTID, and SocialLGN. The experiments reveal that incorporating implicit social relations (i.e., social trust and influences) into a GCN-based approach improves the recommended Precision@5 by a maximum of 2.08%, Recall@5 by a maximum of 2.7%, NDCG@5 by a maximum of 2.28%, Precision@10 by a maximum of 2.65%, Recall@10 by a maximum of 2.87%, and NDCG@10 by a maximum of 2.82%.
One limitation of TIGCN is its reliance on the proposed graph convolution network model LightGCN [16]. Although the basic rationale behind the model is thoroughly elaborated in the literature, integrating implicit trust and influence relations in a complementary manner could further enhance the results. Another limitation stems from determining the most influential users with the traditional SH method, which only measures the influence relationship between a node and its nearest neighbor, without considering relationships between the node and its two-hop neighbors.
Despite the impressive results of TIGCN, constructing user trust relationship view, user influence relations view, and item view are three independent processes, increasing the difficulty of implementing the model. In future research, suitable feature extraction approaches for multimodal data, including text, audio, and video information, could be explored to enrich the representation of users and items. Additionally, the scalability of TIGCN for larger datasets and more complex graphs may be considered. The joint optimization strategy of self-supervised techniques and contrastive learning could be investigated for application in more recommendation-related scenarios, such as sequential recommendation.
This work was supported in part by the Fundamental Public Welfare Research Program of Zhejiang Province (Grant No.: LGF22F020036), and in part by the National Experimental Teaching Demonstration Center of Computer Science in China.
[1] Fan, W., Ma, Y., Li, Q., He, Y., Zhao, E., Tang, J., Yin, D. (2019). Graph neural networks for social recommendation. In The World Wide Web Conference, San Francisco, USA, pp. 417-426. https://doi.org/10.1145/3308558.3313488
[2] Tang, J., Hu, X., Gao, H., Liu, H. (2013). Exploiting local and global social context for recommendation. In Proceedings of the Twenty-Third International Joint Conference on Artificial Intelligence, Beijing, China, pp. 2712-2718.
[3] Liao, J., Zhou, W., Luo, F., Wen, J., Gao, M., Li, X., Zeng, J. (2022). SocialLGN: Light graph convolution network for social recommendation. Information Sciences, 589: 595-607. https://doi.org/10.1016/j.ins.2022.01.001
[4] Liu, H., Chen, Y., Li, P., Zhao, P., Wu, X. (2023). Enhancing review-based user representation on learned social graph for recommendation. Knowledge-Based Systems, 266: 110438. https://doi.org/10.1016/j.knosys.2023.110438
[5] Shao, B., Li, X., Bian, G. (2021). A survey of research hotspots and frontier trends of recommendation systems from the perspective of knowledge graph. Expert Systems with Applications, 165: 113764. https://doi.org/10.1016/j.eswa.2020.113764
[6] Taheri, S.M., Mahyar, H., Firouzi, M., Ghalebi K,E., Grosu, R., Movaghar, A. (2017). Extracting implicit social relation for social recommendation techniques in user rating prediction. In Proceedings of the 26th International Conference on World Wide Web Companion, Perth, Australia, pp. 1343-1351. https://doi.org/10.1145/3041021.3051153
[7] Xiao, X., Wen, J., Zhou, W., Luo, F., Gao, M., Zeng, J. (2022). Multi-interaction fusion collaborative filtering for social recommendation. Expert Systems with Applications, 205: 117610. https://doi.org/10.1016/j.eswa.2022.117610
[8] Dong, M., Yuan, F., Yao, L., Wang, X., Xu, X., Zhu, L. (2022). A survey for trust-aware recommender systems: A deep learning perspective. Knowledge-Based Systems, 249: 108954. https://doi.org/10.1016/j.knosys.2022.108954
[9] Song, W., Xiao, Z., Wang, Y., Charlin, L., Zhang, M., Tang, J. (2019). Session-based social recommendation via dynamic graph attention networks. In Proceedings of the Twelfth ACM International Conference on Web Search and Data Mining, Melbourne, Australia, pp. 555-563. https://doi.org/10.1145/3289600.3290989
[10] Huo, C., He, D., Liang, C., Jin, D., Qiu, T., Wu, L. (2023). TrustGNN: Graph neural network-based trust Evaluation via learnable propagative and composable Nature. IEEE Transactions on Neural Networks and Learning Systems. https://doi.org/10.1109/TNNLS.2023.3275634
[11] Guo, J., Zhou, Y., Zhang, P., Song, B., Chen, C. (2021). Trust-aware recommendation based on heterogeneous multi-relational graphs fusion. Information Fusion, 74: 87-95. https://doi.org/10.1016/j.inffus.2021.04.001
[12] Canturk, D., Karagoz, P., Kim, S.W., Toroslu, I.H. (2023). Trust-aware location recommendation in location-based social networks: A graph-based approach. Expert Systems with Applications, 213: 119048. https://doi.org/10.1016/j.eswa.2022.119048
[13] Yang, L., Liu, Z., Dou, Y., Ma, J., Yu, P.S. (2021). ConsisRec: enhancing GNN for social recommendation via consistent neighbor aggregation. In Proceedings of the 44th International ACM SIGIR Conference on Research and Development in Information Retrieval, Canada, pp. 2141-2145. https://doi.org/10.1145/3404835.3463028
[14] Pan, Y., He, F., Yu, H., Li, H. (2020). Learning adaptive trust strength with user roles of truster and trustee for trust-aware recommender systems. Applied Intelligence, 50: 314-327. https://doi.org/10.1007/s10489-019-01542-0
[15] Peng, S., Wang, G., Xie, D. (2016). Social influence analysis in social networking big data: Opportunities and challenges. IEEE Network, 31(1): 11-17. https://doi.org/10.1109/MNET.2016.1500104NM
[16] He, X., Deng, K., Wang, X., Li, Y., Zhang, Y., Wang, M. (2020). LightGCN: Simplifying and powering graph convolution network for recommendation. In Proceedings of the 43rd International ACM SIGIR Conference on Research and Development in Information Retrieval, New York, USA, pp. 639-648. https://doi.org/10.1145/3397271.3401063
[17] Wang, X., He, X., Wang, M., Feng, F., Chua, T.S. (2019). Neural graph collaborative filtering. In Proceedings of the 42nd international ACM SIGIR conference on Research and development in Information Retrieval, New York, USA, pp. 165-174. https://doi.org/10.1145/3331184.3331267
[18] Benesty, J., Chen, J., Huang, Y., Cohen, I. (2009). Pearson correlation coefficient. Noise Reduction in Speech Processing, pp. 1-4. https://doi.org/10.1007/978-3-642-00296-0_5
[19] Burt, R.S. (1995). Structural holes: The social structure of competition. Harvard University Press.
[20] Freeman, L.C. (1977). A set of measures of centrality based on betweenness. Sociometry, 40(1): 35-41. https://doi.org/10.2307/3033543
[21] Rendle, S., Freudenthaler, C., Gantner, Z., Schmidt-Thieme, L. (2012). BPR: Bayesian personalized ranking from implicit feedback. arXiv preprint arXiv:1205.2618. https://doi.org/10.48550/arXiv.1205.2618
[22] Jamali, M., Ester, M. (2010). A matrix factorization technique with trust propagation for recommendation in social networks. In Proceedings of the Fourth ACM Conference on Recommender Systems, Barcelona, Spain, pp. 135-142. https://doi.org/10.1145/1864708.1864736
[23] Kabbur, S., Ning, X., Karypis, G. (2013). FISM: factored item similarity models for top-n recommender systems. In Proceedings of the 19th ACM SIGKDD International Conference on Knowledge Discovery and Data Mining, New York, USA, pp. 659-667. https://doi.org/10.1145/2487575.2487589
[24] Zhang, X., Chen, X., Seng, D., Fang, X. (2019). A factored similarity model with trust and social influence for top-n recommendation. International Journal of Computers Communications & Control, 14(4): 590-607.